
A Bull Market for EAFE


Issue 49;
- The breadth surge continues.
- US mega-caps give way to global mid-caps.
- Software is now the weakest sector.
Global Trends is a deep dive into global equities. The aim of this analysis is to better understand which countries, sectors, industries, and stocks are driving market returns. Not only does it help investors identify opportunities, but it also highlights the risks. We try to condense as much important information as possible, focusing on what really matters each week. Embrace this as a weekly discipline, and you’ll soon have a much better understanding of global financial markets.
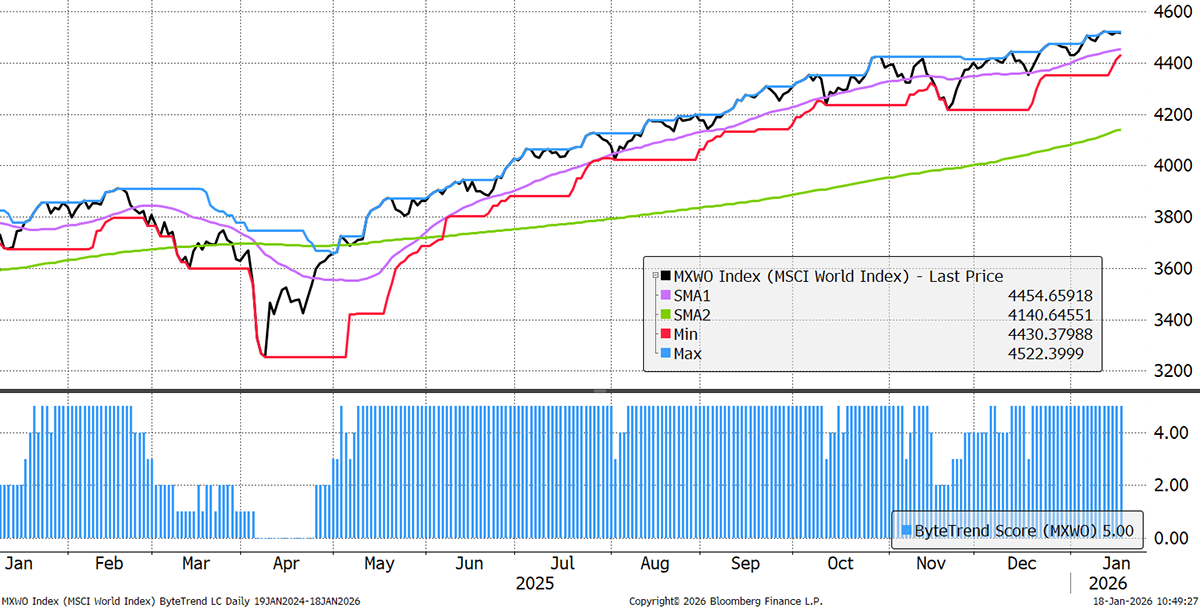
The World Index retains a ByteTrend Score of 5 and makes another all-time high. The news over the weekend about Greenland and tariffs may have an impact this week.
World Index – Developed Markets – Daily
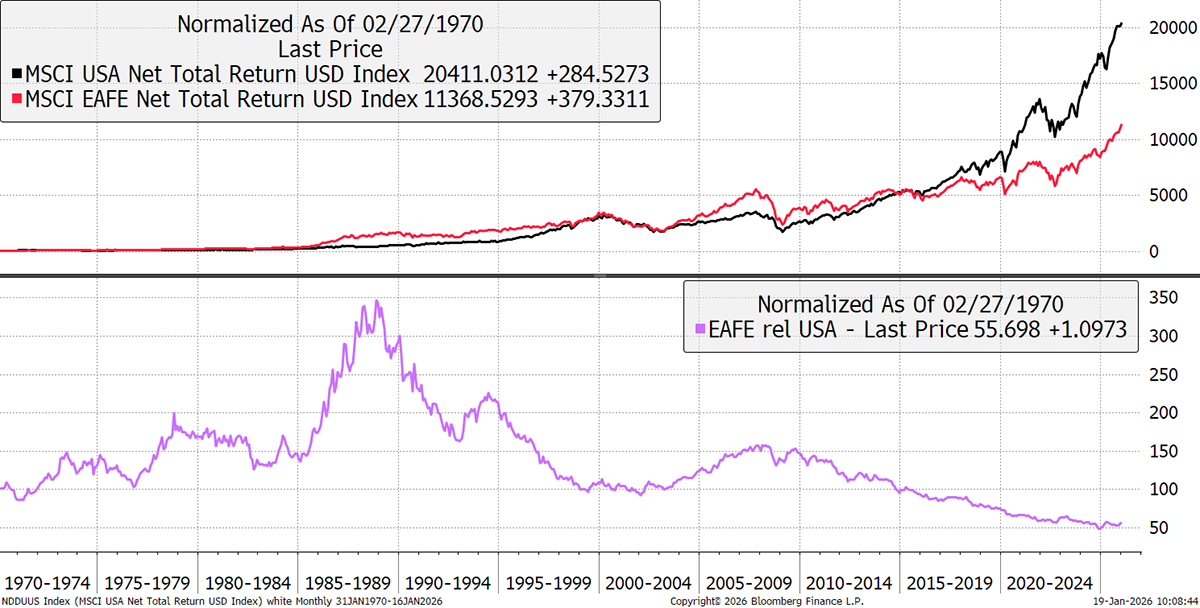
EAFE versus the USA
EAFE is the acronym for Europe, Australasia, and the Far East. Between 1970 and 1989, EAFE beat US stocks by 3.5x, the main driver being Japan. There was a spell of outperformance in the noughties, but that soon gave up. Since 1970, EAFE has delivered half the returns of US equities. The relative line (purple) has turned up, and a new era is upon us in global stockmarkets.
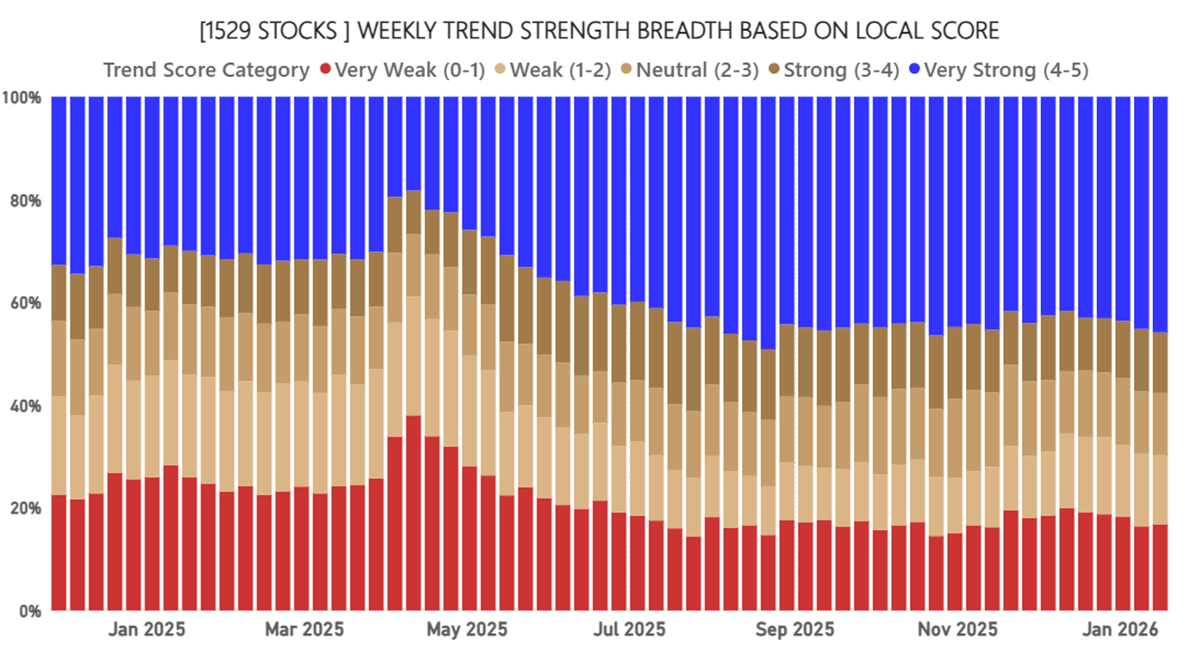
Market Breadth – Local Currency
Market breadth has improved again. The number of stocks in bullish trends (blue) with ByteTrend Scores of 5 has risen, while the bear trends (red), with ByteTrend scores of 0, have retreated. This is a function of the mega-caps now lagging the market.
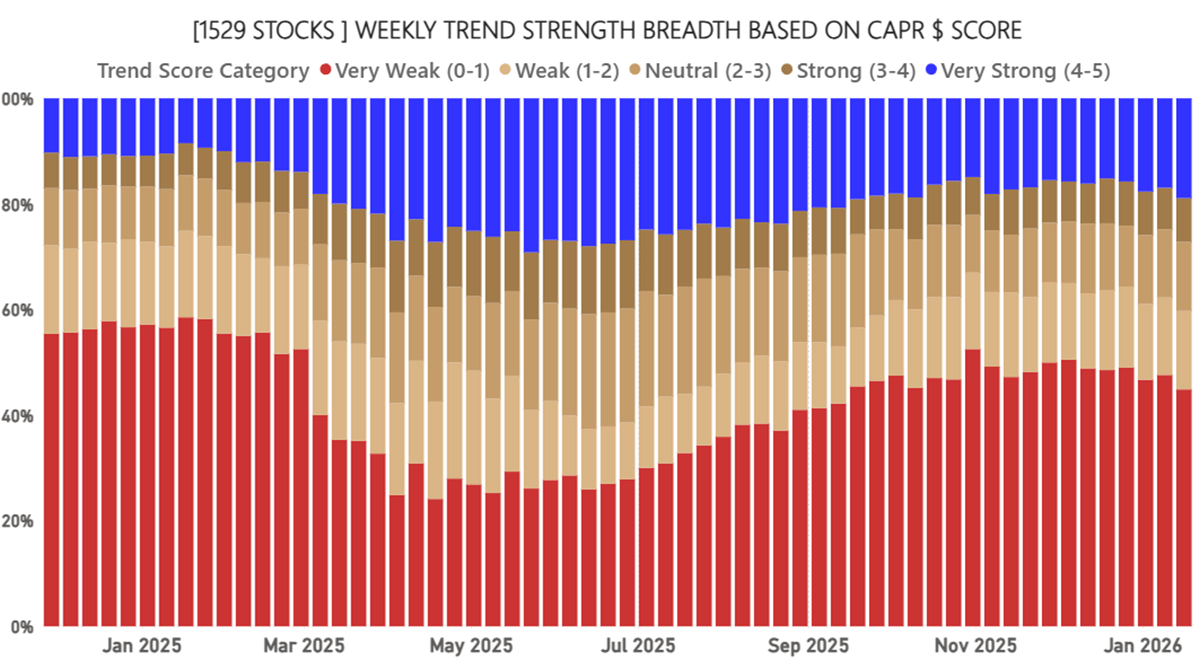
Market Breadth – CAPR
Market breadth has improved in CAPR as well. Alpha had been thin due to the mega-cap dominance, but it is now spreading. This is a good time for active managers to show their mettle, as there are more market-beating possibilities.
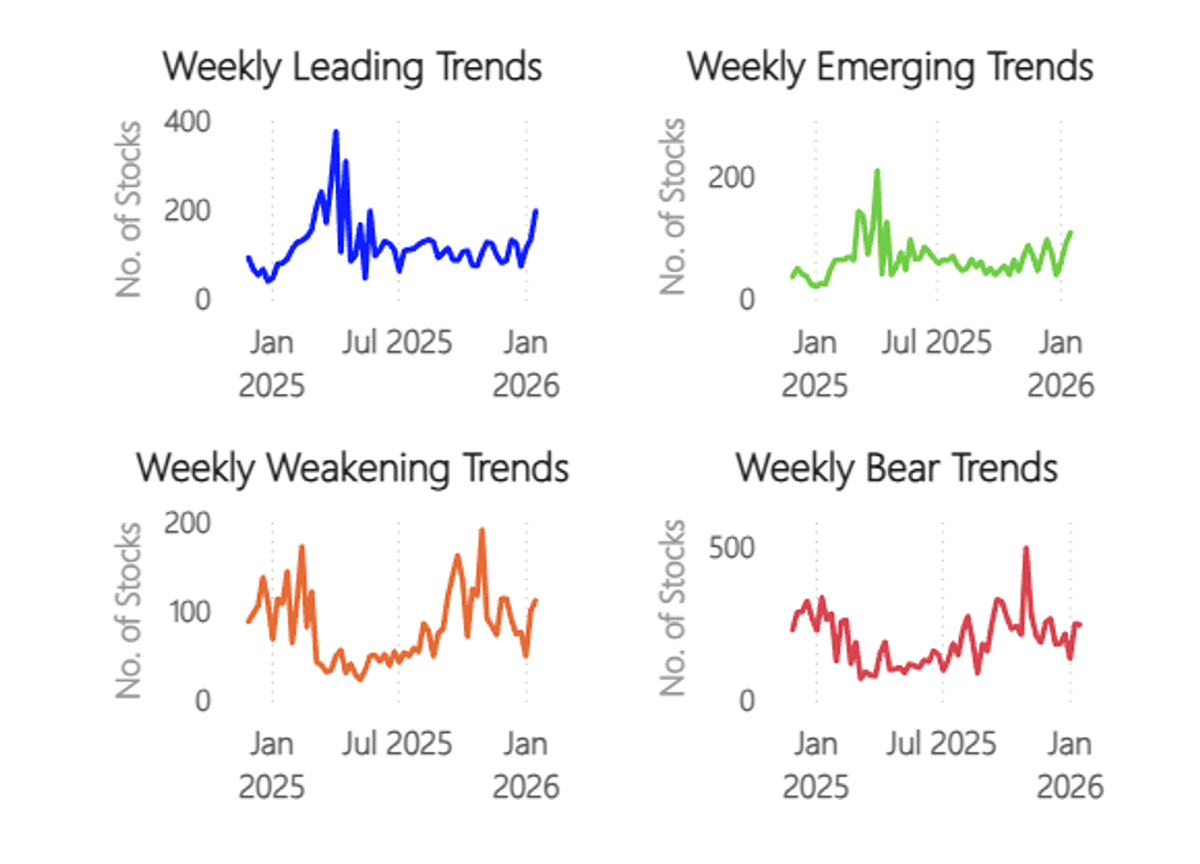
Surge in Bullish Trends – Local Currency
In local price terms, the market has once again shown high rotation. There is an expanding number of new leading and emerging highs, while weakening and bear trends are also growing in number.
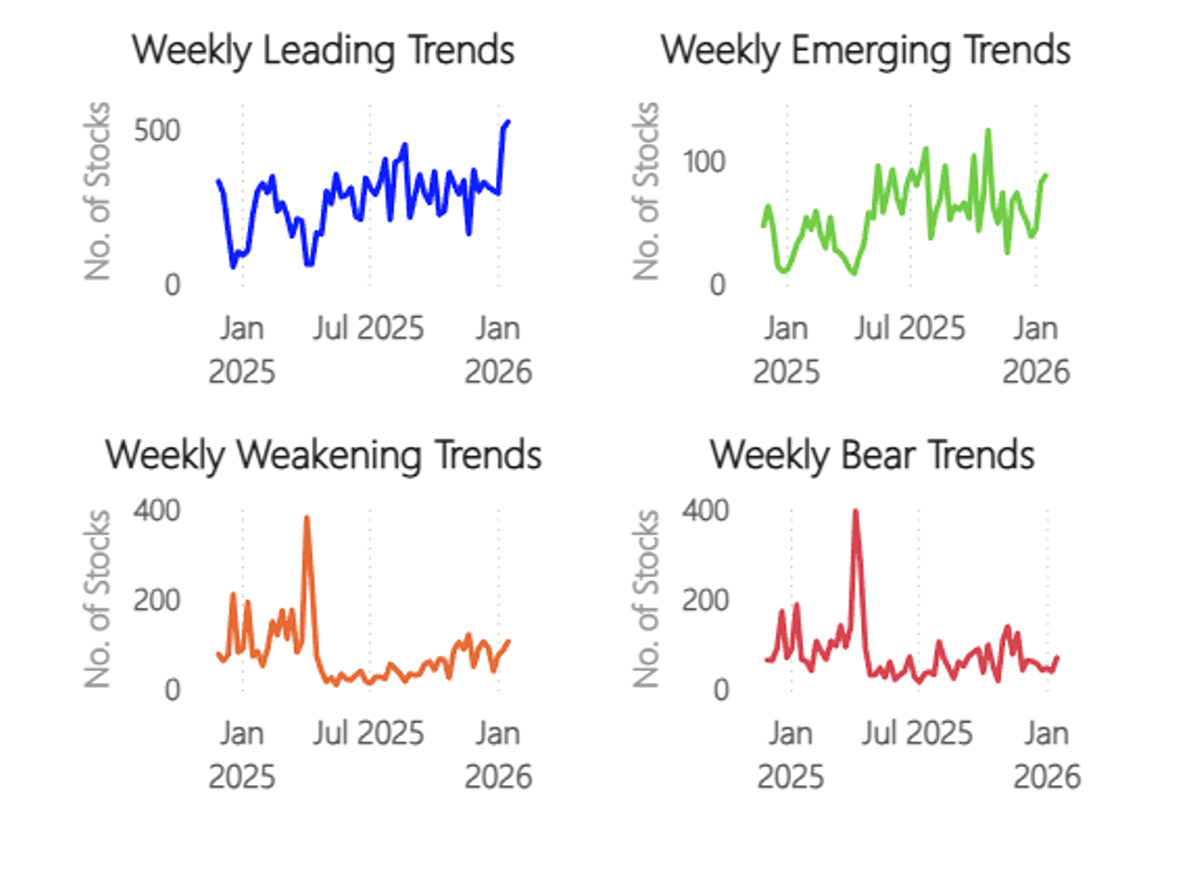
Surge in Bullish Trends - CAPR
In CAPR terms, the number of new market-beating stocks has surged.
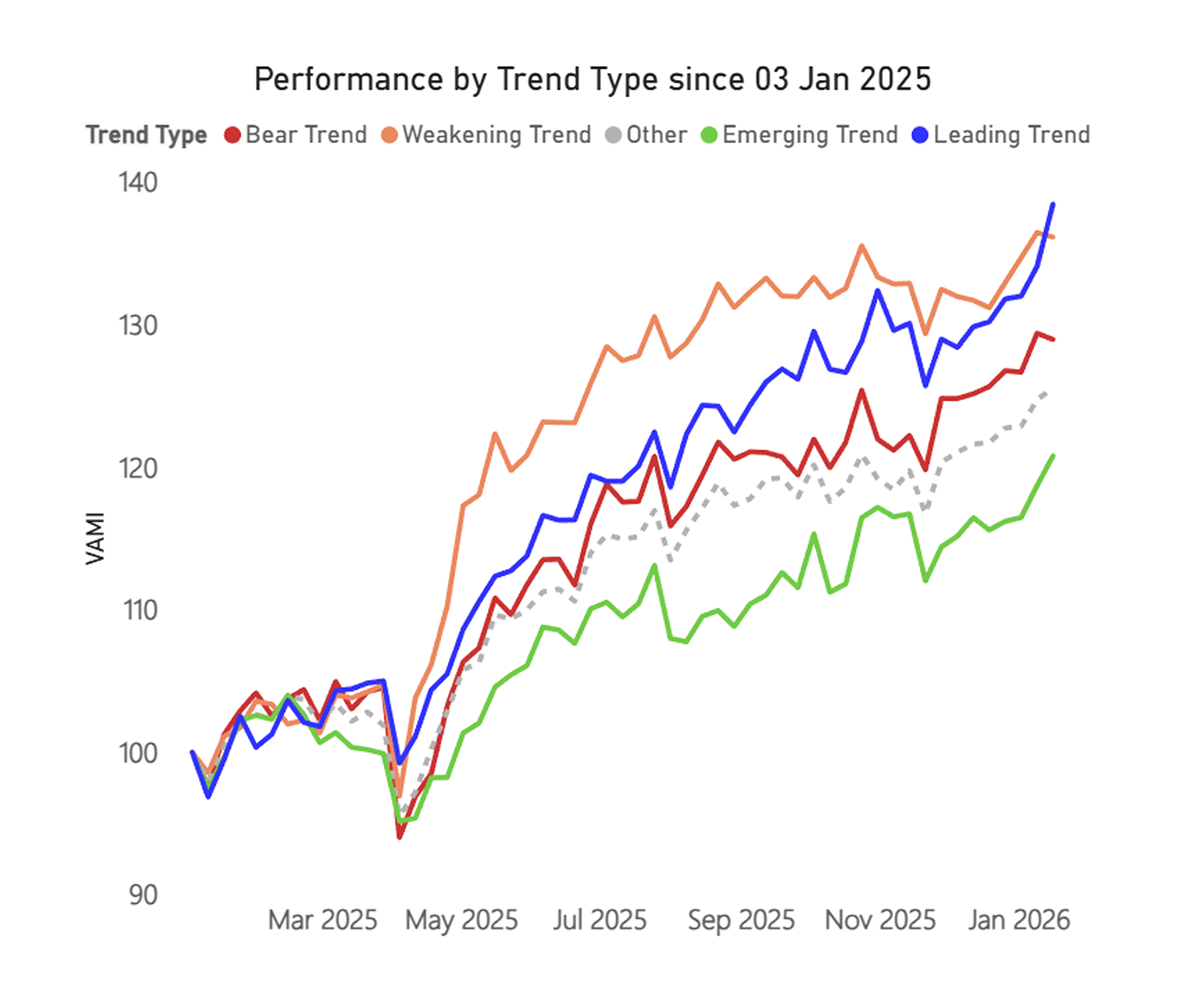
Performance by Trend Type
The leading trends are surging, and the emerging trends are picking up too. Weakening and bear trends have slowed.
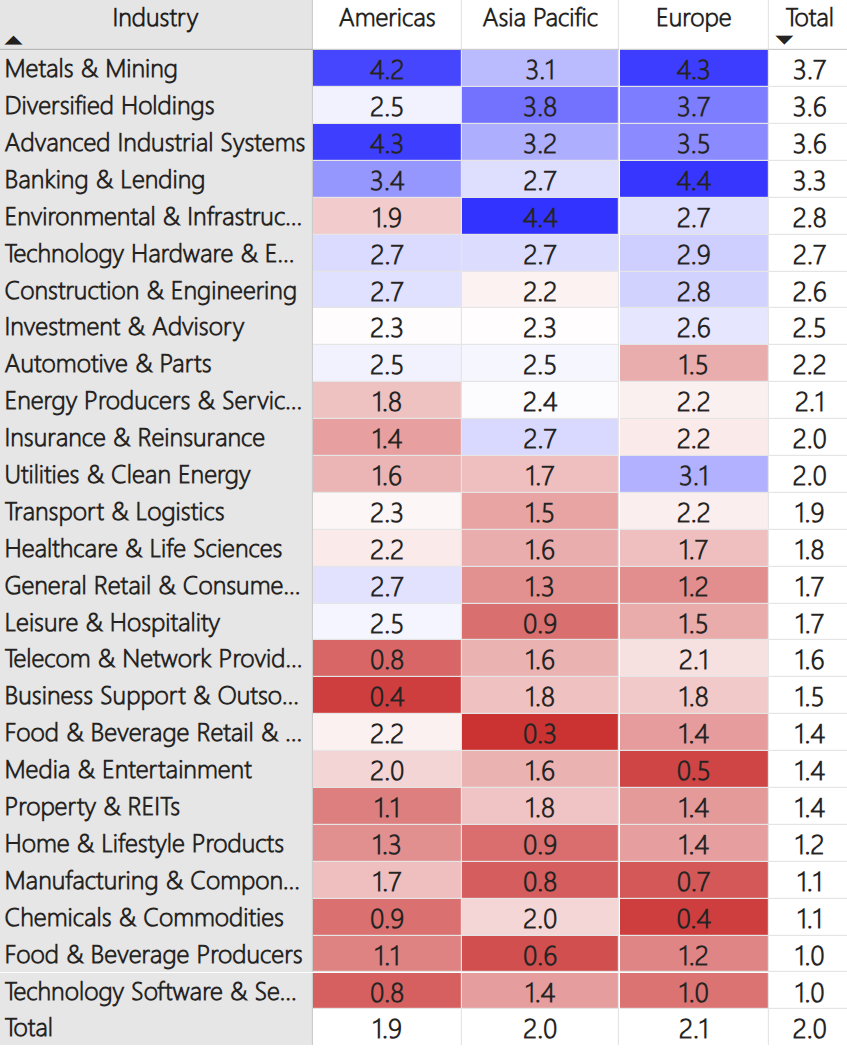
Regions and Industries Average CAPR Score
Metals & Mining regains the top spot, jumping from a 3.3 to a 3.7. The commodities rally is broadening, led by precious metals, but with copper, aluminium, lithium and others following suit. Oil is the last domino to fall, but so far it has proved remarkably sanguine about geopolitics.
The top four sectors remained the same, but Environmental & Infrastructure rose from 2.5 to 2.8, overtaking Tech Hardware. This is particularly notable in Asia, where it rose from 3.8 to 4.4 – the joint-strongest regional sector alongside EU Banking/Lending. In the Americas, however, it remains incredibly weak. In Asia, there are names like Komatsu (CAPR 5), and there are only 5 of them, all strong. In the Americas, it includes John Deere (1) and Waste Management (1), but also Paccar (5) and Caterpillar (5); a mixed bag.
Automotive and Parts continued to strengthen this week, led by Europe, which is emerging from its auto slump.
Tech Software now occupies the bottom slot, as investors flee the AI trade, despite no change in the fundamentals. Property and REITs rose across all regions, taking the average from 1.2 to 1.4. Falling rates will continue to benefit their recovery. Food & Beverage producers rose from 0.8 to 1.0.
The Value Composite Score (Value) is measured against the company’s own financial history and not in absolute terms. The columns are Cheap (Chp), Value (Val), Fair Value (FV), Overvalued (OV), and Expensive (Exp). The Growth Composite Score (Growth) is measured by sales, earnings cash flow, dividends, and book value on a per share basis. The columns are High, Good, Medium (Med), Low, and Negative (Neg).
Leading Trends with New Highs
These stocks are trading at the 30-week CAPR highs with a ByteTrend Score of 5. All charts shown are CAPR rebased to 100.
| Name | 360-Day Vol | Mkt Cap $Bn | Value | Growth |
| Alphabet Inc. | 27 | 3982 | OV | Good |
| Taiwan Semiconductor Manufacturing | 22 | 1427 | OV | High |
| Walmart Inc. | 20 | 954 | Exp | Med |
| Samsung Electronics Co., Ltd. | 34 | 676 | Exp | Med |
| ASML Holding N.V. | 40 | 526 | OV | Med |
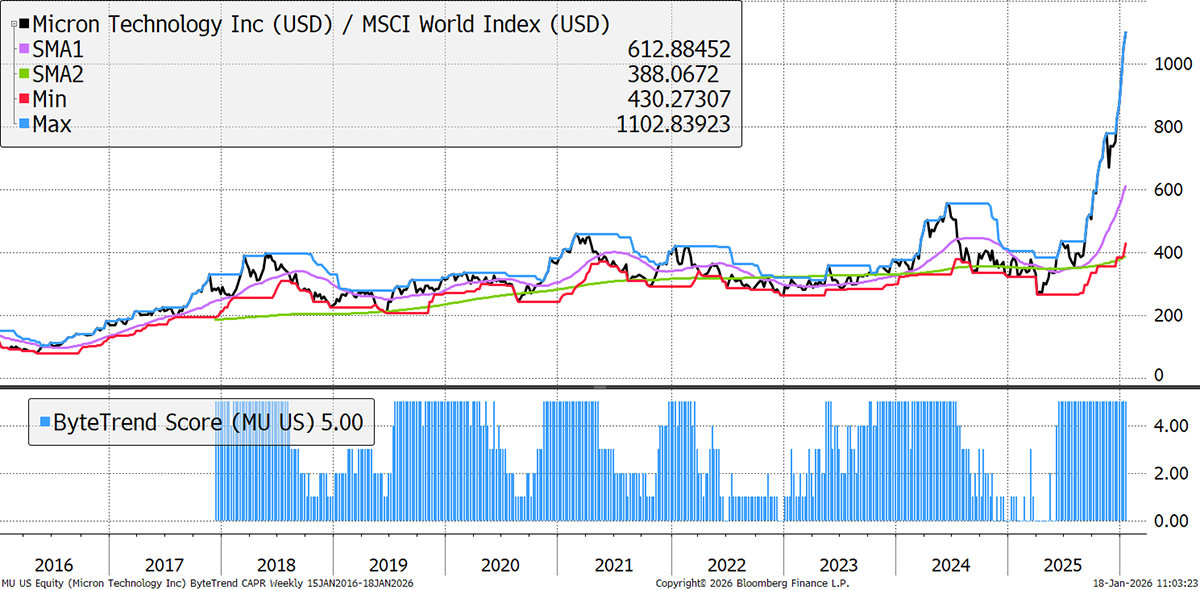
| Micron Technology, Inc. | 58 | 408 | Exp | Low |
| SK hynix Inc. | 54 | 354 | Exp | High |
| GE Aerospace | 22 | 343 | Exp | High |
| Caterpillar Inc. | 28 | 303 | Exp | Good |
| Morgan Stanley | 19 | 301 | OV | Good |
| The Goldman Sachs Group, Inc. | 20 | 291 | OV | High |
| HSBC Holdings plc | 22 | 283 | OV | High |
| Lam Research Corporation | 43 | 280 | Exp | Good |
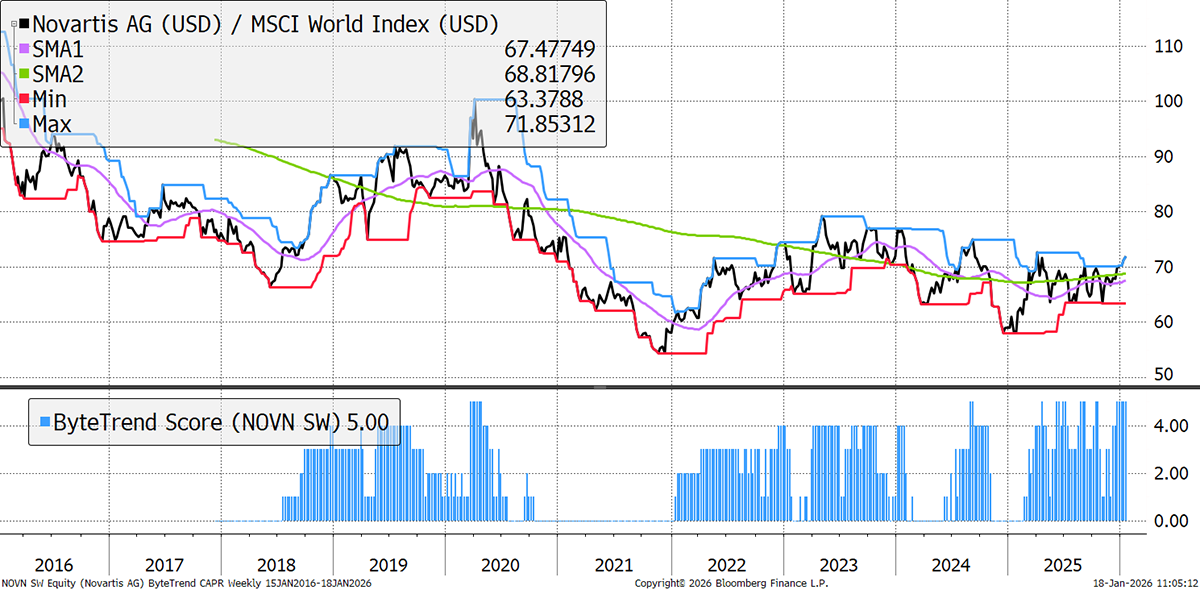
| Novartis AG | 20 | 277 | FV | Med |
| RTX Corporation | 24 | 271 | OV | Med |
| Applied Materials, Inc. | 41 | 261 | Exp | Med |
| Mitsubishi UFJ Financial Group, Inc. | 30 | 215 | Exp | High |
| KLA Corporation | 37 | 206 | Exp | Good |
| Airbus SE | 23 | 199 | OV | Good |
| Amphenol Corporation | 26 | 189 | Exp | Good |
| China Life Insurance Company Limited | 34 | 184 | OV | Good |
| Banco Santander, S.A. | 24 | 180 | OV | High |
| Southern Copper Corporation | 38 | 148 | Exp | Low |
| Analog Devices, Inc. | 33 | 147 | OV | Med |
| Banco Bilbao Vizcaya Argentaria, S.A. | 25 | 139 | Exp | High |
| Sumitomo Mitsui Financial Group, Inc. | 27 | 137 | Exp | High |
| Siemens Energy AG | 35 | 135 | Exp | High |
| Zijin Mining Group Company Limited | 39 | 134 | Exp | High |
| DBS Group Holdings Ltd | 16 | 130 | OV | High |
| Interactive Brokers Group, Inc. | 30 | 127 | OV | High |
| Newmont Corporation | 36 | 125 | OV | Neg |
| Tokyo Electron Limited | 54 | 122 | Exp | Good |
| Fast Retailing Co., Ltd. | 34 | 122 | OV | Good |
| Parker-Hannifin Corporation | 21 | 119 | Exp | Good |
| Investor AB (publ) | 15 | 116 | OV | Good |
| Enel S.p.A. | 12 | 110 | OV | High |
| Mizuho Financial Group, Inc. | 30 | 108 | Exp | High |
| State Bank of India | 13 | 106 | OV | High |
| General Dynamics Corporation | 15 | 99 | OV | Med |
| Agnico Eagle Mines Limited | 34 | 99 | OV | High |
| ITOCHU Corporation | 20 | 94 | Exp | Med |
| Mitsui & Co., Ltd. | 23 | 94 | Exp | Med |
| Delta Electronics, Inc. | 39 | 92 | Exp | High |
| Howmet Aerospace Inc. | 24 | 91 | Exp | High |
| Barclays PLC | 25 | 90 | OV | Good |
| Grupo México, S.A.B. de C.V. | 34 | 86 | OV | Neg |
| The Bank of New York Mellon | 16 | 85 | OV | High |
| ING Groep N.V. | 21 | 84 | OV | High |
| Barrick Gold Corporation | 36 | 83 | OV | Good |
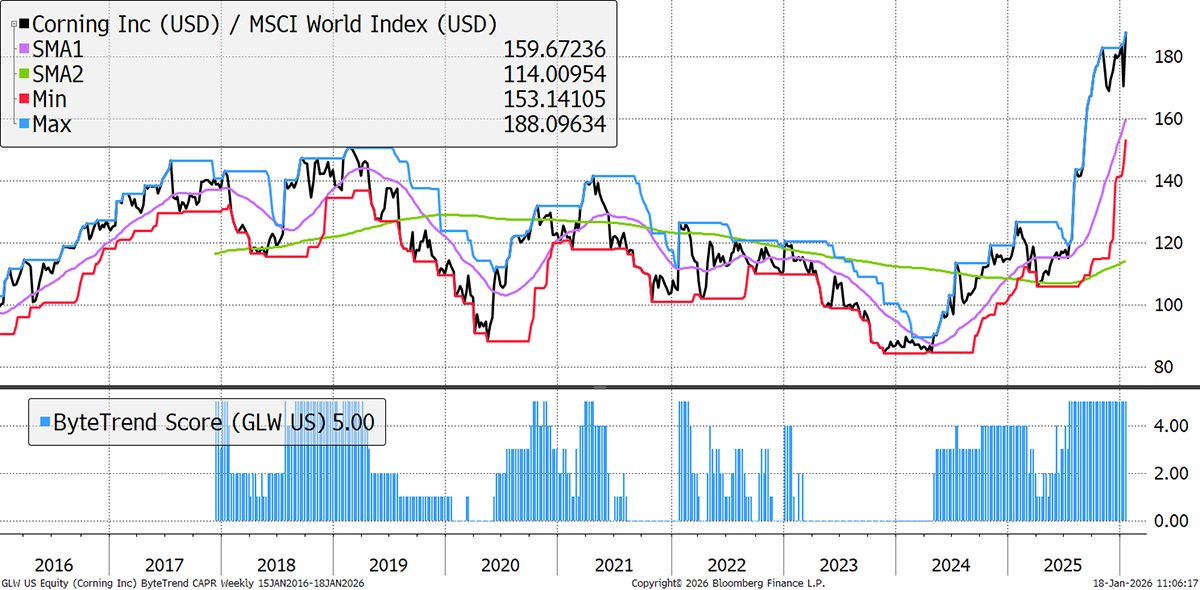
| Corning Incorporated | 30 | 81 | Exp | Neg |
| Lloyds Banking Group plc | 23 | 80 | OV | Good |
| Cummins Inc. | 22 | 80 | OV | High |
| Monster Beverage Corporation | 22 | 76 | FV | Good |
| Western Digital Corporation | 54 | 76 | Exp | Neg |
| ANZ Group Holdings Limited | 17 | 75 | FV | Good |
| Oversea-Chinese Banking | 14 | 71 | OV | High |
| Seagate Technology Holdings | 50 | 70 | Exp | Neg |
| AB Volvo (publ) | 28 | 69 | OV | Good |
| Engie S.A. | 17 | 67 | OV | High |
| Nordea Bank Abp | 16 | 67 | FV | High |
| Mitsubishi Electric Corporation | 25 | 66 | Exp | Good |
| Rocket Companies, Inc. | 49 | 66 | Exp | Neg |
| PACCAR Inc | 25 | 64 | OV | High |
| Manulife Financial Corporation | 15 | 63 | OV | Med |
| Ross Stores, Inc. | 19 | 63 | OV | Med |
| CMOC Group Limited | 54 | 62 | OV | High |
| Wheaton Precious Metals Corp. | 32 | 61 | Exp | Low |
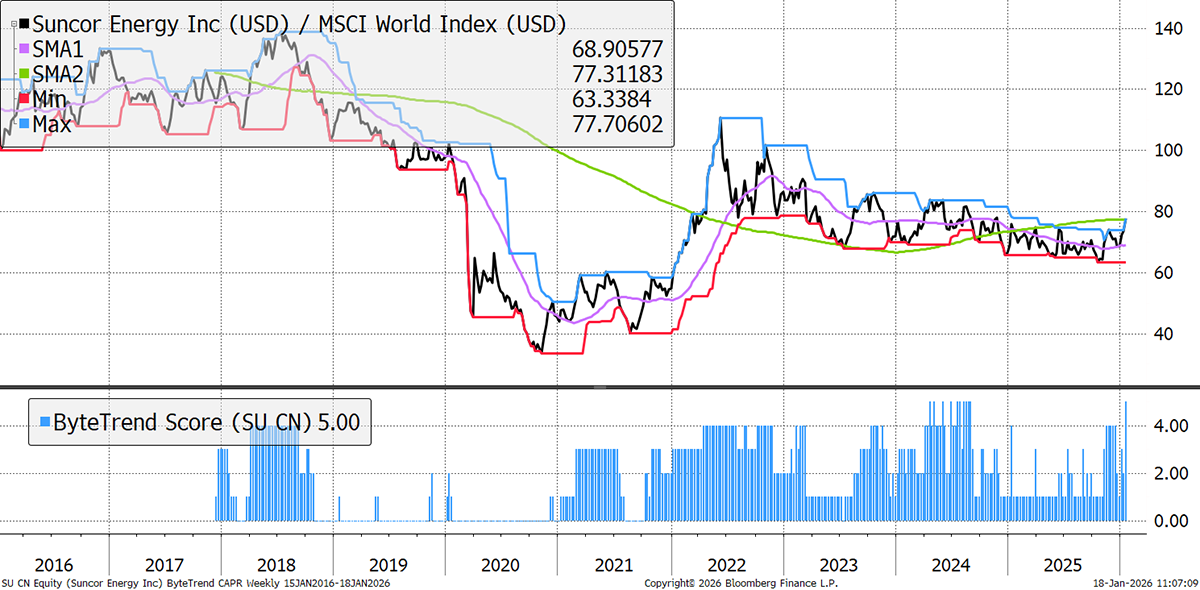
| Suncor Energy Inc. | 24 | 60 | FV | High |
| Hyundai Motor Company | 52 | 58 | OV | High |
| JAPAN POST BANK Co., Ltd. | 27 | 58 | OV | Med |
| Standard Chartered PLC | 28 | 57 | OV | High |
| KBC Group N.V. | 18 | 54 | OV | Low |
| Marubeni Corporation | 28 | 54 | Exp | Good |
| Emirates NBD Bank PJSC | 31 | 52 | FV | High |
| Cameco Corporation | 43 | 51 | Exp | High |
| AngloGold Ashanti Plc | 43 | 49 | Exp | High |
| Ferrovial SE | 17 | 49 | OV | High |
| HeidelbergCement AG | 30 | 48 | Exp | Good |
| Sumitomo Corporation | 23 | 48 | OV | High |
| Antofagasta plc | 34 | 47 | Exp | Neg |
| Rockwell Automation, Inc. | 18 | 47 | OV | Med |
| Hanwha Aerospace Co., Ltd. | 60 | 45 | Exp | High |
| ASSA ABLOY AB (publ) | 17 | 45 | FV | Good |
| China Hongqiao Group Limited | 42 | 45 | Exp | Med |
| Gold Fields Limited | 45 | 45 | Exp | Good |
| Sandvik AB (publ) | 18 | 45 | OV | Med |
| Skandinaviska Enskilda Banken AB | 12 | 43 | FV | High |
| Swedbank AB (publ) | 15 | 42 | FV | High |
| ASE Technology Holding Co., Ltd. | 47 | 42 | Exp | Neg |
| Disco Corporation | 52 | 42 | Exp | Good |
| Doosan Enerbility Co., Ltd. | 48 | 41 | Exp | Good |
| Toyota Tsusho Corporation | 26 | 41 | Exp | Good |
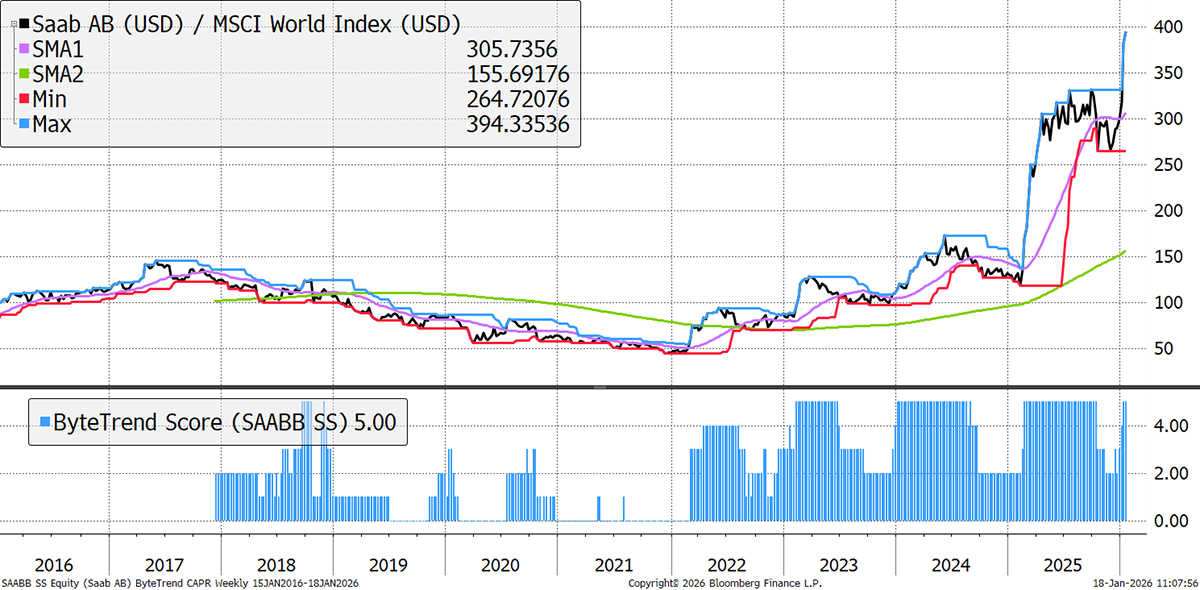
| Saab AB (publ) | 49 | 41 | Exp | Good |
| Kia Corporation | 35 | 40 | OV | High |
Micron
The shortage in memory chips, combined with the AI hype cycle, has created an astonishing rally in a small group of stocks, of which Micron is the leader. At 10x price-to-sales, it is nearly back to the record it set in August 2000 (12x). However, memory chips are famously cyclical, leading Micron to suffer four 50% crashes in the last decade alone.
Novartis
Swiss healthcare giant Novartis made a large acquisition (Avidity Biosciences) in 2025, worth $12bn. The high price tag made some investors wary, but it strengthens their neuroscience pipeline with late-stage assets, offering a good strategic fit.
Corning
Corning is a leader in materials science with key businesses in optical communications, display technologies, and life sciences. It divested its wireless infrastructure unit in early 2025, allowing it to focus on higher-value areas like AI-driven optical fibre and solar manufacturing.
Suncor Energy
Suncor, a Canadian integrated oil and gas major, boosted shareholder returns late last year, as it boasted good production levels alongside strong capital discipline. This has helped it stay resilient during a low oil price environment, while the brief oil spike in the last fortnight saw it immediately outperform.
SAAB
Swedish SAAB no longer makes cars. It is now a defence/aerospace business, driving Scandinavia’s rearmament. From warships and submarines to remote missile systems, recent orders have been large, driven by domestic supply chain preferences and Trump’s rhetoric and EU defence spending.
New Leading Trends
These stocks are trading at the 30-week CAPR highs with a ByteTrend Score of 5, except they are new trends this week, having previously had a score below 5. All charts shown are CAPR rebased to 100.
| Name | 360-Day Vol | Mkt Cap $Bn | Value | Growth |
| Toyota Motor Corporation | 25 | 302 | OV | High |
| Siemens AG | 25 | 237 | OV | Good |
| Safran S.A. | 17 | 155 | OV | High |
| Atlas Copco AB | 25 | 101 | FV | Med |
| Mitsubishi Corporation | 18 | 97 | Exp | Good |
| Northrop Grumman Corporation | 23 | 95 | OV | Med |
| Saudi Arabian Mining Company (Ma'aden) | 29 | 74 | OV | High |
| L3Harris Technologies, Inc. | 19 | 65 | OV | Low |
| Fujitsu Limited | 26 | 51 | Exp | Med |
| Franco-Nevada Corporation | 32 | 47 | OV | Good |
| RWE AG | 21 | 43 | OV | High |


