
A Bullish Start to 2026


Issue 47;
- Minor momentum crash kicks off 2026.
- Banks and Mining lead.
- Weakness in Hong Kong.
Global Trends is a deep dive into global equities. The aim of this analysis is to better understand which countries, sectors, industries, and stocks are driving market returns. Not only does it help investors identify opportunities, but it also highlights the risks. We try to condense as much important information as possible, focusing on what really matters each week. Embrace this as a weekly discipline, and you’ll soon have a much better understanding of global financial markets.
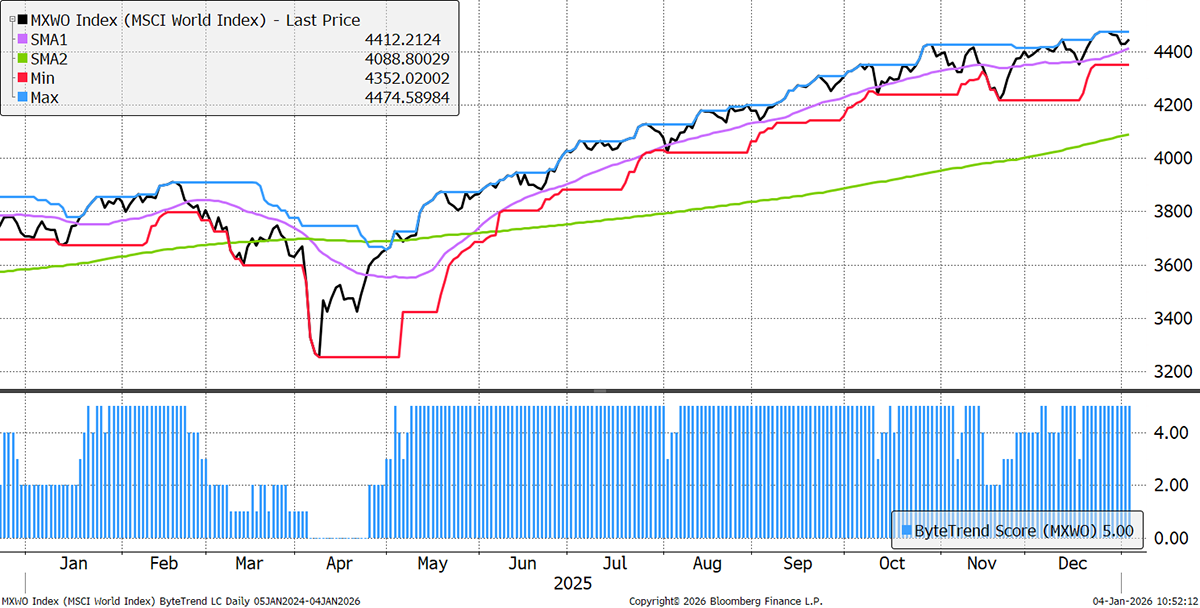
The World Index regains a ByteTrend Score of 5, just shy of a new high.
World Index – Developed Markets – Daily
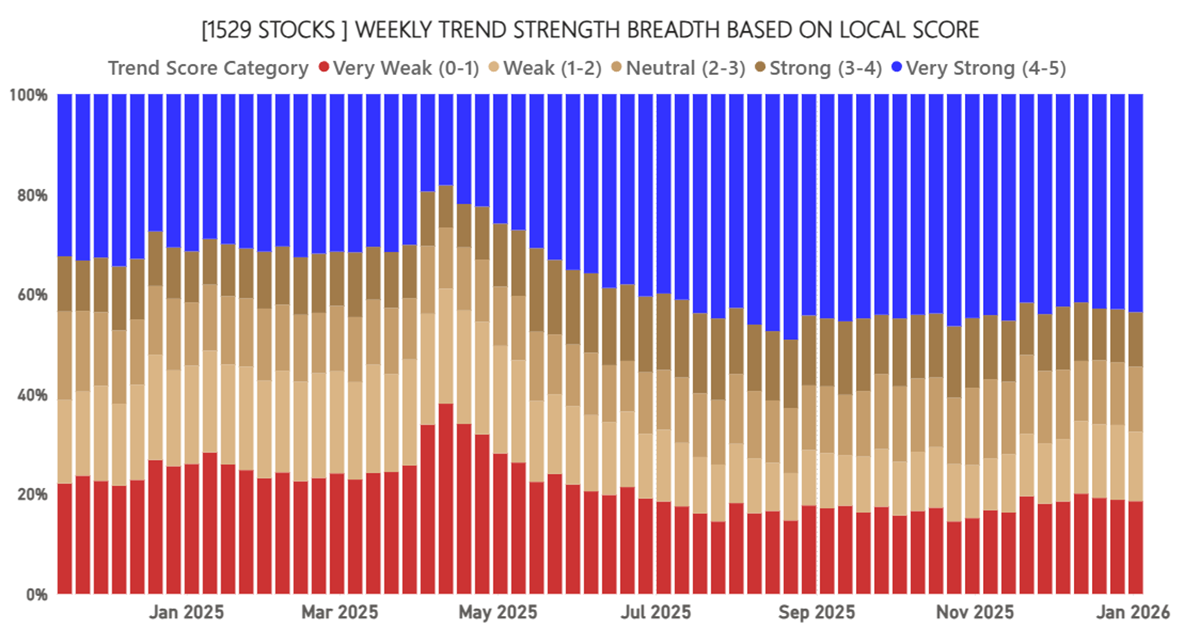
Market Breadth
Market breadth has improved in recent weeks, as blue bullish trends have expanded while red bearish trends have retreated. Across global stockmarkets, 43.6% of stocks are in bullish trends, which is supportive.
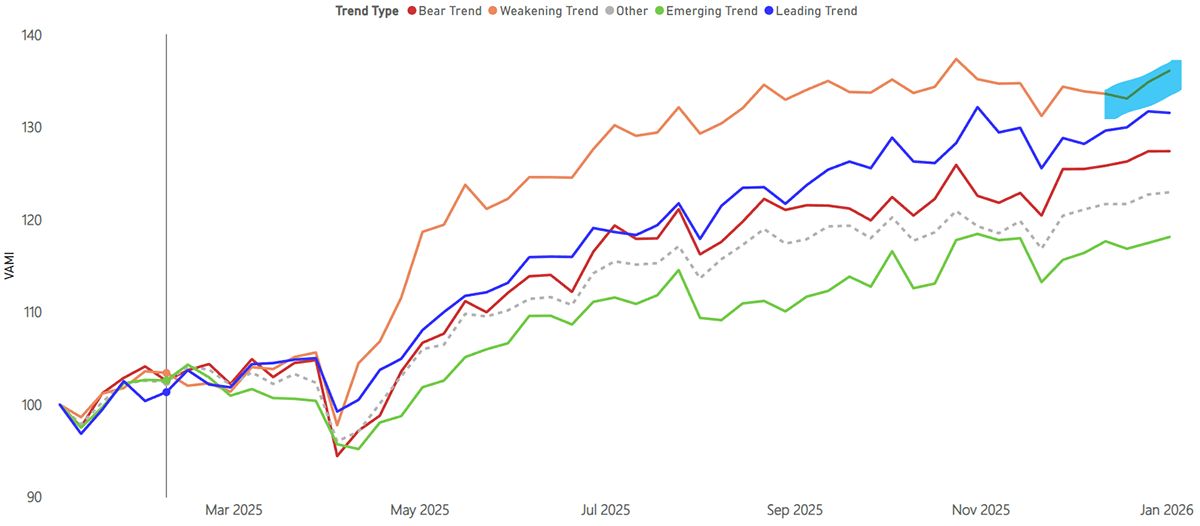
Performance by Trend Type
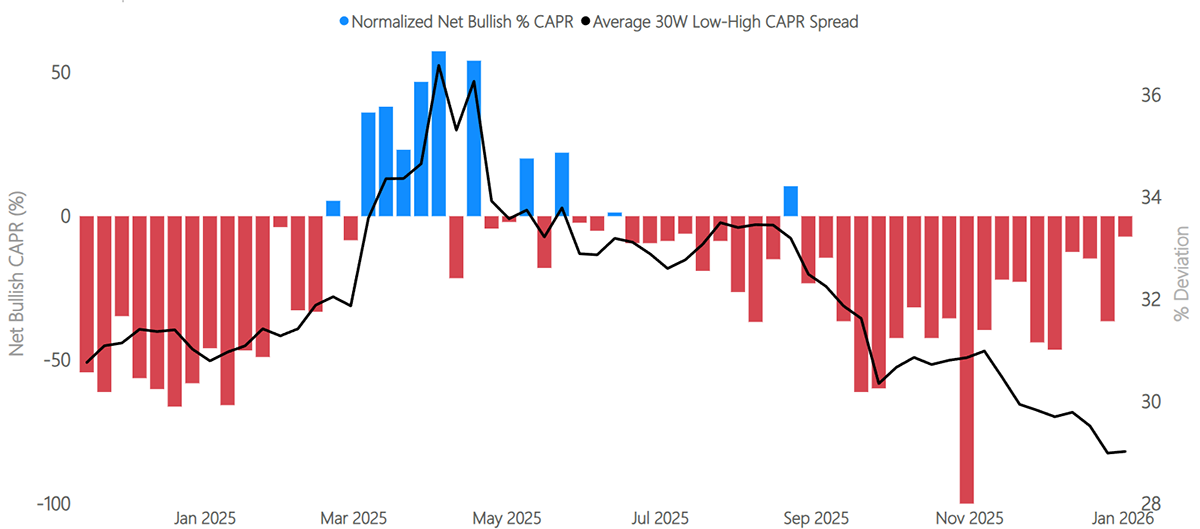
The jump in some of the weakening stocks signals a mini momentum crash since mid-December. The weakening list was strong out of the gates last April following the Tariff Crash, but then slowed down. Momentum crashes are generally bullish for the market; more on that in future issues if this persists.
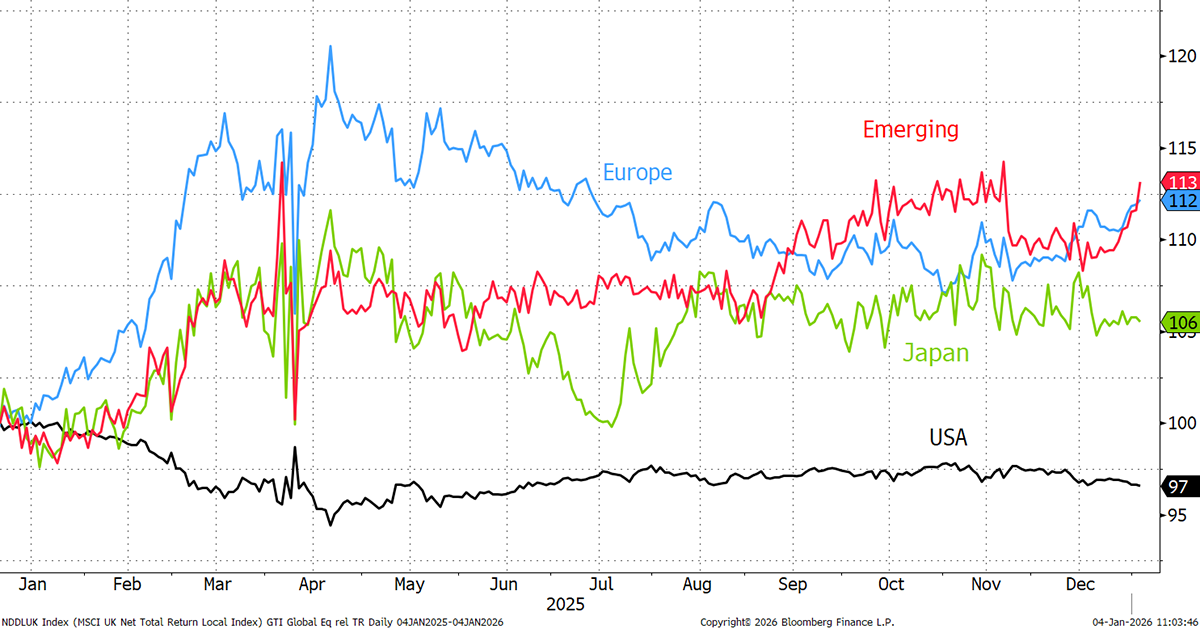
Major Markets
The one-year regional divergence is both striking and widening. There are too many large US stocks that have peaked, and this will feed the rest of the world with alpha, which is a relative concept. We talked about that in our recent video.
Global Rotation
We have been covering this rotation since October. The red bars represent the state of the average stock in CAPR terms (relative to the market). When the bars are heavily red, the average stock is doing badly vs the World Index. The red bars have improved considerably in recent weeks, which means that a significant rotation in market leadership is underway. If they turn blue, that signals that the old winners and losers are more balanced in CAPR terms.
Global Sectors
Most sectors have been stable, with notable strength from financials and materials driven by mining. Technology remains weak, as demonstrated by the lack of technology stocks making CAPR highs in recent weeks.

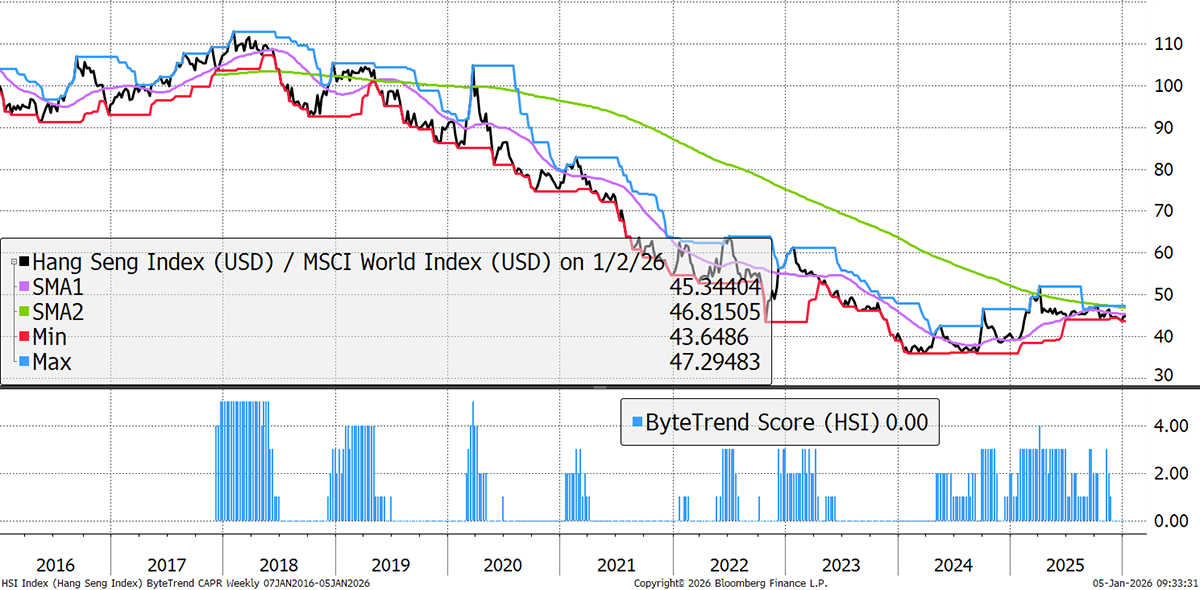
Hong Kong
We pointed this out two weeks ago: Hong Kong, and therefore China, has stalled. The CAPR score is back to 0 following the rebound last year. If it continues, there’ll be trouble in China.
Large-Caps versus Mid-Caps
It has also been notable how the mega-caps are still driving this market. In contrast, mid-caps remain weak. The value gap between large and small is historically high, but the trends don’t favour the switch quite yet.

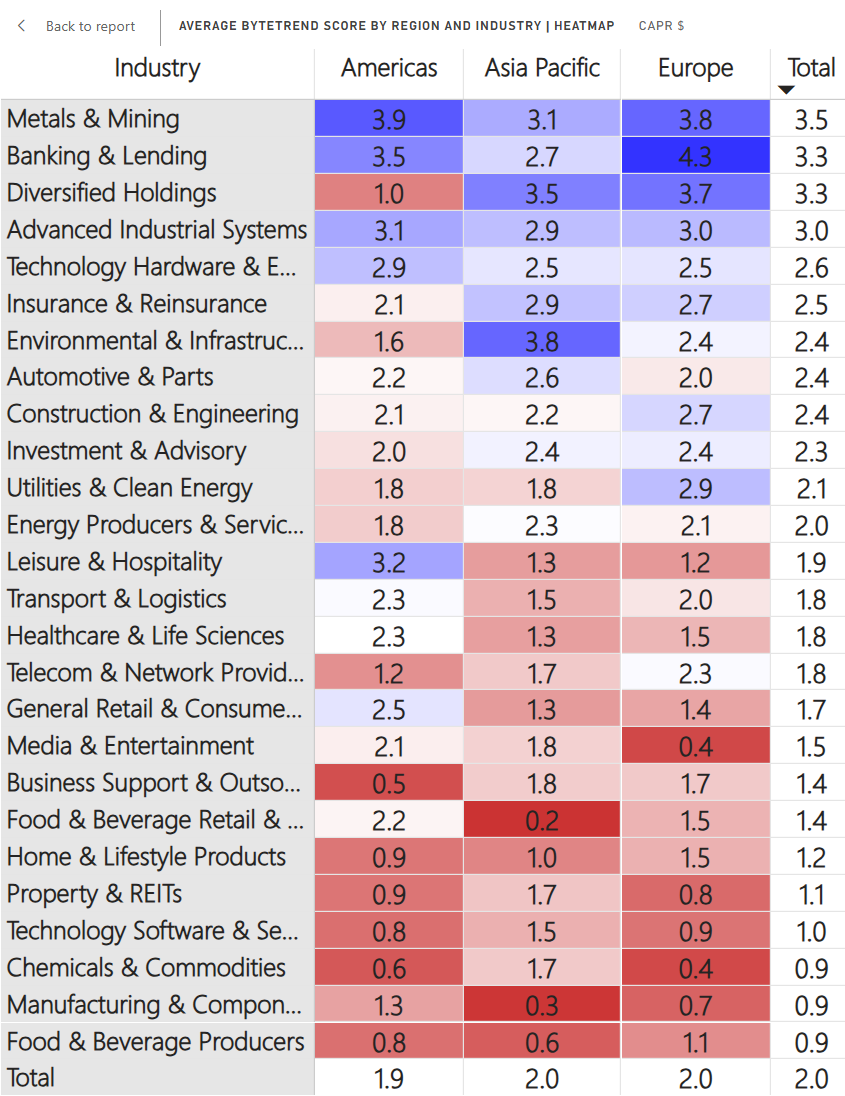
Regions and Industries Average CAPR Score
Financial Services took a breath in the autumn but are back on top, and are especially dominated by banking and lending outside of Asia. The Italian banks are the strongest group within that. The weakness in Hong Kong and Indonesia explains the lag in Asia.
Basic materials have also grown stronger in recent weeks, especially driven by metals and mining. Silver, gold, and lately copper have grabbed the headlines, but aluminium prices are up too. Lithium is also back on the watchlist, with prices rising again after a deep slump. Platinum and palladium have rallied hard alongside silver. Only steel remains weak for now.
Technology Software & Services is a notably weak area, especially in the Americas region, where it scores 0.8 on average (and 1.0 overall). It is stark because tech hardware scores 2.9 in the Americas and 2.6 overall, leaving a huge gap. Software companies were favoured by investors from 2011-2022, but AI has dented investor confidence in their durability. Food and beverage producers/retailers are also very weak, as volume growth has stalled and price increases have come under pressure.
The Value Composite Score (Value) is measured against the company’s own financial history and not in absolute terms. The columns are Cheap (Chp), Value (Val), Fair Value (FV), Overvalued (OV), and Expensive (Exp). The Growth Composite Score (Growth) is measured by sales, earnings cash flow, dividends, and book value on a per share basis. The columns are High, Good, Medium (Med), Low, and Negative (Neg).
Leading Trends with New Highs
These stocks are trading at the 30-week CAPR highs with a ByteTrend Score of 5. All charts shown are CAPR rebased to 100.
| Name | 360-Day Vol | Mkt Cap $Bn | Value | Growth |
| Taiwan Semiconductor | 21 | 1310 | OV | High |
| JPMorgan Chase & Co. | 18 | 886 | OV | Good |
| ASML Holding N.V. | 38 | 452 | OV | Med |
| Micron Technology, Inc. | 57 | 353 | Exp | Low |
| GE Aerospace | 24 | 338 | Exp | High |
| SK hynix Inc. | 54 | 324 | Exp | High |
| Wells Fargo & Company | 27 | 310 | OV | Good |
| Morgan Stanley | 20 | 289 | OV | Good |
| The Goldman Sachs Group, Inc. | 21 | 287 | OV | Good |
| HSBC Holdings plc | 22 | 276 | OV | High |
| Novartis AG | 19 | 266 | FV | Med |
| RTX Corporation | 23 | 251 | OV | Med |
| Royal Bank of Canada | 11 | 240 | OV | Good |
| Lam Research Corporation | 38 | 232 | Exp | Good |
| Applied Materials, Inc. | 38 | 214 | OV | Med |
| Industria de Diseño Textil, S.A. | 30 | 206 | OV | Good |
| Banco Santander, S.A. | 25 | 177 | OV | High |
| KLA Corporation | 34 | 167 | Exp | Good |
| Capital One Financial | 24 | 158 | Exp | Med |
| UBS Group AG | 26 | 149 | OV | Good |
| Iberdrola, S.A. | 13 | 146 | OV | Good |
| Banco Bilbao Vizcaya Argentaria | 26 | 138 | Exp | High |
| Zijin Mining Group Company | 41 | 126 | Exp | High |
| DBS Group Holdings Ltd | 16 | 124 | OV | High |
| Intesa Sanpaolo S.p.A. | 18 | 123 | OV | High |
| Siemens Energy AG | 35 | 123 | Exp | High |
| Southern Copper Corporation | 34 | 122 | OV | Low |
| Parker-Hannifin Corporation | 21 | 114 | Exp | Good |
| Investor AB (publ) | 14 | 108 | OV | Good |
| Barclays PLC | 26 | 89 | OV | Good |
| CaixaBank, S.A. | 18 | 87 | OV | High |
| Howmet Aerospace Inc. | 24 | 85 | Exp | High |
| ING Groep N.V. | 22 | 84 | OV | High |
| Marriott International, Inc. | 27 | 84 | OV | High |
| Lloyds Banking Group plc | 23 | 79 | OV | Good |
| Corning Incorporated | 26 | 78 | Exp | Neg |
| Deutsche Bank AG | 31 | 75 | OV | High |
| ANZ Group Holdings Limited | 17 | 73 | FV | Good |
| Cummins Inc. | 23 | 72 | OV | High |
| NatWest Group plc | 28 | 72 | OV | Good |
| Oversea-Chinese Bank | 15 | 69 | OV | High |
| Nordea Bank Abp | 17 | 66 | FV | High |
| Engie S.A. | 17 | 65 | OV | High |
| Western Digital Corporation | 54 | 65 | Exp | Neg |
| Société Générale S.A. | 27 | 62 | Exp | Good |
| Standard Chartered PLC | 28 | 56 | OV | High |
| CMOC Group Limited | 54 | 56 | OV | High |
| KBC Group N.V. | 19 | 53 | OV | Low |
| Fujitsu Limited | 25 | 49 | Exp | Med |
| Erste Group Bank AG | 24 | 47 | OV | High |
| Great-West Lifeco Inc. | 14 | 45 | OV | Neg |
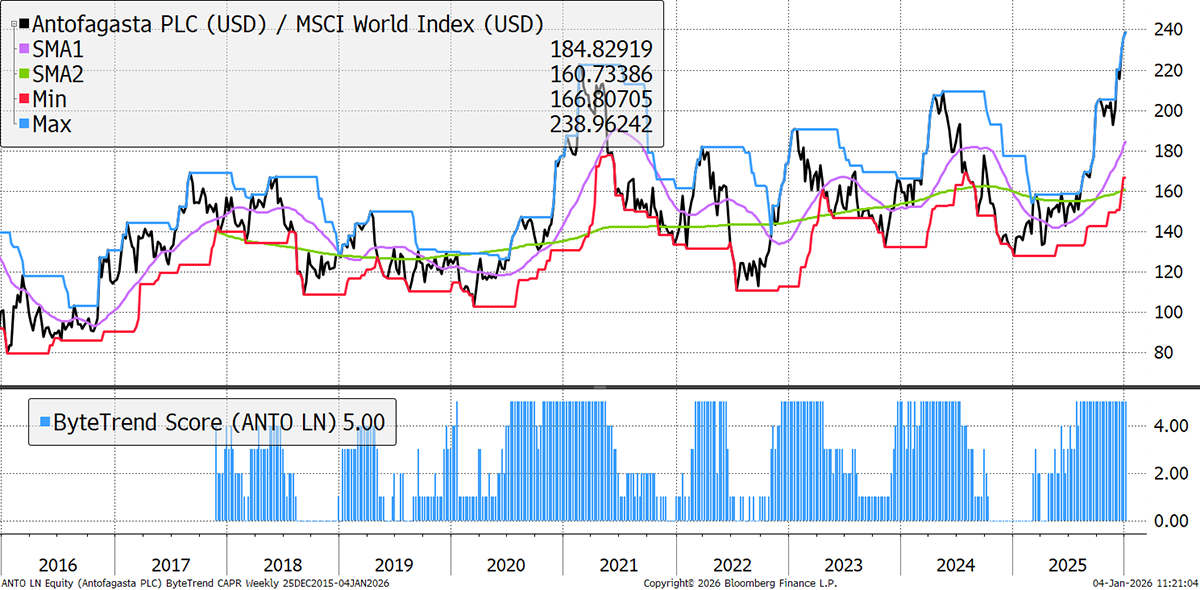
| Antofagasta plc | 36 | 43 | Exp | Neg |
| Skandinaviska Enskilda Banken | 12 | 42 | FV | High |
| Sandvik AB (publ) | 17 | 41 | OV | Med |
| Danske Bank A/S | 17 | 41 | OV | High |
| Swedbank AB (publ) | 14 | 40 | FV | High |
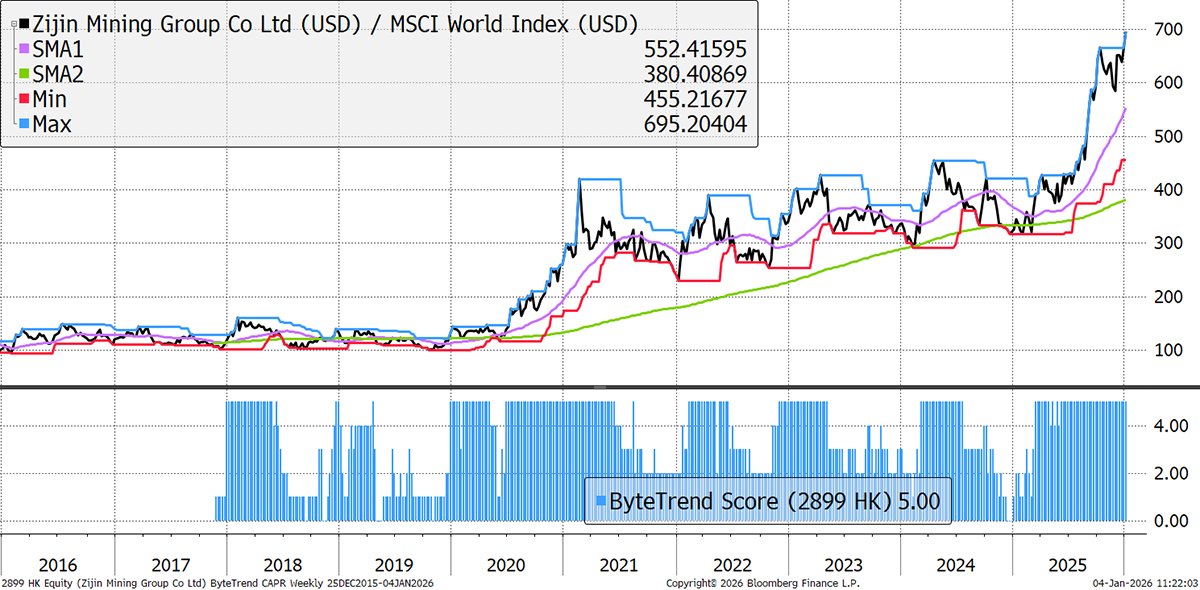
Zijin Mining
2899 HK is on a tear. It has a dual focus: gold and copper. With gold continuing its strong run and copper now starting to join the rally, it is well-positioned. We highlighted it on September 8, and it’s up 44% in the short period since.
Antofagasta
ANTO enjoys higher copper prices. It is also helping drive them higher. In late December, it agreed to a zero-processing-fee arrangement with a Chinese copper concentrate supplier, which reinforced to the market that supply is limited, driven by the more widely reported disruptions and declining ore grades.
New Leading Trends
These stocks are trading at the 30-week CAPR highs with a ByteTrend Score of 5, except they are new trends this week, having previously had a score below 5. All charts shown are CAPR rebased to 100.
| Name | 360-Day Vol | Mkt Cap $Bn | Value | Growth |
| Ulta Beauty, Inc. | 26 | 28 | FV | Good |
| Bank of Baroda Limited | 20 | 18 | OV | High |
| Telia Company AB (publ) | 16 | 17 | OV | Neg |
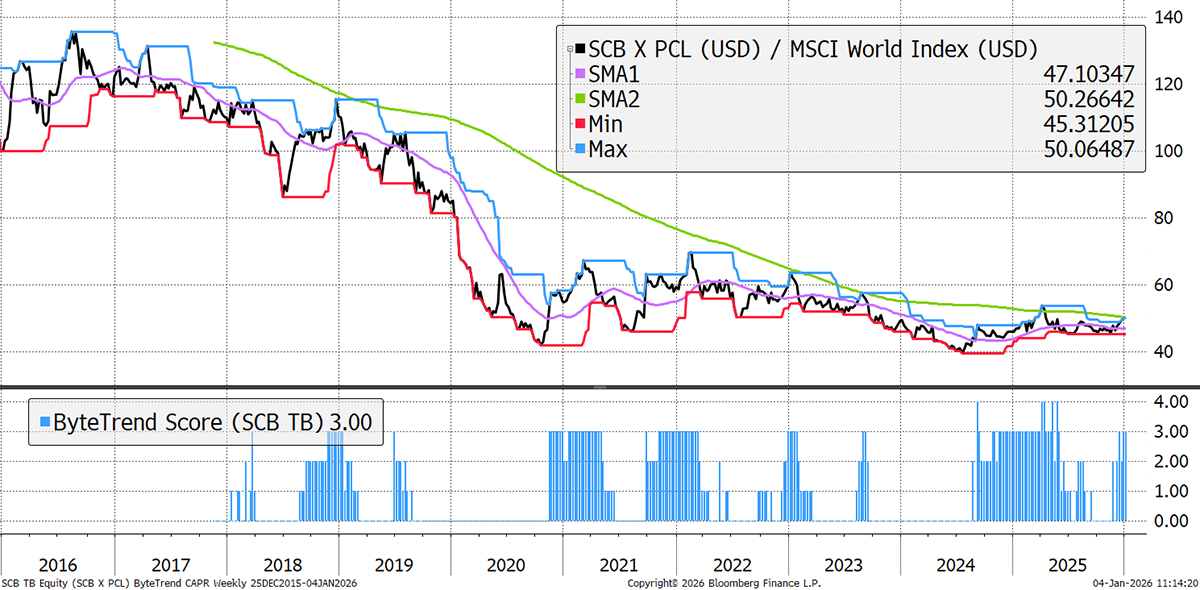
| SCB X Public Company Limited | 11 | 15 | FV | Good |
| Alstom S.A. | 34 | 14 | FV | Med |
| BE Semiconductor Industries N.V. | 41 | 14 | Exp | Neg |
SCB
Thai bank SCB is putting in a decent financial performance lately, helping it nudge higher following a decade of weak domestic growth in Thailand, underperformance relative to its neighbours, and repeated political turbulence. Its price-to-book premium (1.5x-2.5x) has disappeared, and it now trades at book value.
Emerging Trends
These stocks are trading at the 30-week CAPR highs with a ByteTrend Score of less than 5. They don’t have to be in an uptrend, just emerging. All charts shown are CAPR rebased to 100.
| Name | 360-Day Vol | Mkt Cap $Bn | Value | Growth |
| Bank of America Corporation | 20 | 404 | FV | Good |
| Roche Holding AG | 30 | 326 | FV | Neg |
| Ping An Insurance (Group) Company | 24 | 163 | FV | Med |
| The Toronto-Dominion Bank | 10 | 158 | FV | High |
| GSK plc | 24 | 98 | FV | Low |
| The Bank of Nova Scotia | 12 | 90 | FV | Med |
| Sandvik AB (publ) | 17 | 40 | OV | Med |


