
A Two-Horse Race


Issue 43;
- Google and NVIDIA combined have been a stable force.
- Precious metals surge.
- The Global Trends Investor is testing a new format – feedback welcome.
In financial markets, money behaves like water, as it will always find somewhere to go and fill the crack. That describes relative performance - what is working and what is not? The amount of water in the system describes market performance – are stocks rising or falling?
Global Trends is a deep dive into global equities. The aim of this analysis is to better understand which countries, sectors, industries, and stocks are driving market returns. Not only does it help investors identify opportunities, but it also highlights the risks. We try to condense as much important information as possible, focusing on what really matters each week. Embrace this as a weekly discipline, and you’ll soon have a much better understanding of global financial markets.
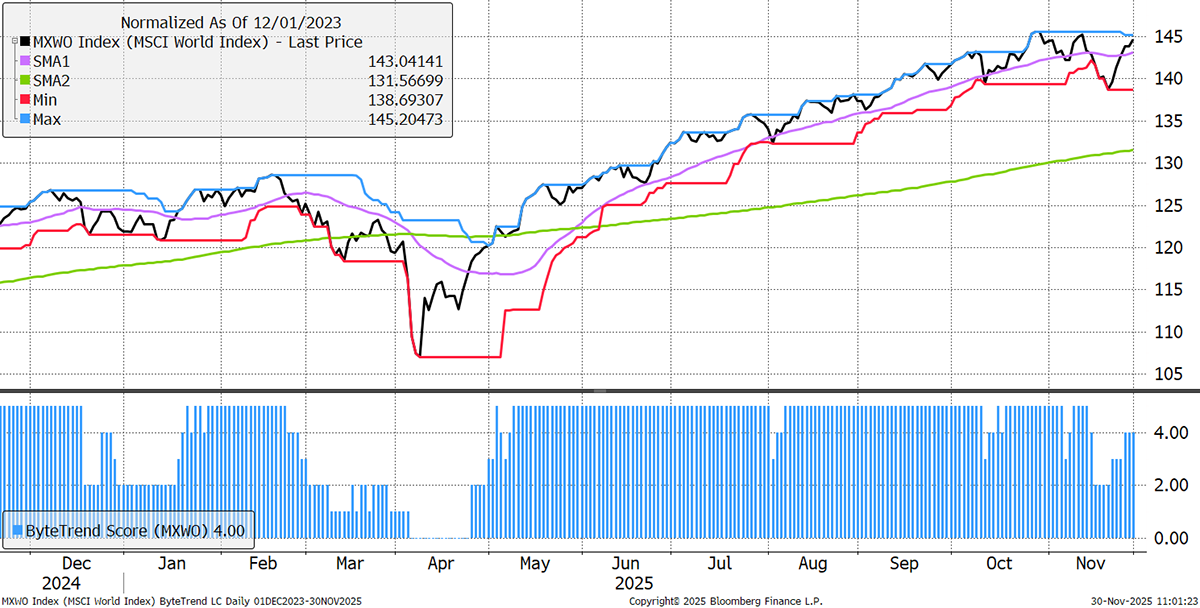
The World Index regains a ByteTrend Score of 4 as it rises up through the 30-day moving average, which is once again upward sloping. It will be a 5 if it makes a 20-day new high by touching the blue line.
World Index – Developed Markets – Daily
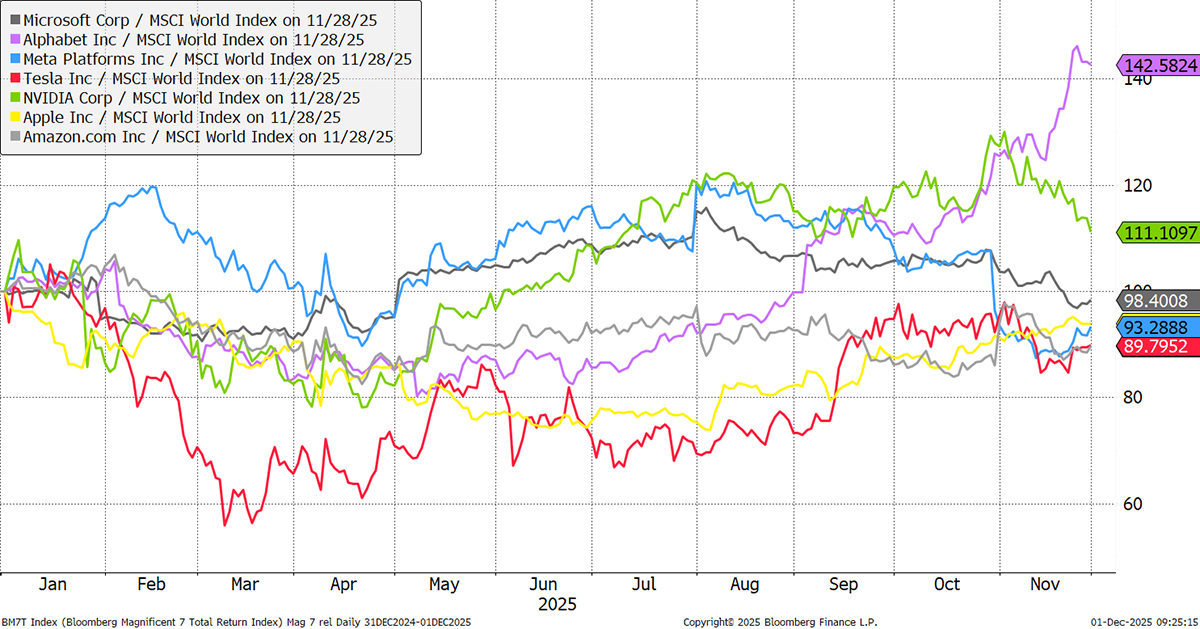
The Magnificent 7 Big Tech Stocks Relative to the World in 2025
The Mag 7 remains highly influential for the index, as they amount to 21.5% of the World Index. Despite that, five of those seven companies have lagged the World Index this year, making it a two-horse race.
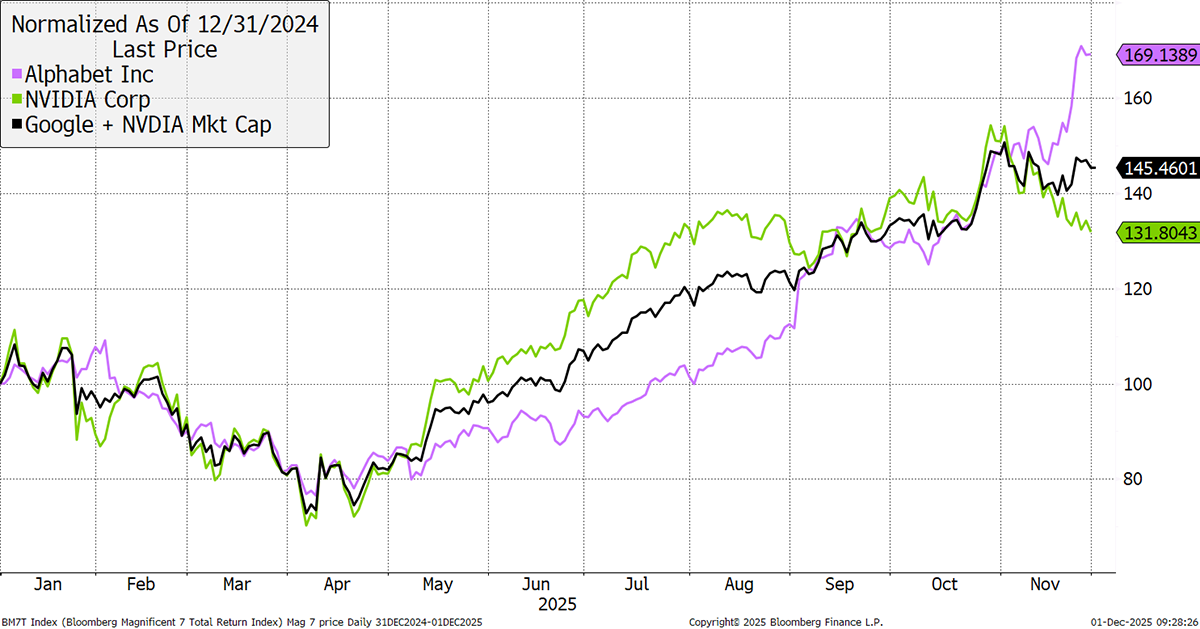
Google plus NVIDIA
Focusing on Google and NVIDIA, the combination has barely budged, as whatever NVDA has lost, Google has gained. This will be a key pair to watch.
Global Winners
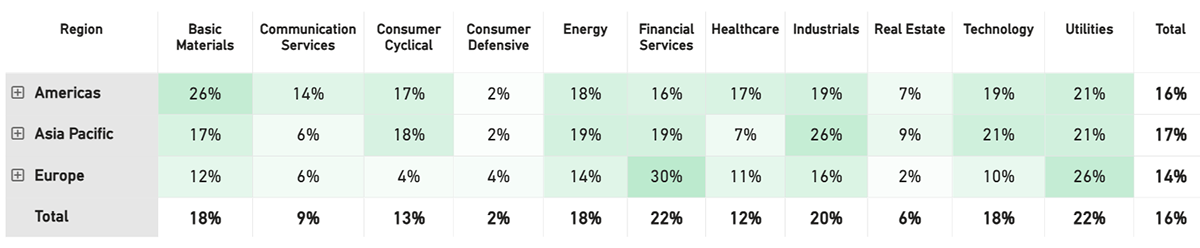
A portfolio of the strongest trends is quite evenly spread geographically. Financials and utilities each account for 22% of global market leadership. That is, 22% of all financial stocks have market-leading trends, as shown in the table below on the row marked “total”.
Notable European financials include BBVA, Barclays, CaixaBank, Lloyds, NatWest, Nordea, Standard Chartered, Erste, and Prudential.
European Financials
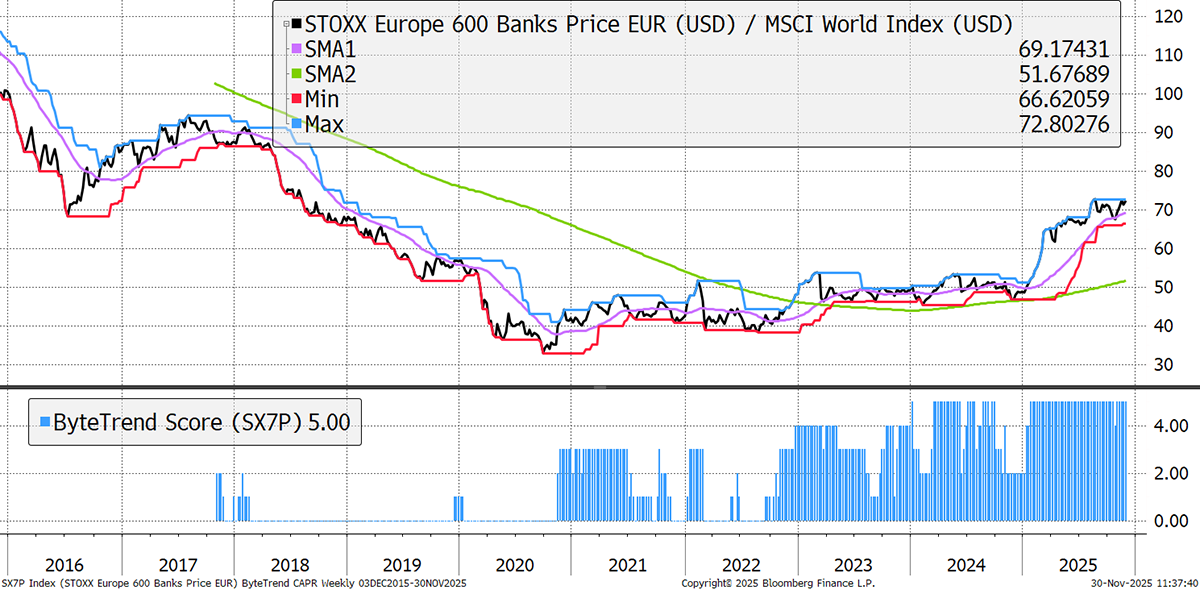
Asian industrials are strong, but only Marubeni made a CAPR high last week. American Materials are also strong with Barrick Gold, Vale, Nucor, Fresnillo, Steel Dynamics, CEMEX, Albemarle, and Alcoa. Finally, European utilities are strong with Iberdrola, Enel, Engie, Endesa, SSE, Snam, and Italgas, but no relative highs.
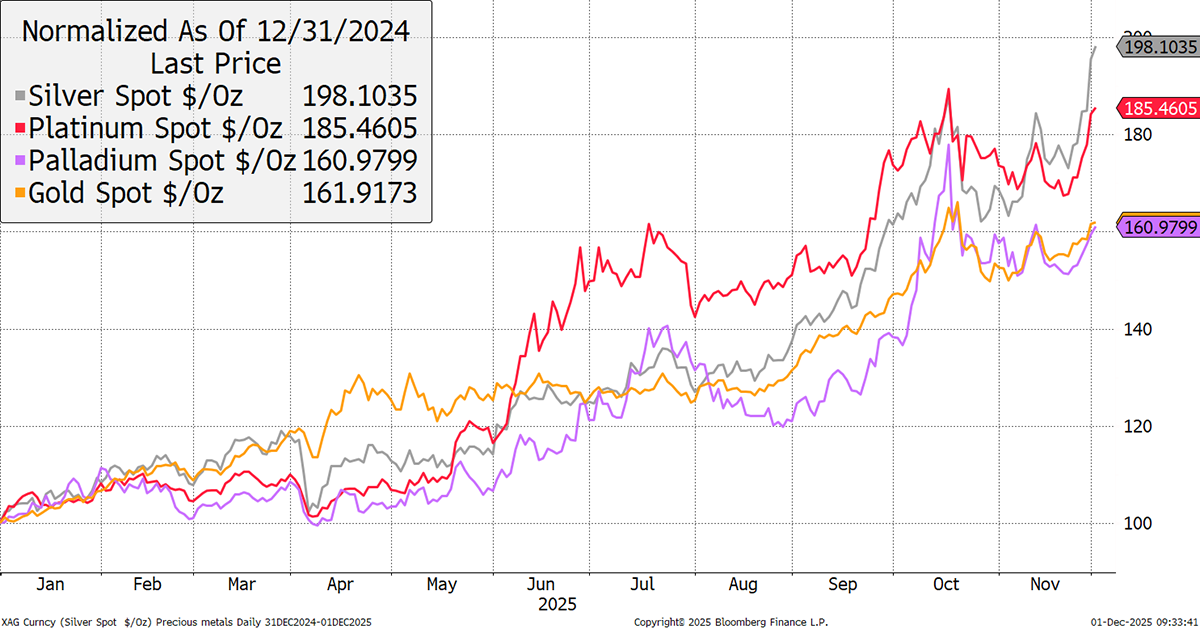
Precious Metals
Silver made an all-time high on Friday, comfortably reaffirming the 2011 and 1980 highs around $50 per ounce. Platinum remains 22% below the last all-time high in 2008, but is making good progress. Palladium is still 50% below its high in 2021. Gold is just 2% below the high made on 16th October.
Global Losers
A portfolio of the weakest relative trends is evenly spread geographically, but Europe fares the worst. Real estate remains weak, but not a single stock made a relative low last week. Defensive stocks also feature in the group, but again, there were no new lows, as the global stock rotation bites.
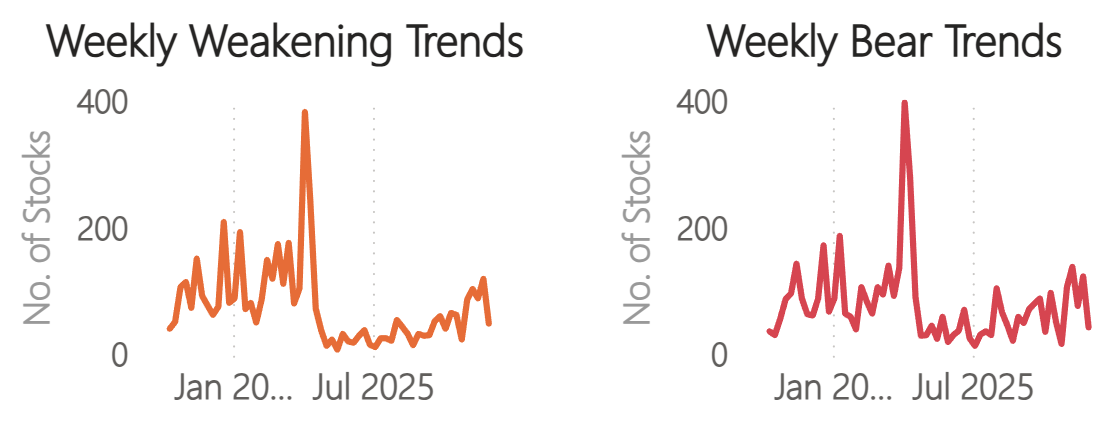
Fewer Bearish Trends
As the market rotation progresses, with past winners cooling and past losers stepping in, there have been fewer bearish price trends.
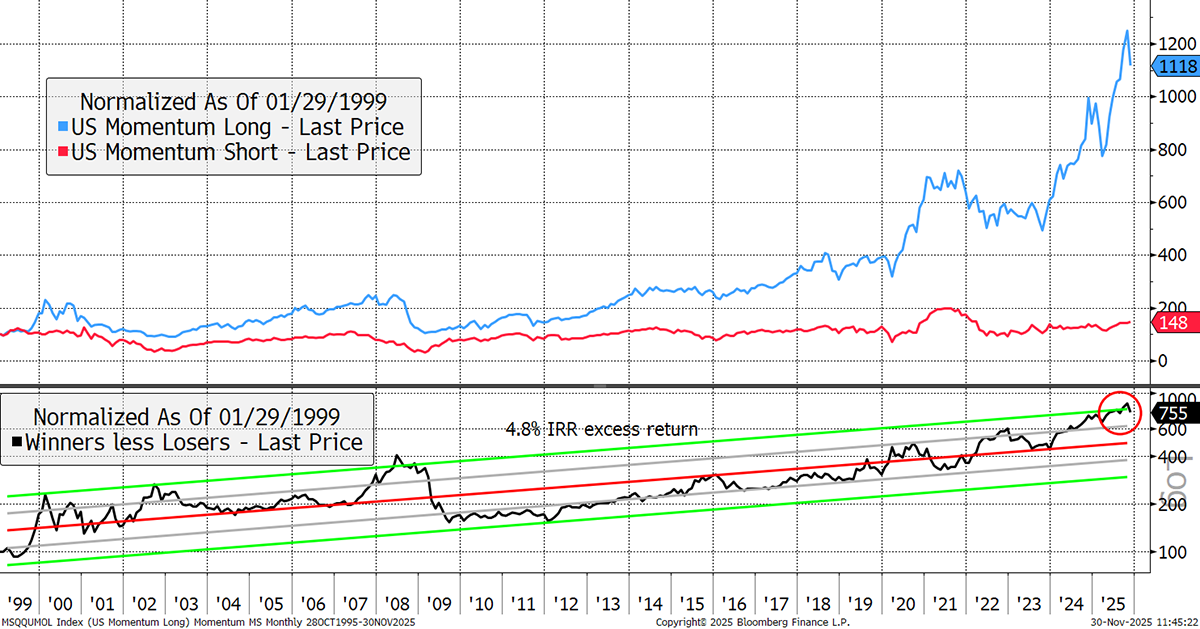
Global Momentum
Digging deeper, the long-term momentum supports this with a weaker show from the winners and a resilient performance from the losers. In historical terms, the spread between winners and losers remains extreme. Sooner or later, this will revert to the mean, as it always does. Time for a more resilient investment approach.
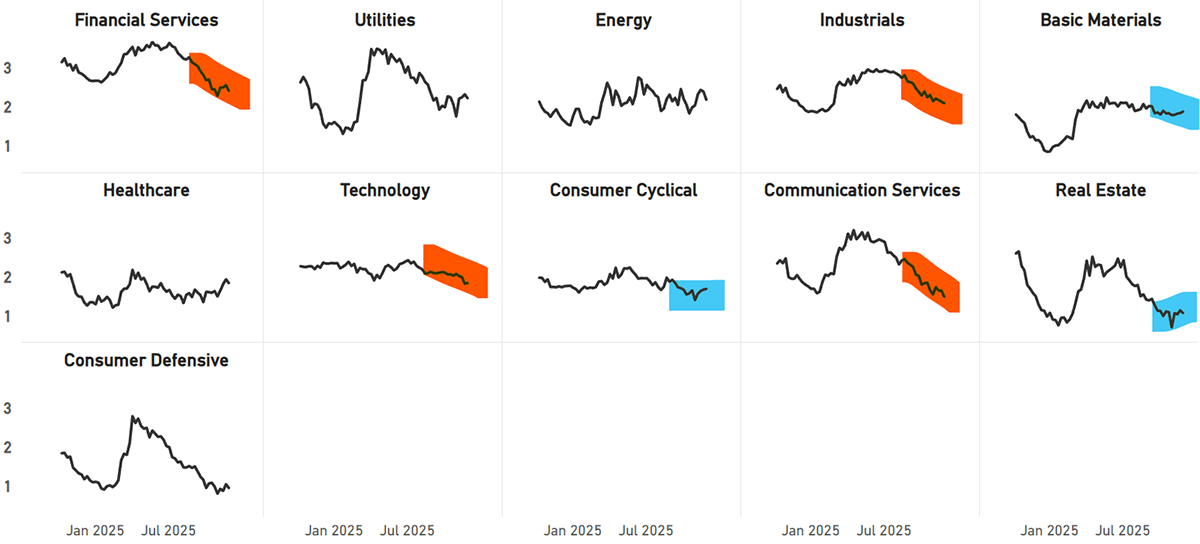
At the sector level, basic materials, consumer cyclical, and real estate have improved, while financials, industrial, technology, and communications have weakened.
CAPR: Global Sectors
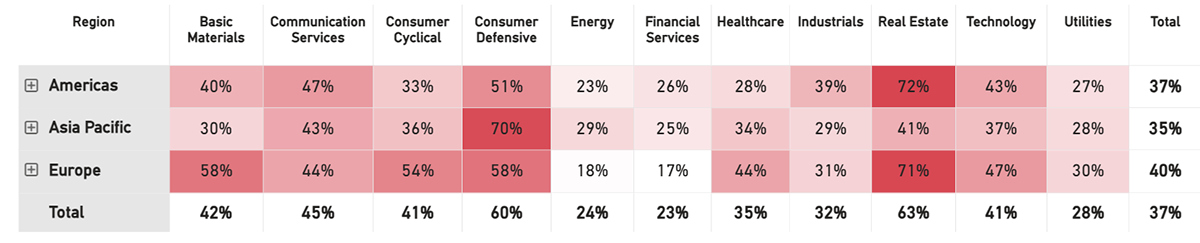
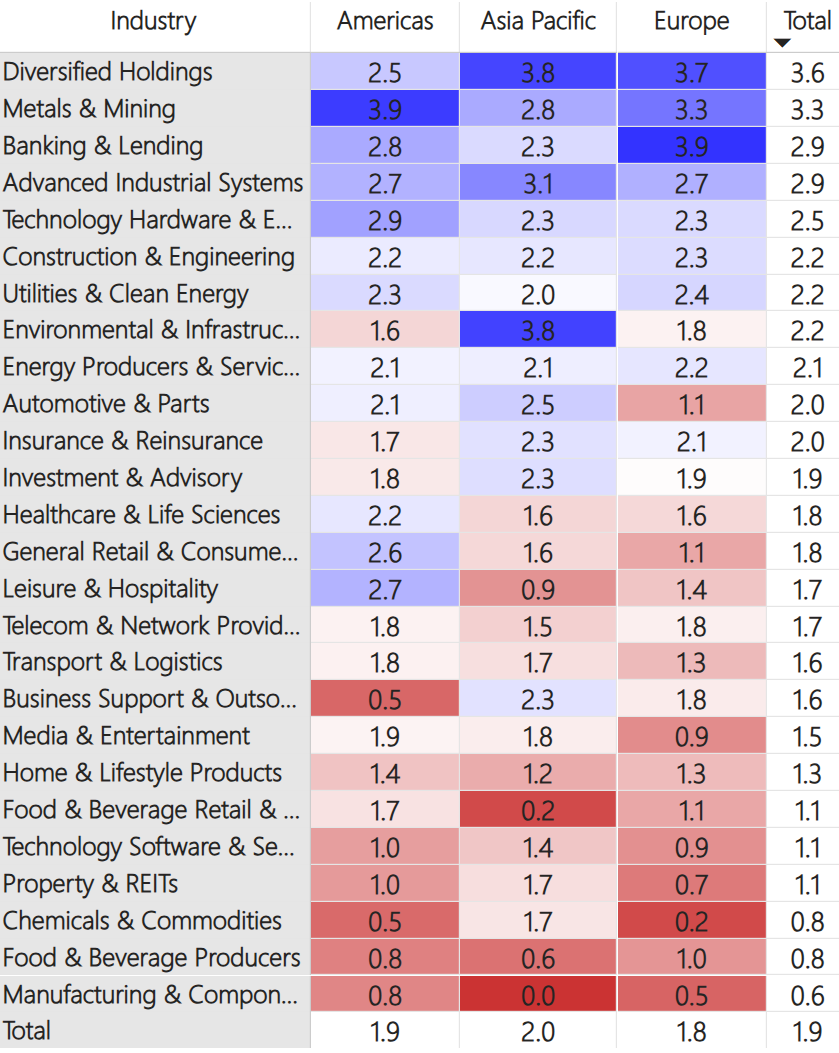
Average ByteTrend Score by Region and Sector Heatmap - CAPR
The world matrix shows European banking better, along with metals and mining. Media and entertainment are notably weaker, along with support services.
We have redesigned the tables. Please note that the Value Composition Score is measured against the company’s own financial history and not in absolute terms. The abbreviations used for the Value Composition Score are Cheap (Chp), Value (Val), Fair Value (FV), Overvalued (OV), and Expensive (Exp). Feedback welcome.
Leading Trends with New Highs
These stocks are trading at the 30-week CAPR highs with a ByteTrend Score of 5. All charts shown are CAPR rebased to 100.
| Name | Mkt Cap Bn USD | 360-Day Vol | Value Composite Score |
| Alphabet Inc. | 3864 | 31 | OV |
| Morgan Stanley | 270 | 23 | OV |
| The Goldman Sachs Group, Inc. | 259 | 24 | OV |
| Royal Bank of Canada | 218 | 12 | FV |
| Applied Materials, Inc. | 201 | 38 | OV |
| Analog Devices, Inc. | 131 | 34 | OV |
| Banco Bilbao Vizcaya Argentaria, S.A. | 124 | 27 | Exp |
| HCA Healthcare, Inc. | 123 | 27 | OV |
| Sumitomo Mitsui Financial Group, Inc. | 116 | 26 | OV |
| Nu Holdings Ltd. | 84 | 31 | FV |
| Itaú Unibanco Holding S.A. | 83 | 20 | FV |
| Barclays PLC | 79 | 26 | OV |
| CaixaBank, S.A. | 78 | 18 | OV |
| The Bank of New York Mellon Corporation | 78 | 18 | FV |
| Lloyds Banking Group plc | 75 | 23 | OV |
| Monster Beverage Corporation | 73 | 22 | FV |
| Barrick Gold Corporation | 72 | 38 | OV |
| General Motors Company | 69 | 33 | FV |
| NatWest Group plc | 68 | 27 | OV |
| Nordea Bank Abp | 61 | 17 | FV |
| IDEXX Laboratories, Inc. | 60 | 40 | FV |
| Standard Chartered PLC | 50 | 28 | FV |
| National Bank of Canada | 47 | 13 | FV |
| Ferrovial SE | 47 | 18 | OV |
| Galderma Group N | 47 | 27 | OV |
| Las Vegas Sands Corp. | 46 | 38 | Exp |
| Rockwell Automation, Inc. | 44 | 27 | OV |
| Marubeni Corporation | 43 | 24 | Exp |
| AngloGold Ashanti Plc | 43 | 49 | Exp |
| Erste Group Bank AG | 42 | 33 | OV |
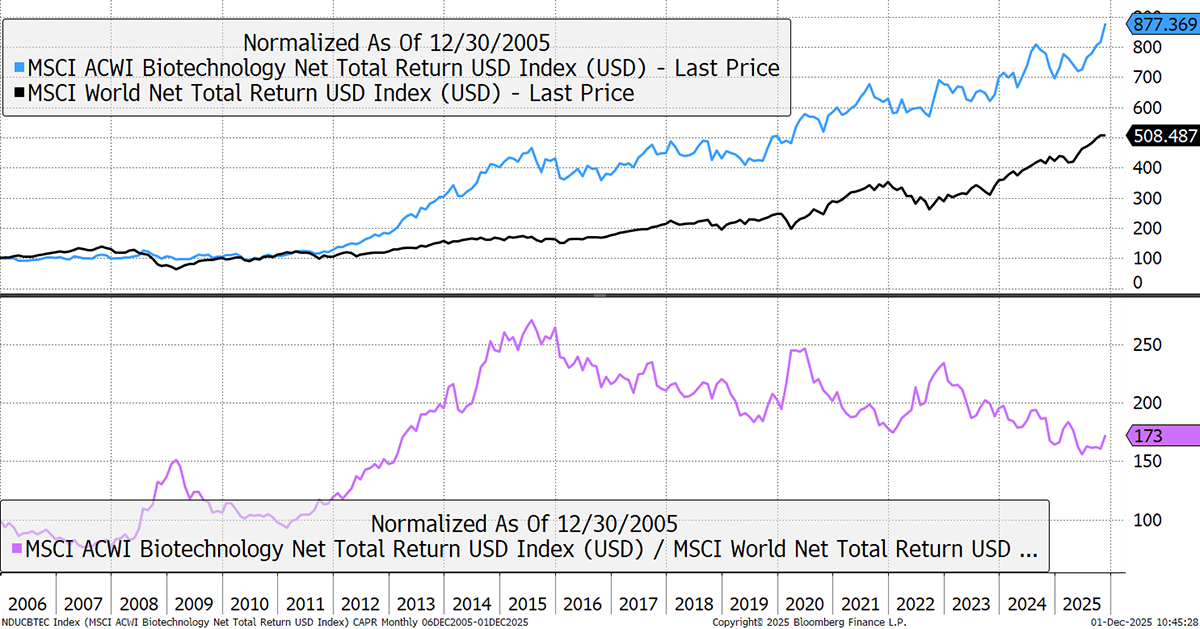
Biotechnology versus the World
Biotech is the new theme that Global Trends has been highlighting for several weeks. It has been underperforming the World Index for a decade, and that fast money chasing growth has found a new home.
Emerging Trends
These stocks are trading at the 30-week CAPR highs with a ByteTrend Score of less than 5. They don’t have to be in an uptrend, just emerging. All charts shown are CAPR rebased to 100.
| Name | Mkt Cap Bn USD | 360-Day Vol | Value Composite Score |
| Warner Bros. Discovery, Inc. | 59 | 83 | Exp |
| Intel Corporation | 178 | 61 | FV |
| Merck & Co., Inc. | 263 | 33 | FV |
| NextEra Energy, Inc. | 178 | 28 | FV |
| Medtronic plc | 135 | 21 | FV |
| Vale S.A. | 54 | 19 | FV |
| Regeneron Pharmaceuticals, Inc. | 81 | 46 | FV |
| The Bank of Nova Scotia | 86 | 12 | FV |
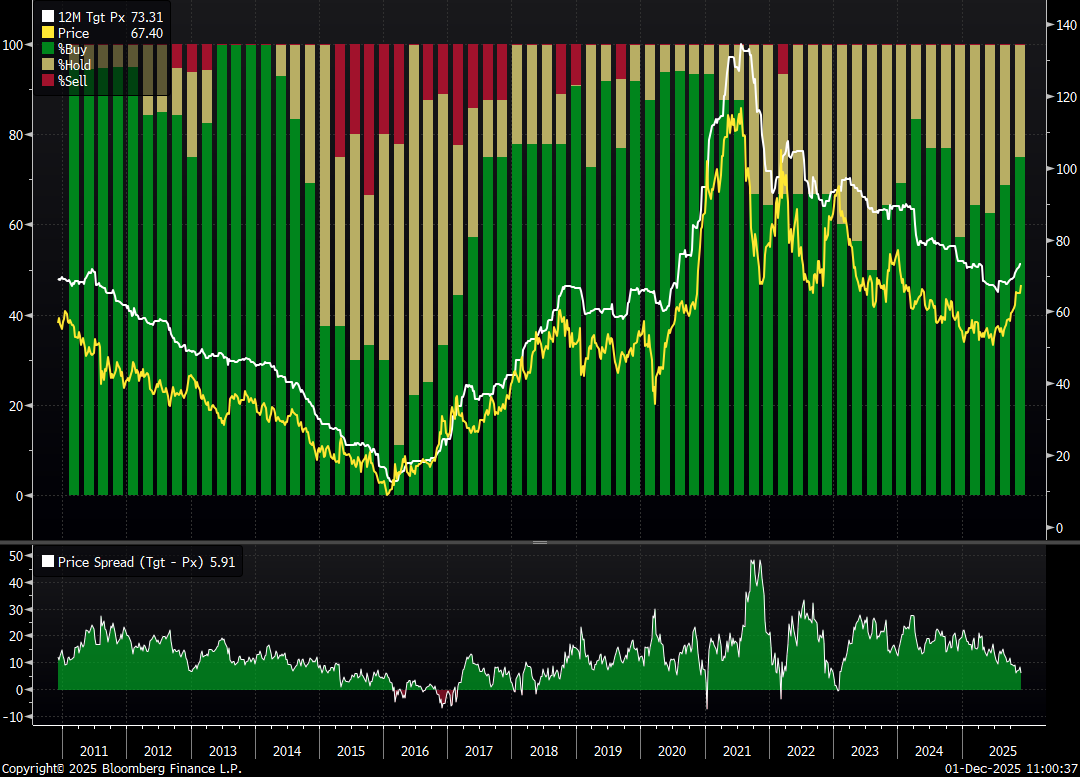
Vale Analysts’ Forecast
Vale, a Brazilian miner, was highlighted in ByteTree Venture in October. Although its business is in base metals rather than precious metals, it has turned the corner, and the analysts are on board. Earnings upgrades are improving, and more analysts have turned buy.
Weakening
These stocks are trading at the 30-week CAPR lows with a ByteTrend Score above 0. They are weakening trends but not yet downtrends. All charts shown are CAPR rebased to 100.
| Name | Mkt Cap Bn USD | 360-Day Vol | Value Composite Score |
| Visa Inc. | 649 | 18 | FV |
| Mastercard Incorporated | 494 | 19 | FV |
| Netflix, Inc. | 456 | 27 | FV |
| Costco Wholesale Corporation | 405 | 13 | OV |
| SAP SE | 282 | 20 | OV |
| T-Mobile US, Inc. | 234 | 24 | FV |
| Commonwealth Bank of Australia | 167 | 22 | OV |
| Booking Holdings Inc. | 158 | 22 | FV |
| Spotify Technology S.A. | 123 | 35 | FV |
| L'Air Liquide S.A. | 110 | 12 | FV |
| Al Rajhi Banking and Investment Corporation | 102 | 20 | FV |
| The Southern Company | 100 | 12 | FV |
| Cadence Design Systems, Inc. | 85 | 31 | OV |
| Rheinmetall AG | 78 | 35 | Exp |
| Ferrari N.V. | 70 | 39 | FV |
| Tokio Marine Holdings, Inc. | 67 | 23 | OV |
| BAE Systems plc | 64 | 27 | OV |
| Arthur J. Gallagher & Co. | 64 | 26 | OV |
| Motorola Solutions, Inc. | 62 | 18 | FV |
| ITC Limited | 57 | 13 | FV |
| Thales S.A. | 54 | 28 | OV |
| Compass Group PLC | 53 | 16 | FV |
| Swiss Re AG | 52 | 18 | OV |
| Constellation Software Inc. | 51 | 33 | FV |
| MicroStrategy Incorporated | 51 | 52 | Exp |
| Fastenal Company | 46 | 24 | OV |
| Cheniere Energy, Inc. | 46 | 22 | FV |
| United Overseas Bank Limited | 44 | 11 | FV |
| Axon Enterprise, Inc. | 43 | 47 | Exp |
| E.on Se | 47 | 14 | FV |
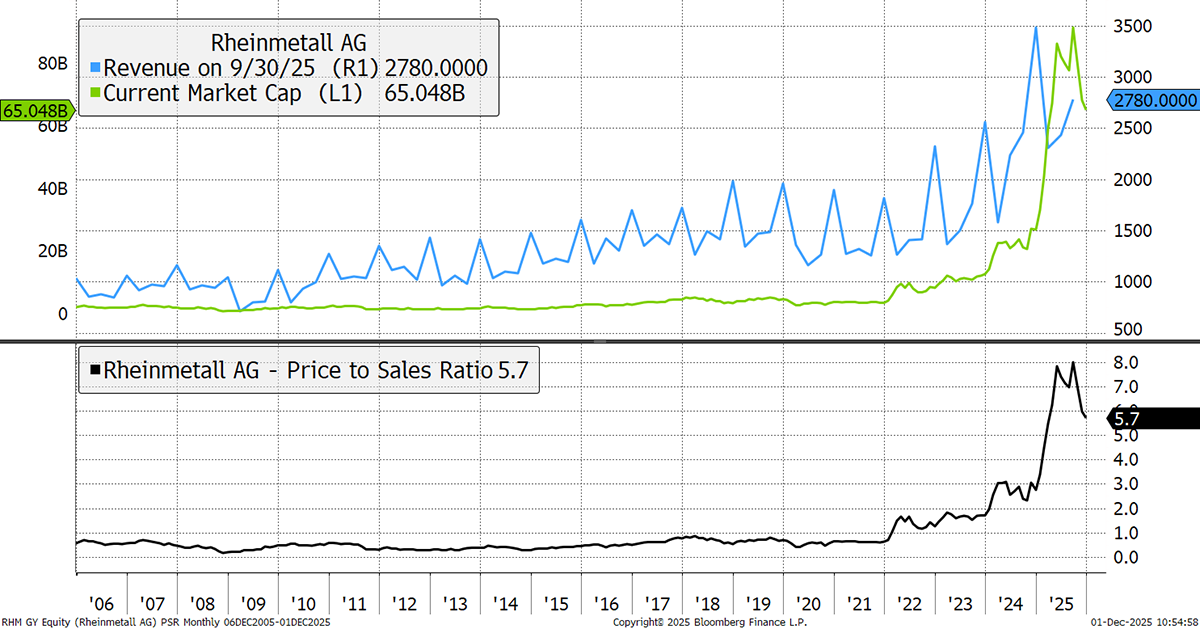
Rheinmetall
Defence stocks soared after the invasion of Ukraine. Rheinmetall traded at an average price-to-sales ratio of 0.5x before 2022. It peaked at 8x and is now 5.7x. Fair value will eventually be discovered. Peace hurts.
Bear Trends
These stocks are trading at the 30-week CAPR lows with a ByteTrend Score of 0. They are in a downtrend. All charts shown are CAPR rebased to 100.
| Name | Mkt Cap Bn USD | 360-Day Vol | Value Composite Score |
| The Home Depot, Inc. | 355 | 23 | FV |
| The Procter & Gamble Company | 346 | 15 | FV |
| Chevron Corporation | 303 | 20 | FV |
| Salesforce, Inc. | 221 | 28 | Chp |
| Linde plc | 192 | 14 | FV |
| The Walt Disney Company | 188 | 27 | Val |
| Intuit Inc. | 177 | 27 | Val |
| ServiceNow, Inc. | 169 | 26 | Val |
| The Charles Schwab Corporation | 169 | 15 | FV |
| BlackRock, Inc. | 162 | 21 | FV |
| Adobe Inc. | 134 | 25 | Val |
| Deere & Company | 126 | 21 | OV |
| Honeywell International Inc. | 122 | 22 | FV |
| Automatic Data Processing, Inc. | 103 | 16 | FV |
| Comcast Corporation | 97 | 18 | Chp |
| Keyence Corporation | 83 | 20 | FV |
| Mondelez International, Inc. | 74 | 20 | FV |
| RELX Plc | 73 | 17 | OV |
| Airbnb, Inc. | 72 | 32 | Val |
| Hong Kong Exchanges and Clearing Limited | 67 | 23 | FV |
| Hindustan Unilever Limited | 65 | 19 | FV |
| Deutsche Post AG | 62 | 0 | FV |
| Thomson Reuters Corporation | 61 | 28 | FV |
| Canadian National Railway Company | 60 | 18 | FV |
| Deutsche Post AG | 59 | 0 | FV |
| PayPal Holdings, Inc. | 59 | 31 | Chp |
| Equinor ASA | 58 | 28 | FV |
| Workday, Inc. | 58 | 33 | Chp |
| Siemens Healthineers AG | 56 | 24 | Val |
| Diageo plc | 51 | 29 | Val |
| Samsung Biologics Co.,Ltd. | 51 | 29 | Chp |
| MetLife, Inc. | 50 | 21 | FV |
| NXP Semiconductors N.V. | 49 | 36 | FV |
| Adyen N.V. | 49 | 35 | Val |
| Roper Technologies, Inc. | 48 | 16 | Val |
| Macquarie Group Limited | 48 | 21 | FV |
| Universal Music Group N.V. | 47 | 26 | Val |
| Qatar National Bank (Q.P.S.C.) | 46 | 17 | Val |
| Kuwait Finance House K.S.C.P. | 45 | 12 | FV |
| Saudi Basic Industries Corporation | 44 | 23 | FV |
| Equinix, Inc. | 73 | 22 | FV |
| Public Storage | 48 | 19 | FV |
| Digital Realty Trust, Inc. | 55 | 21 | FV |
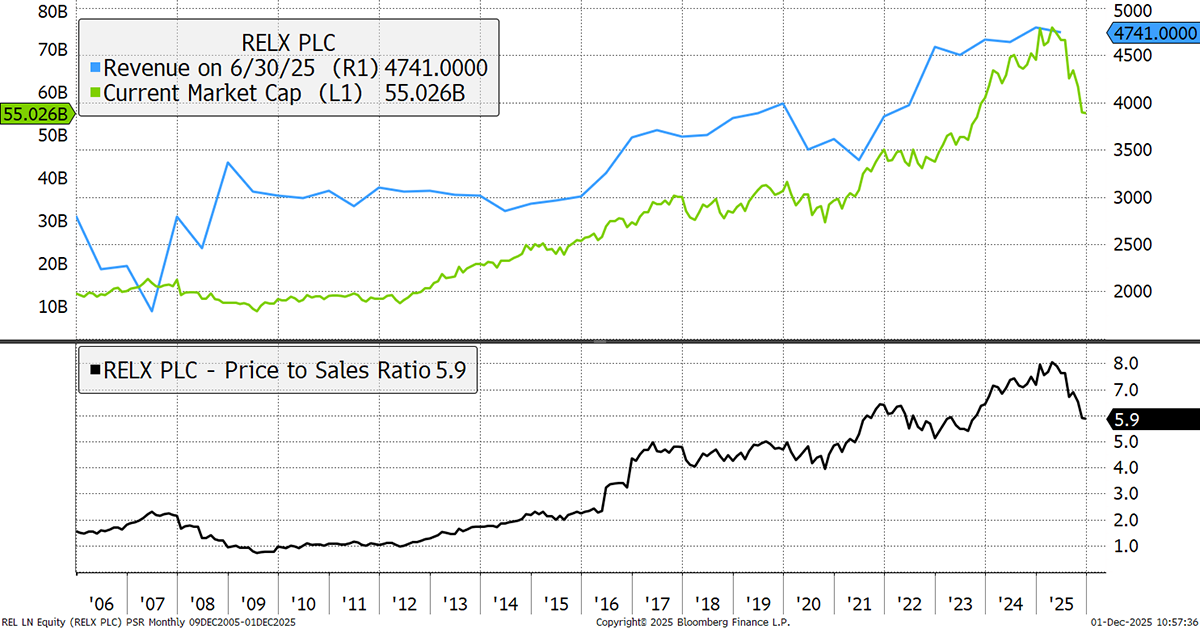
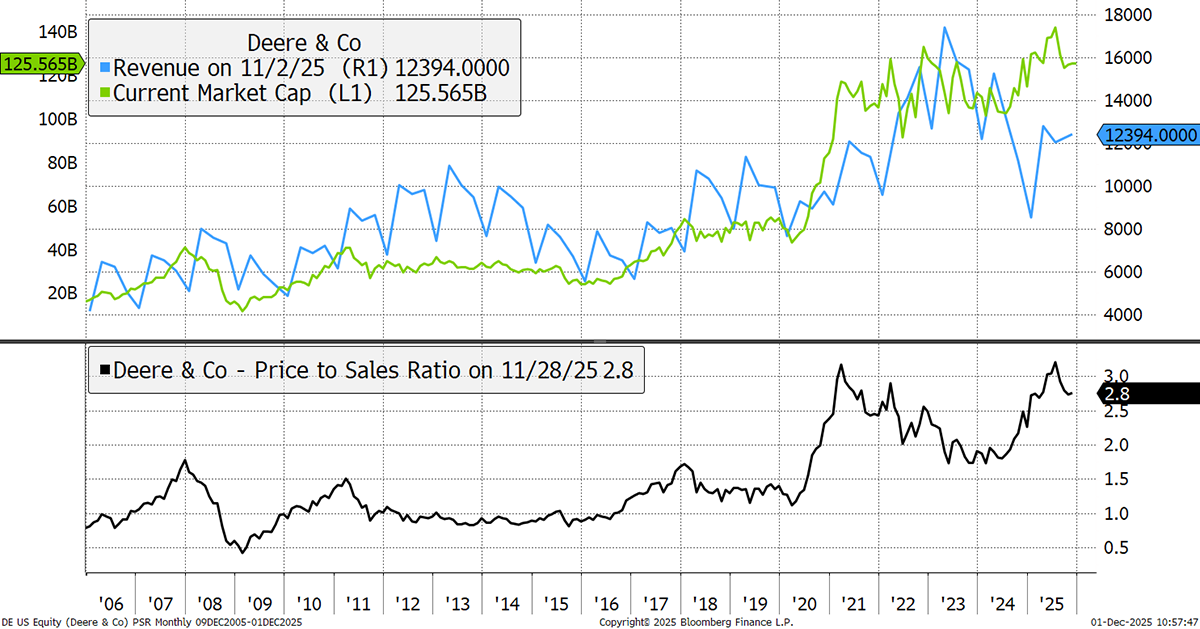
For the Bear Trends, we highlight RELX and Deere, both of which are superb operators. The market also recognised this, bidding up their valuations to record levels in 2025. However, it went too far, and now that the rotation is underway, they are giving back their premium. Some quality stocks are already cheap, but these two are examples of those that remain expensive. When they become cheap again and momentum returns, ByteTree Quality will be ready.
RELX
Data and analytics company RELX is a favoured stock of Quality manager Lindsell Train due to its dominance across multiple niches, steady growth, loyal customers, and high profitability. Until recently, it was doing well for them, but with a negligible free cash flow yield, the price is still too high, and a correction is underway.
Deere
Deere & Co. took full part in the 2021 speculative bubble, and in 2025, it did so again. It sells farming equipment but is now viewed as a tech company because its vehicles are so advanced. Its brand strength is extreme, and its service network is the best. Still, a 2.5% free cash flow yield and 27x 2026 PE is rich for a company with modest growth.
GTI 200 Spreadsheet
We are pleased to share the GTI 200 spreadsheet. Download the spreadsheet below to view the CAPR and local currency scores, and more, for the world’s largest 200 stocks. Have a look at the different groups and the main list “All stocks”. The Insights tab is interesting, and don’t forget to expand the columns by clicking on the “+” at the top of the page if you want to see more trend data.
Outlook
The rotation continues, and the good news is that investors can embrace this historical rotation rather than sit on their hands, hoping that big tech trades ever higher. Precious metals are back, along with biotech, auto parts, and more.
The Global Trends Investor is testing a new approach, with a smaller focus on price charts. Your feedback is most welcome. Email us at gti@bytetree.com.
Thanks for reading GTI.


