
Active Management Takes Off


Issue 17;
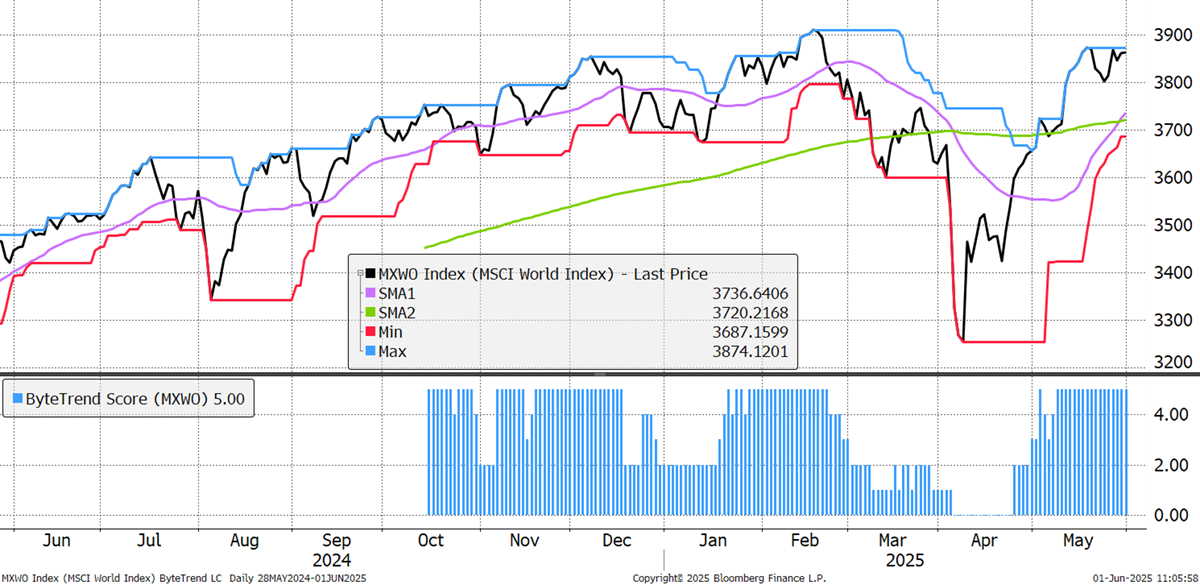
The World Index has a ByteTrend Score of 5. Although it hasn’t made an all-time high, it appears to be in good shape.
World Index – Developed Markets - Daily
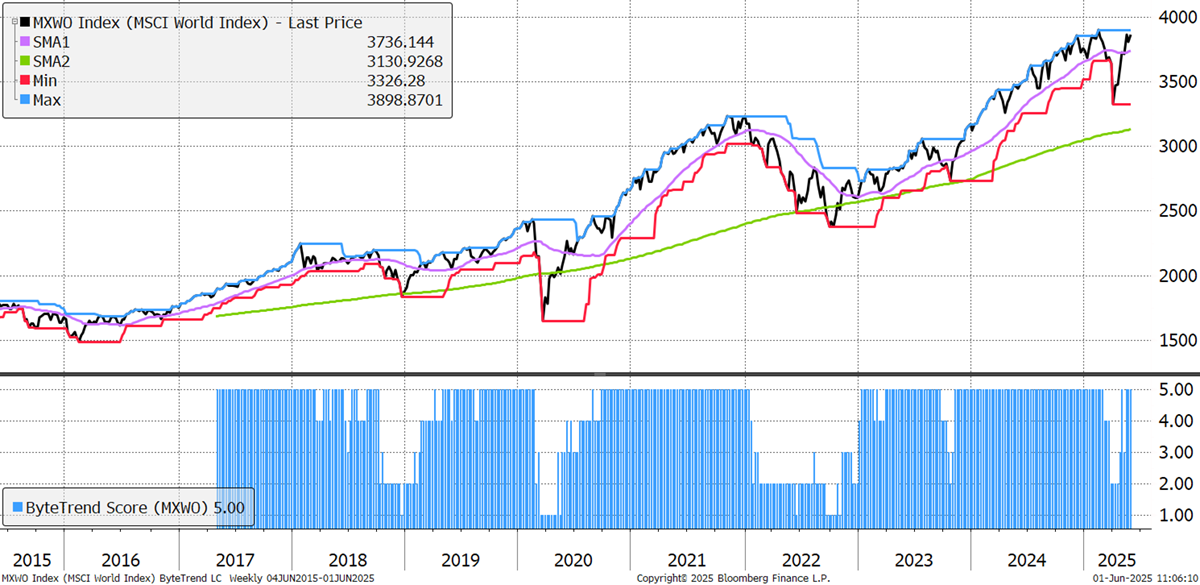
It’s the same picture on the weekly chart. The market has fully recovered since the Trump Bump in April. That said, the leadership has shifted, as always happens after market corrections.
World Index – Developed Markets - Weekly
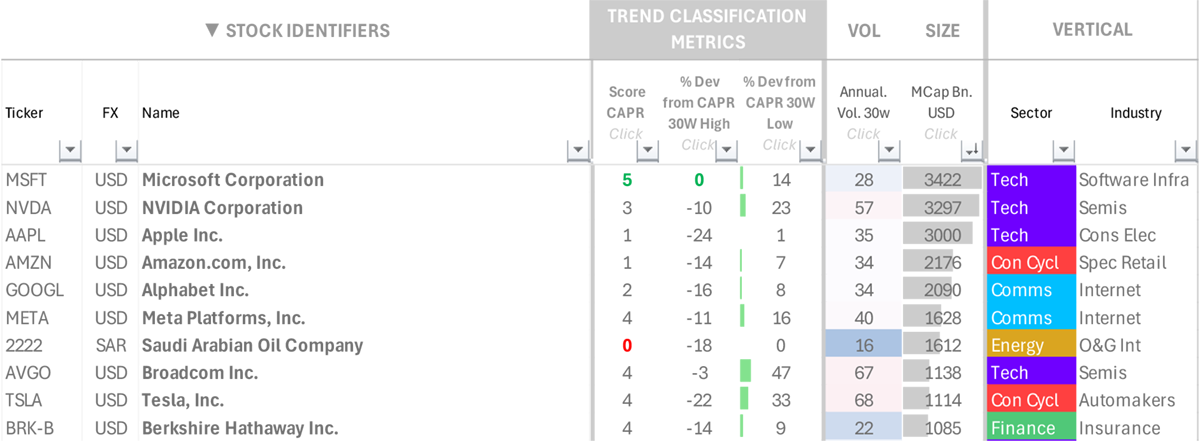
Earlier this year, the world’s ten most valuable companies had ByteTrend Scores of 5, except for Saudi Aramco. Today, only Microsoft is left on the leaderboard.
Top Ten Most Valuable Companies
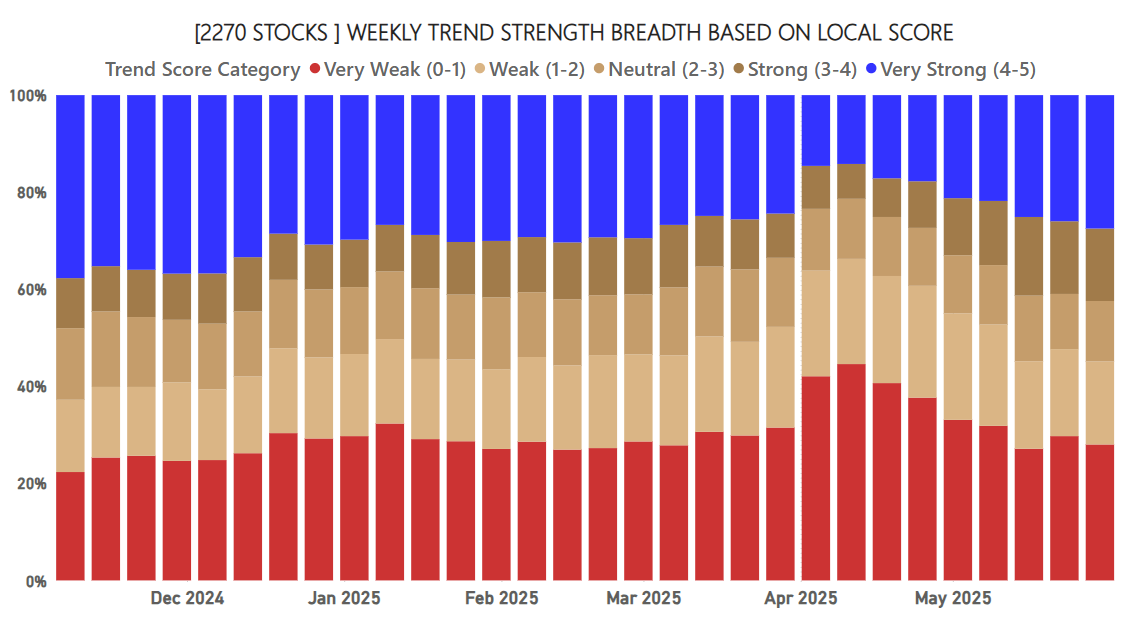
If the mega caps are sluggish, a larger number of smaller stocks are keeping the market going, and that is exactly what is happening, as demonstrated by breadth data. There are fewer weak trends (red) and more strong trends (blue) coming through.
ByteTrend: Weekly Breadth Signal
This marks the beginning of a new era for active management. When the biggest stocks led the market, an active manager wanting to beat the index would have to be overweight in those stocks. I don’t think many did that, for good reason, as it would have breached their diversification limits for starters.
In GTI Premium, we have seen CAPR highs for three UK active fund managers: Jupiter, Ninety One, and M&G. Three in one week, which signals an important shift in the markets. If the larger stocks weigh down on the index, an active manager can win by owning a basket of good companies without size constraints. This is what they normally do, and when the largest stocks are lagging, which is the normal state of affairs, good active managers win. They did before, and they will again.
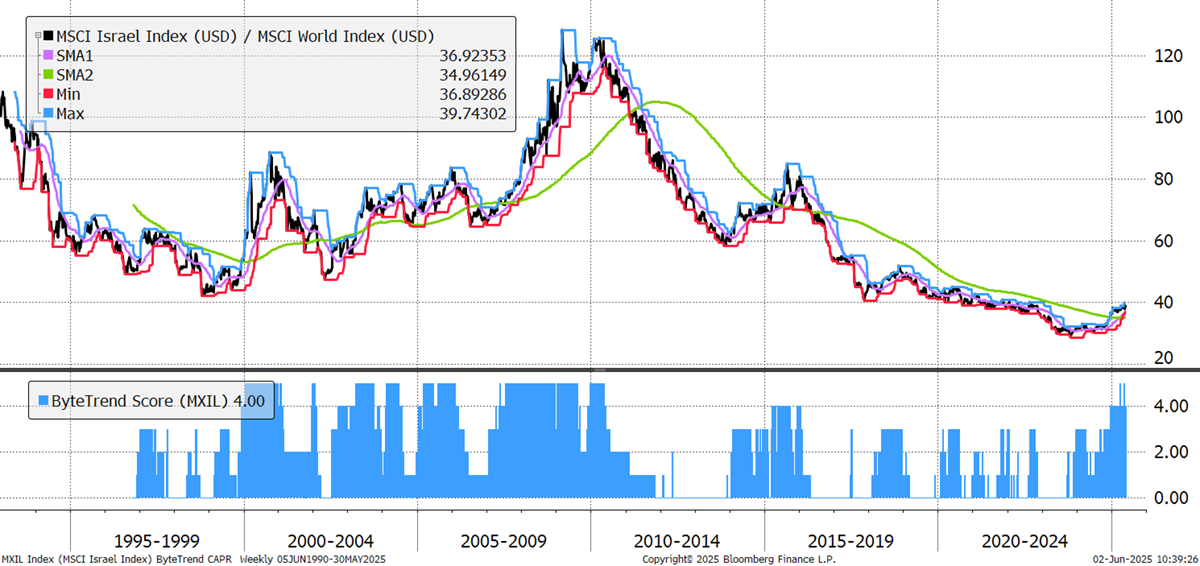
Another standout from GTI Premium comes from Israel, where 7 of the 11 stocks in the universe have ByteTrend Scores of 5. It looks like a great opportunity, but the London iShares Israel ETF closed down in 2021. They still have one in the USA under the ticker EIS, but most UK residents will struggle to buy it.
MSCI Israel CAPR
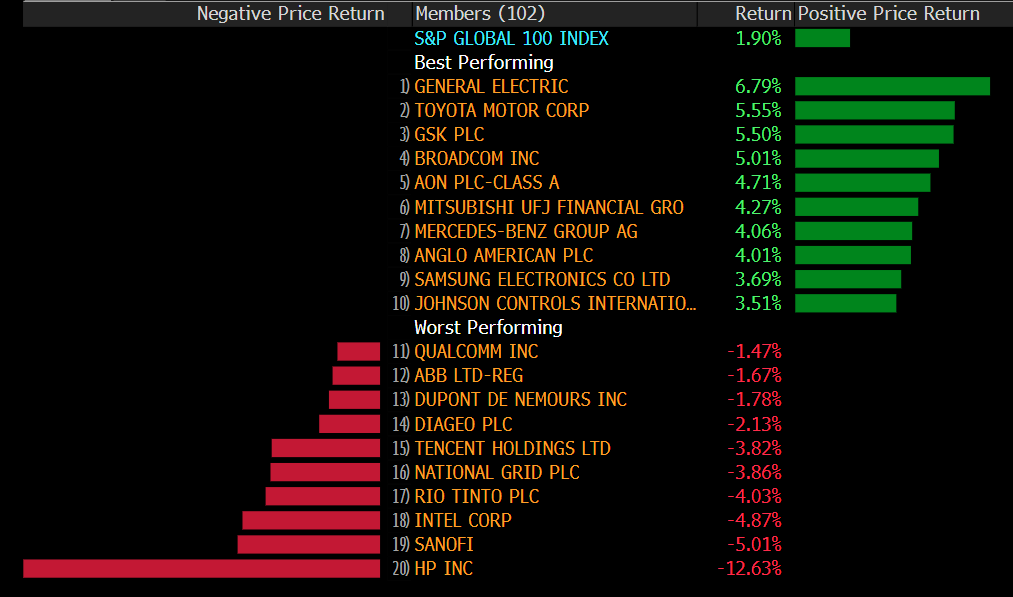
The S&P Global 100 Index saw GE as last week’s strongest stock. GE has held a ByteTrend score of 5 for much of the past two years. The autos also did well, as there was some relief in US tariffs. HP was the laggard and has had a ByteTrend Score of 0 since December.
Developed Markets Leaders and Laggards
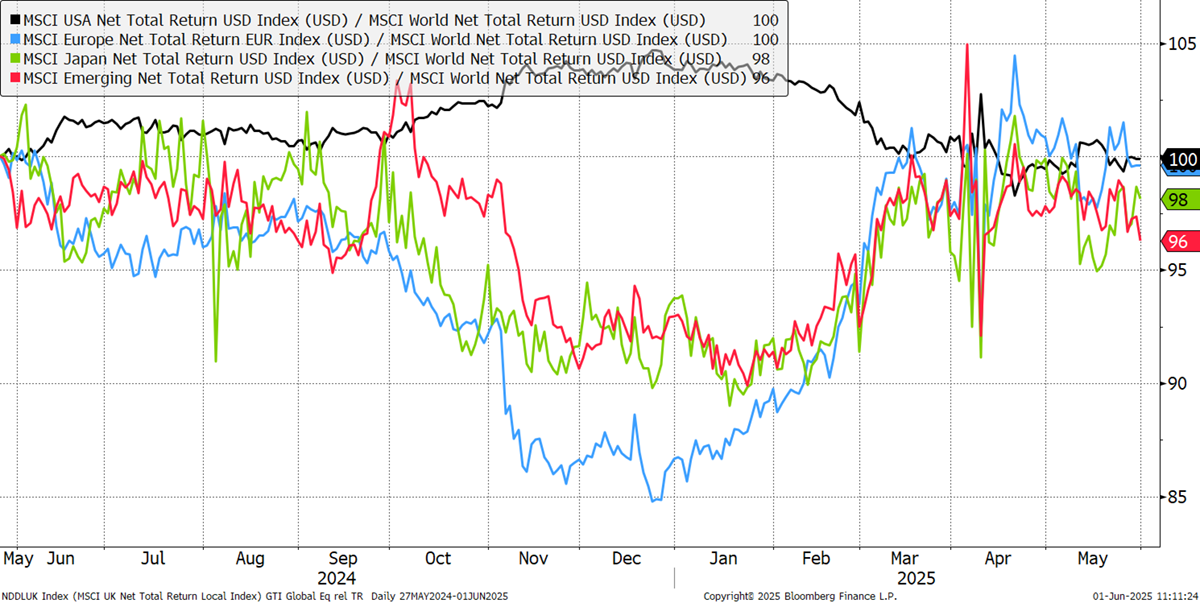
The regional CAPR chart sees the emerging markets rolling over. This has been driven by both India and China. The US is neutral, with Japan and Europe holding the fort.
CAPR: Europe, USA, Emerging Markets, and Japan - Past Year
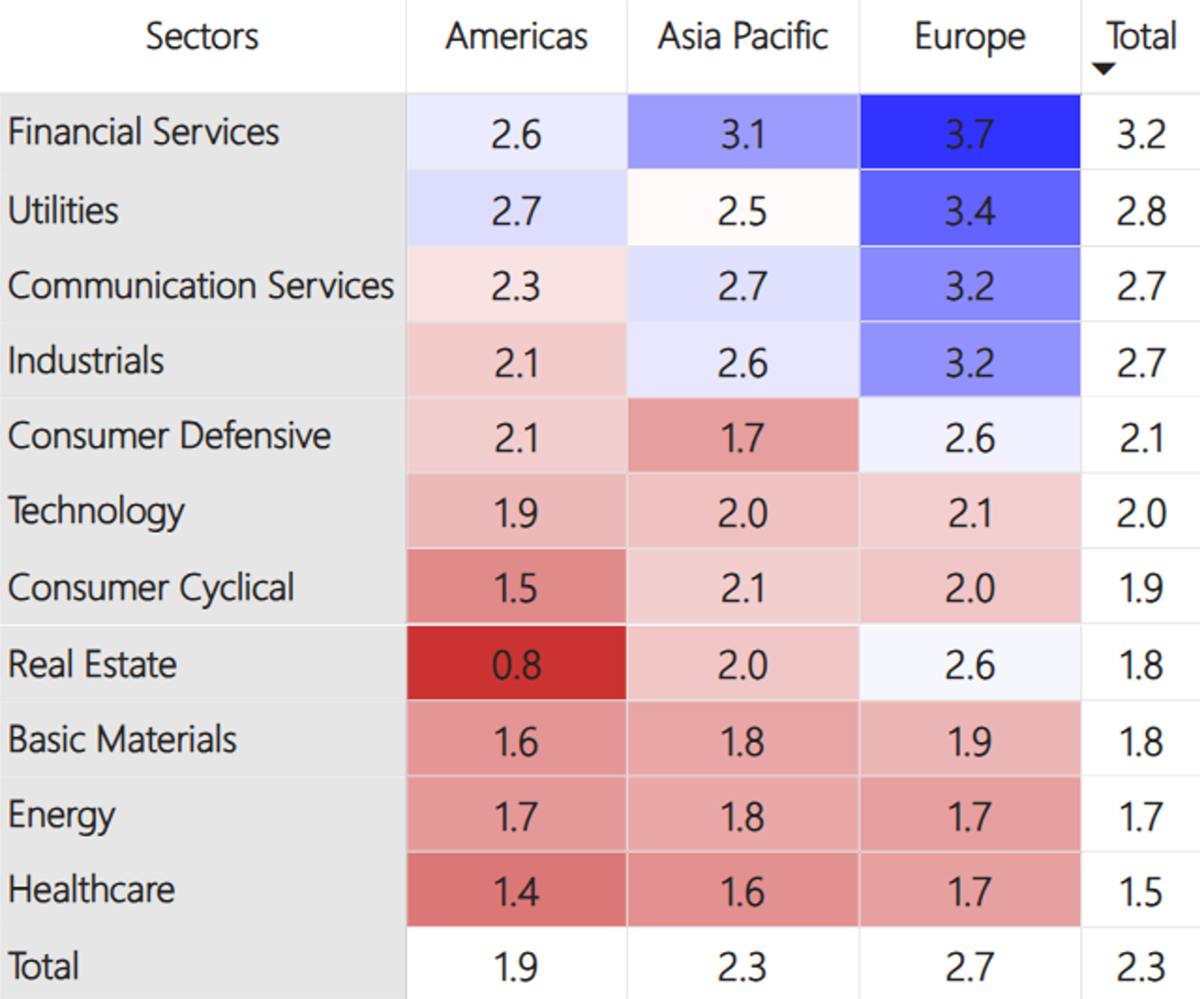
The world matrix puts Europe firmly in the lead, with financials and utilities still strong. The divergence between US and European real estate is notable, and there is a comment on that in today’s GTI Premium message.
Average ByteTrend Score by Region and Sector Heatmap - CAPR
Leading Trends with New Highs
These stocks are trading at the 30-week CAPR highs with a ByteTrend Score of 5. All charts shown are CAPR rebased to 100.


