Alpha Extremes


Issue 39;
- Alpha extremes of historic proportions are happening now.
- Cracks in global payments.
- Defensive stocks are selling cheap (we’ve seen this before).
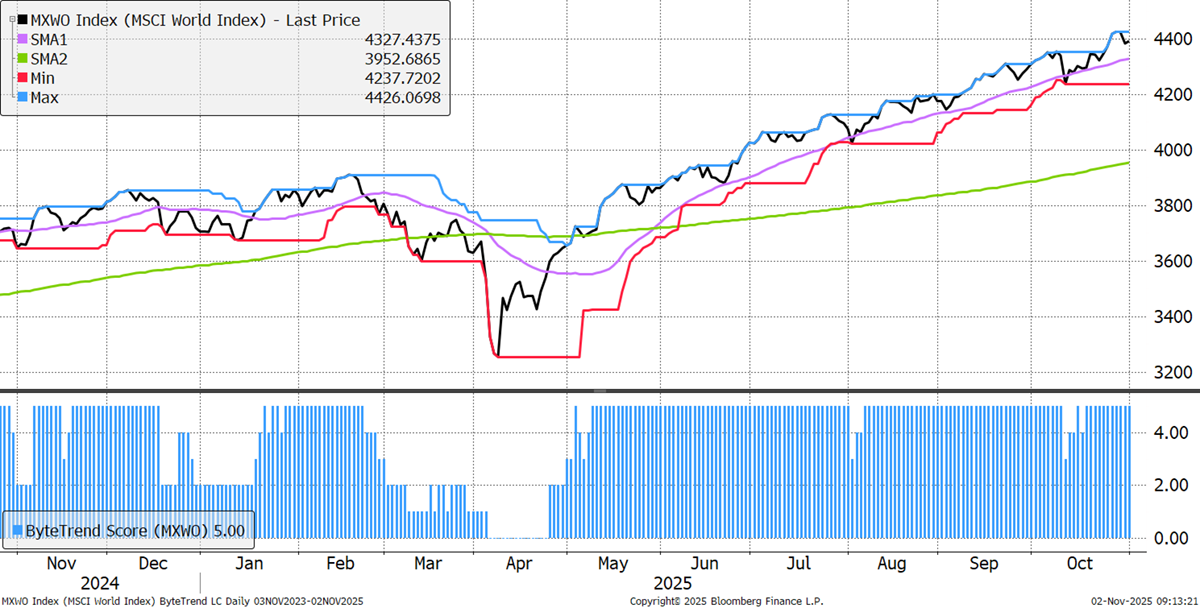
The World Index maintains its ByteTrend Score of 5. The index is 11% above its 200-day moving average, which is high, but not yet alarming.
World Index – Developed Markets – Daily
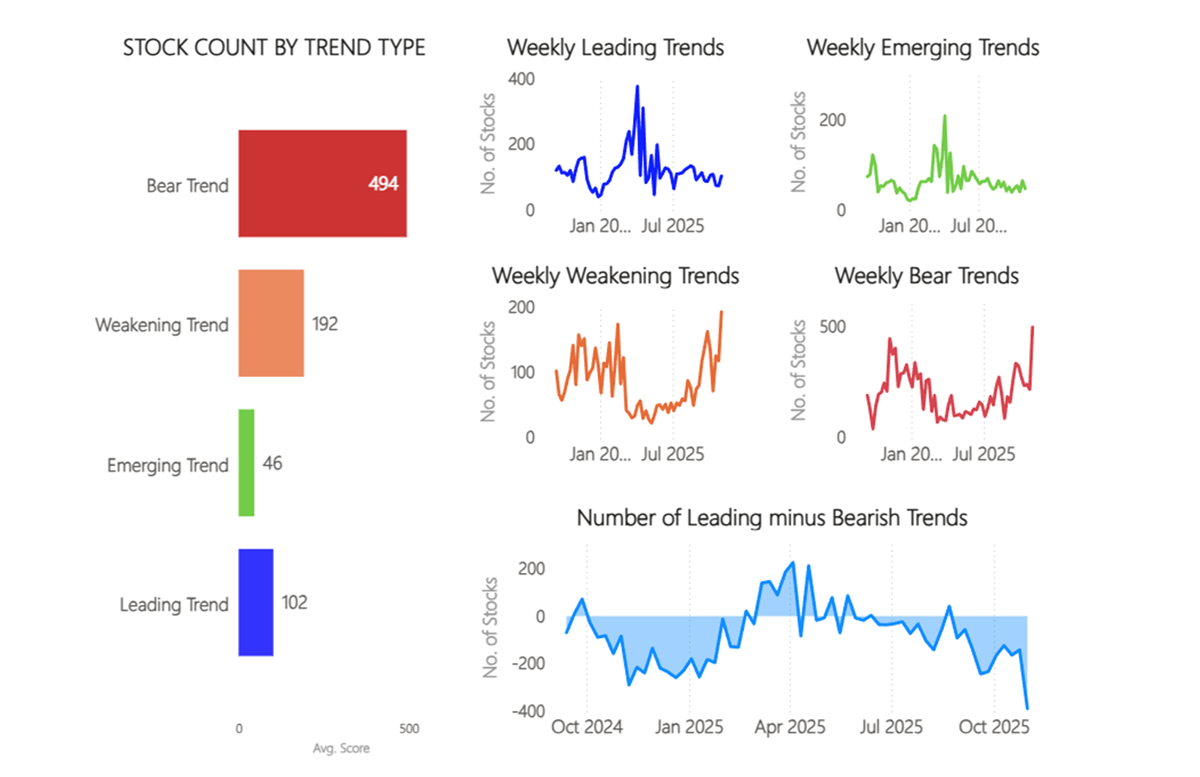
Trend by Type - Alpha
We continue with the alpha versus beta extremes. Currency-adjusted price relative, CAPR, measures stocks in terms of their alpha, or relative performance, whereas price measures their beta, or market performance. Great investors win by adding alpha on top of their beta. Rarely have the two diverged to such an extent.
Starting with CAPR, the number of leading and emerging trends this week appears to be within normal range. But on the weakening and bear side, the quantum has exploded. There are 514 CAPR bear trends this week, which is much higher than normal. The leading trends minus the bearish trends (blue) highlight this differential. It means a few large companies, mainly in tech, are beating the market, while many more large-caps and mid-caps are lagging.
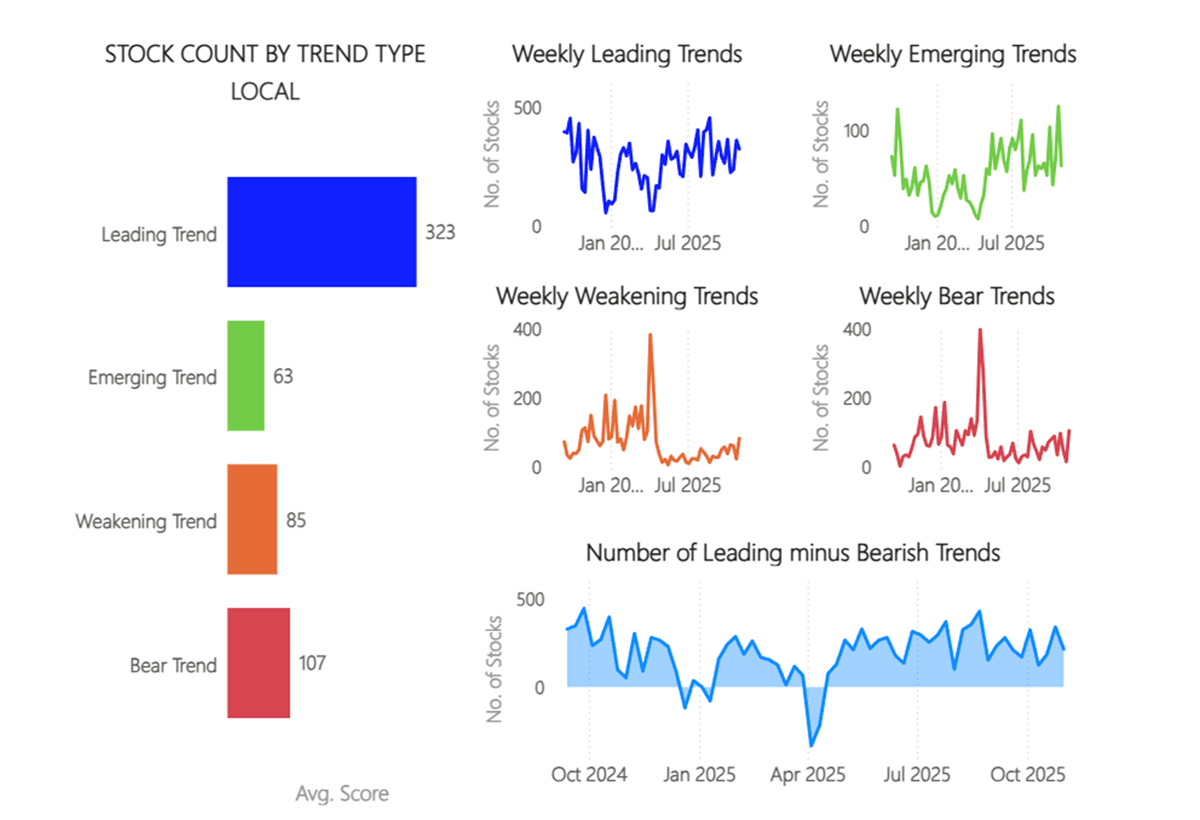
Trend by Type - Beta
Showing that in price, or local currency, as opposed to CAPR, tells a different story. Everything appears to be normal. The leading and emerging trends do not stand out at all, and the weakening trends and bears are up slightly, but not alarmingly so. The spike in bear trends was during the Tariff crash in April.
ByteTrend: Average Age of the Leading Trends
Those alpha trends have a shorter life expectancy than they did in the summer. The average stocks with a ByteTrend Score of 5 in CAPR (market leader) have fallen from 4 weeks to 2.5 weeks. As a result, investors should be less trusting of strong trends as the churn rate is high.

ByteTrend: Weekly Breadth Signal – CAPR
At the stock level, the GTI universe of 2,523 stocks confirms this. More than half of all stocks are in a downtrend versus the market, which jumped last week (red). Conversely, there are fewer market beaters (blue) and neutral stocks (tan). We highlighted this last week, and it has gotten even more extreme, returning to January’s levels.

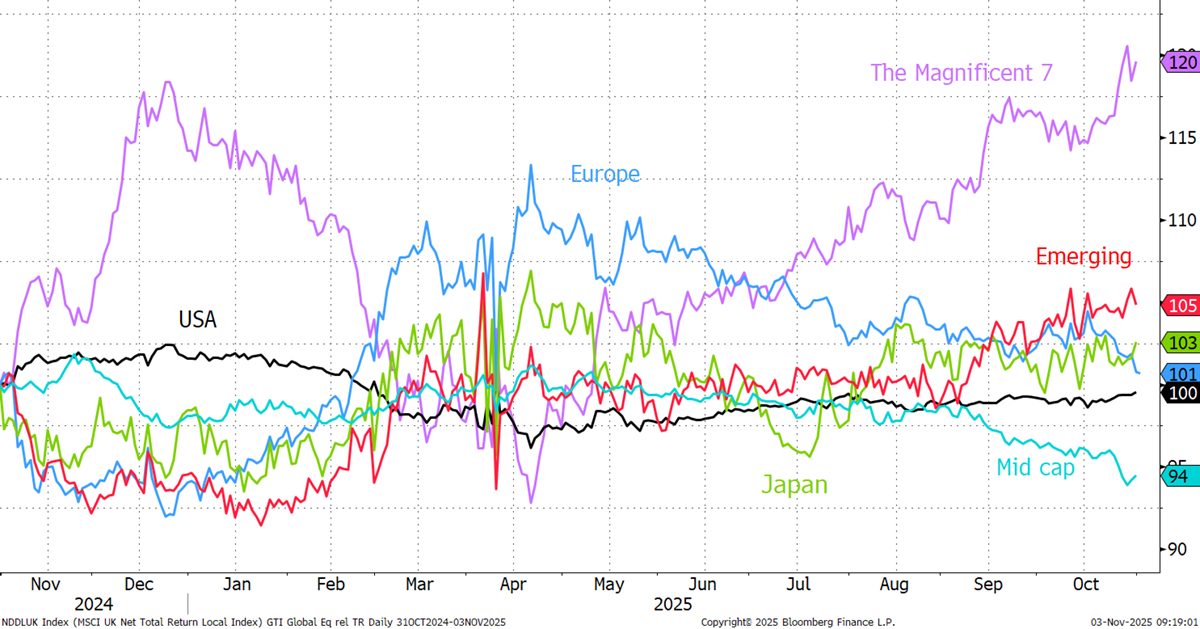
The elephant in the room is the large technology stocks, as illustrated by the Magnificent 7 (purple). Europe (blue) is noticeably weaker of late, while EM and Japan hold up. The US is neutral, while global mid-caps (cyan) have slumped. Money has been sucked out of mid-caps to drive big tech higher.
CAPR: Europe, USA, The Mag 7, Emerging Markets, Mid-Cap, and Japan - Past Year
Average ByteTrend Score by Region and Sector Heatmap – CAPR
The matrix sees weaker financials across the regions once again, but utilities are weaker still. Consumer defensive and real estate are much weaker. Technology is slightly stronger, but not materially so. Most regions and sectors are softer because the leadership is dominated by a few very large stocks that don’t move the average. Beta is still plentiful, while alpha has become scarce.

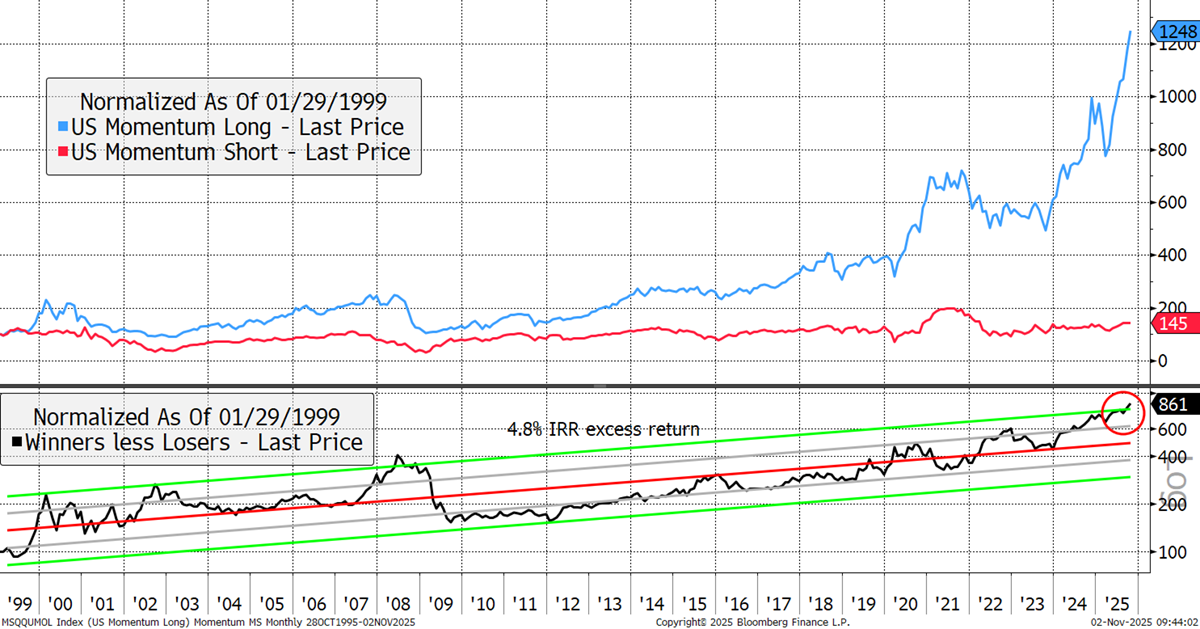
US Momentum Effect
The US momentum chart goes back to 1999. The current reading of the winners (best performers over the past year) versus the losers (laggards over the past year) is extreme. The winners over losers (black log scale with a regression) are also at extreme levels. The traders might love this rally, but the historians are deeply suspicious.
Leading Trends with New Highs
These stocks are trading at the 30-week CAPR highs with a ByteTrend Score of 5. All charts shown are CAPR rebased to 100.
| NVDA | USD | NVIDIA Corporation |
| AAPL | USD | Apple Inc. |
| GOOGL | USD | Alphabet Inc. |
| 2330 | TWD | Taiwan Semiconductor Manufacturing Company Limited |
| PLTR | USD | Palantir Technologies Inc. |
| AMD | USD | Advanced Micro Devices, Inc. |
| ASML | EUR | ASML Holding N.V. |
| GE | USD | GE Aerospace |
| CAT | USD | Caterpillar Inc. |
| 660 | KRW | SK hynix Inc. |
| AXP | USD | American Express Company |
| 9984 | JPY | SoftBank Group Corp. |
| MU | USD | Micron Technology, Inc. |
| LRCX | USD | Lam Research Corporation |
| AIR | EUR | Airbus SE |
| AMAT | USD | Applied Materials, Inc. |
| APH | USD | Amphenol Corporation |
| KLAC | USD | KLA Corporation |
| 6501 | JPY | Hitachi, Ltd. |
| 2317 | TWD | Hon Hai Precision Industry Co., Ltd. |
| SCCO | USD | Southern Copper Corporation |
| 6857 | JPY | Advantest Corporation |
| DELL | USD | Dell Technologies Inc. |
| HCA | USD | HCA Healthcare, Inc. |
| 7011 | JPY | Mitsubishi Heavy Industries, Ltd. |
The Magnificent 7 CAPR
With such tech dominance, we show the CAPR of the Mag 7 over the past year. Only META has lagged the World Index, while AAPL and AMZN rebounded last week. TSLA, GOOG, and NVDA lead.

The Top Ten Stocks
Combining the trillion-dollar companies adds AVGO, BRK, and TSM, with Saudi Aramco excluded. They are collectively worth $26 trillion, which is $21 trillion more than at the pandemic low. That makes up 43% of the S&P 500 Index, which is (presumably) unprecedented. Previous occasions of extreme dominance have resulted in severe corrections.

General Electric
Looking at non-computer stocks, we find GE, which makes gas turbines and aircraft engines. General Electric completed its transformation in 2024 by spinning off GE Vernova (energy) and GE HealthCare, leaving GE Aerospace as a pure-play in aviation engines, services, and defence propulsion. The order book is solid, and if you order a gas turbine today, it’ll be delivered in 2030.

Southern Copper
The company mines copper, molybdenum, zinc, and precious metals in Peru and Mexico. They reported strong results due to rising metal prices, with sales up 15.2%

There are 83 additional leading trends with new highs in the GTI universe. Semis and industrial machinery stand out, as does aluminium and aerospace. Financials are now thin, while energy features again.
Emerging Trends
These stocks are trading at the 30-week CAPR highs with a ByteTrend Score of less than 5. They don’t have to be in an uptrend, just emerging. All charts shown are CAPR rebased to 100.
| TSLA | USD | Tesla, Inc. |
| 5930 | KRW | Samsung Electronics Co., Ltd. |
| SHOP | CAD | Shopify Inc. |
| QCOM | USD | QUALCOMM Incorporated |
| INTC | USD | Intel Corporation |
| TD | CAD | The Toronto-Dominion Bank |
| 1088 | HKD | China Shenhua Energy Company Limited |
| 8035 | JPY | Tokyo Electron Limited |
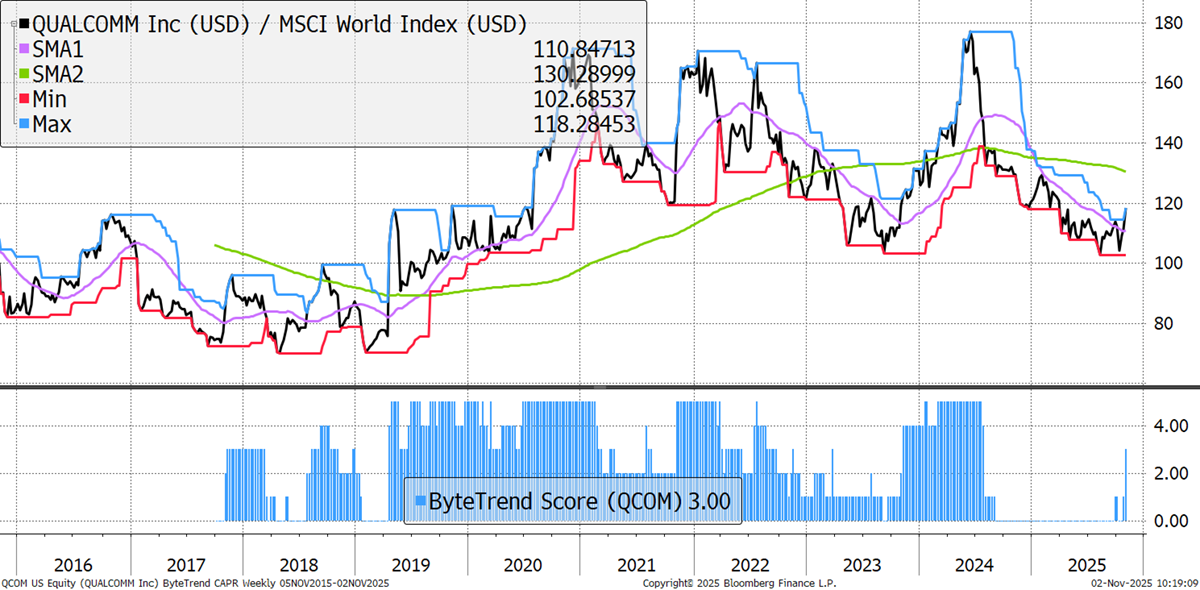
Qualcomm
QCOM has been in a bear trend for a while, which makes it interesting. They are expanding into AI, automotive, and the Internet of Things. The last results were strong, as is the forward guidance.