
Blockade


Issue 60;
- Broad rally in the run-up to peace talks, which have ended.
- Oil is back above $100.
- The money supply grows.
Global Trends is a deep dive into global equities. The aim of this analysis is to better understand which countries, sectors, industries, and stocks are driving market returns. Not only does it help investors identify opportunities, but it also highlights the risks. We try to condense as much important information as possible, focusing on what really matters each week. Embrace this as a weekly discipline, and you’ll soon have a much better understanding of global financial markets.
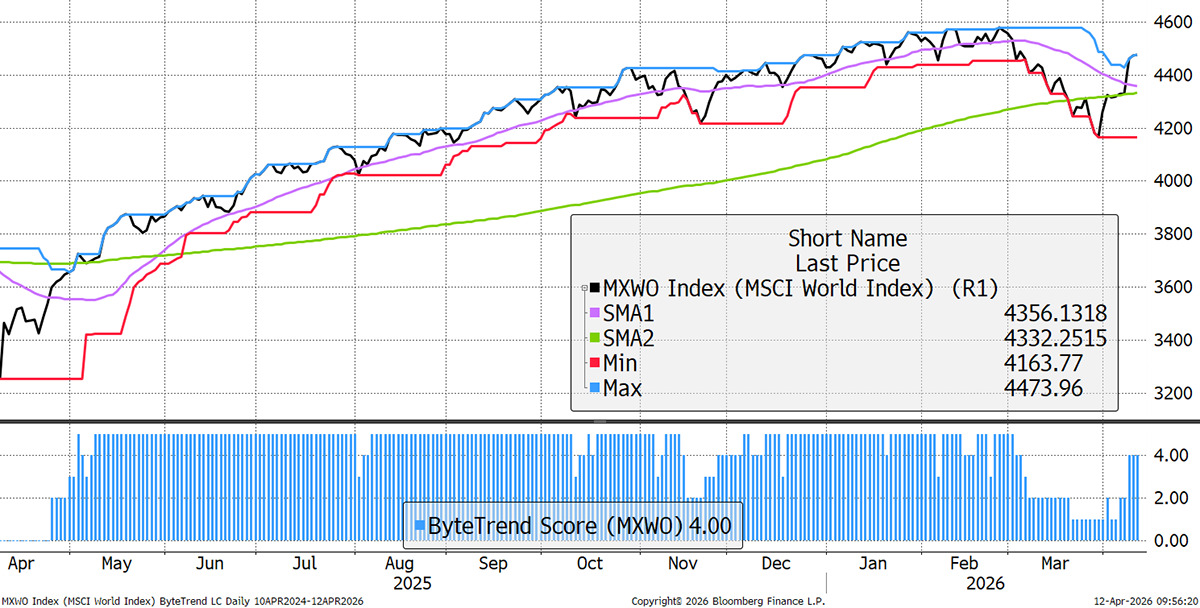
The World Index has a ByteTrend Score of 4 in USD. This is a sharp turnaround from two weeks ago, as the index trades back above its 200-day moving average. The 30-day moving average still has a negative slope.
World Index – Developed Markets – Daily
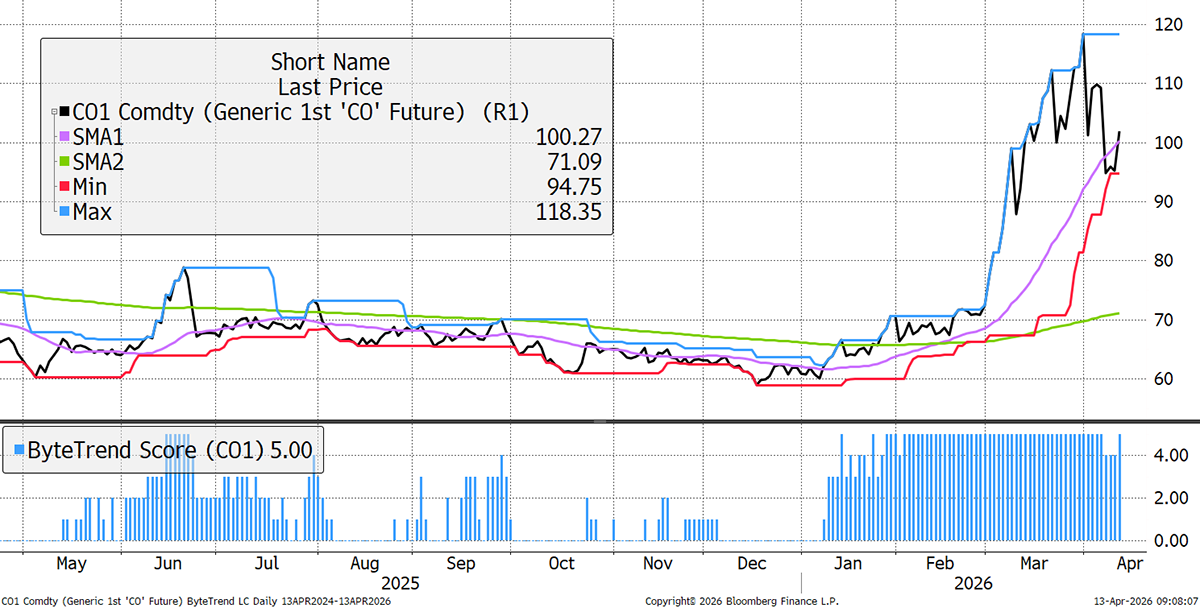
Oil Back Above $100
After a bout of optimism last week, there is now a US blockade in the Straits of Hormuz, which has sent the oil price higher. Brent Crude has a ByteTrend score of 5, having set back to 4 late last week. The risk of an oil shock remains likely.
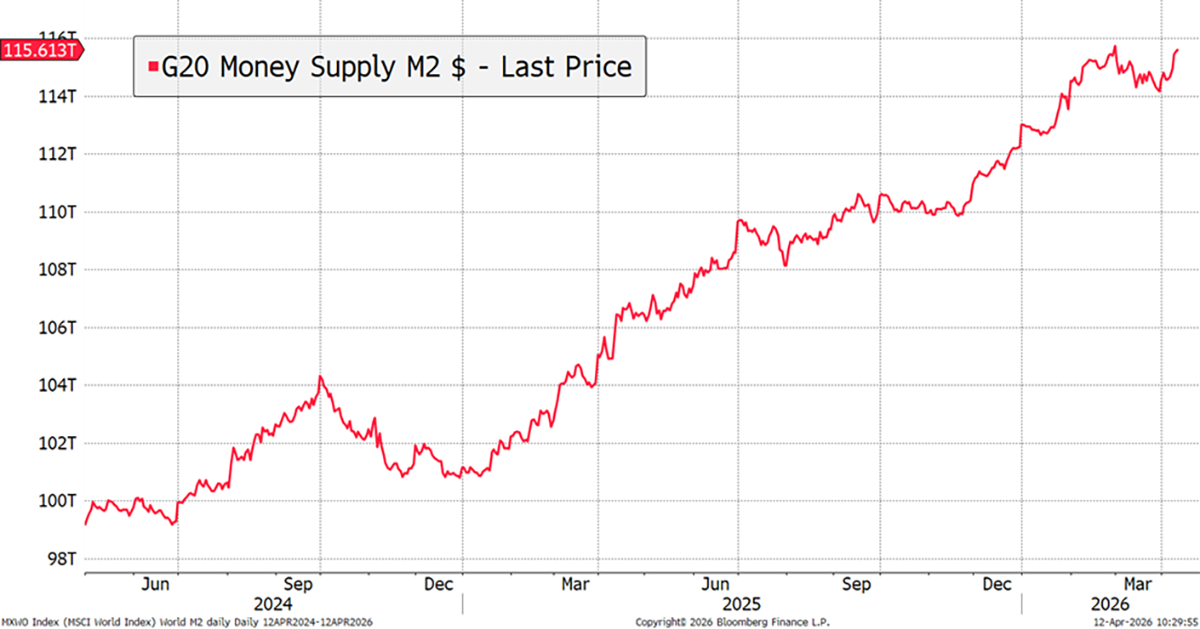
The Money Supply
After a brief setback for liquidity, the G20 money supply approaches its all-time high. There is nothing that stockmarkets like more than money itself. The money supply has also been boosted by a weaker dollar, which is down 2% in April. If the dollar stays weak, perhaps markets will remain well nourished, just as they did during the pandemic, when the economy was largely closed yet stocks rose.
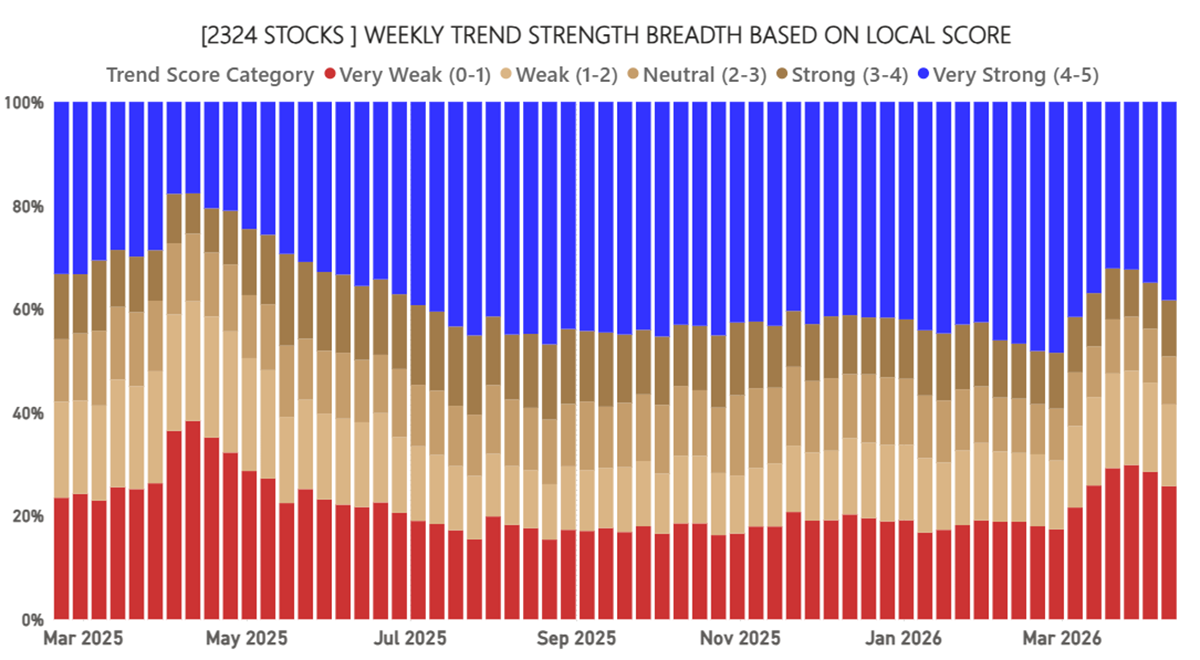
Global Equity Breadth – Local Currency
Breadth has improved for the past two weeks. This even anticipated the turn in the market on the announcement of peace talks. They have failed, but the market was likely expecting a more positive outcome.
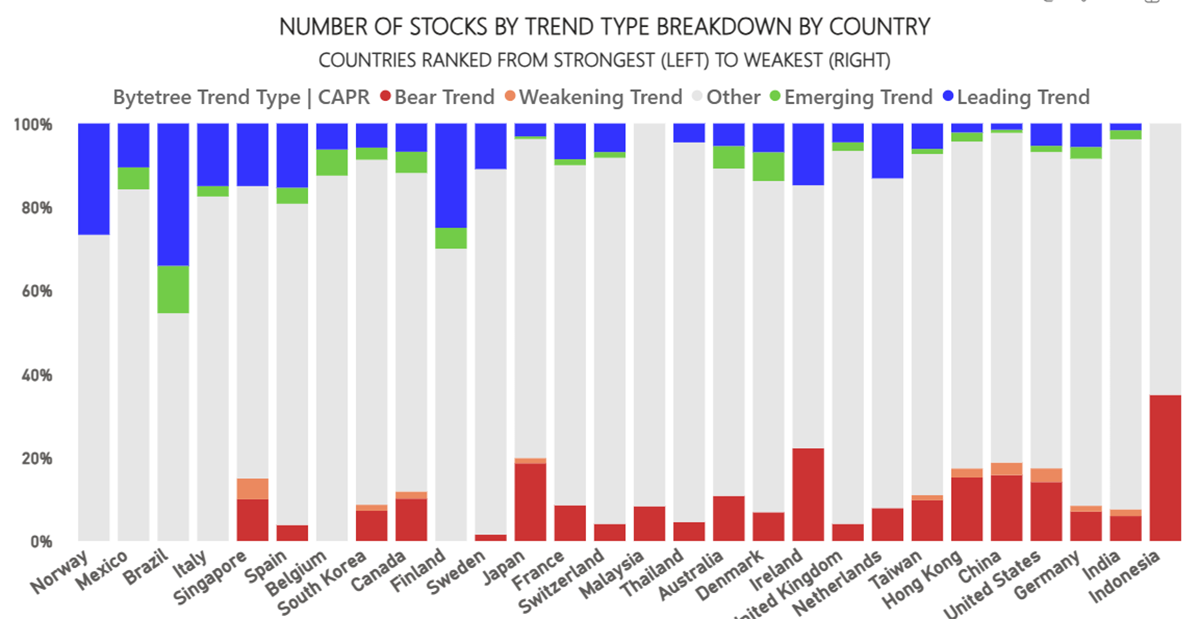
Country Breadth – CAPR
Checking in on countries, oil-producing nations are the strongest, with the surprise exception of Italy. The weakest are leading industrial nations such as India, Germany, China, and the US. Indonesia has been persistently weak for other reasons, such as the MSCI warning on EM index inclusion, as the market has poor liquidity and governance.
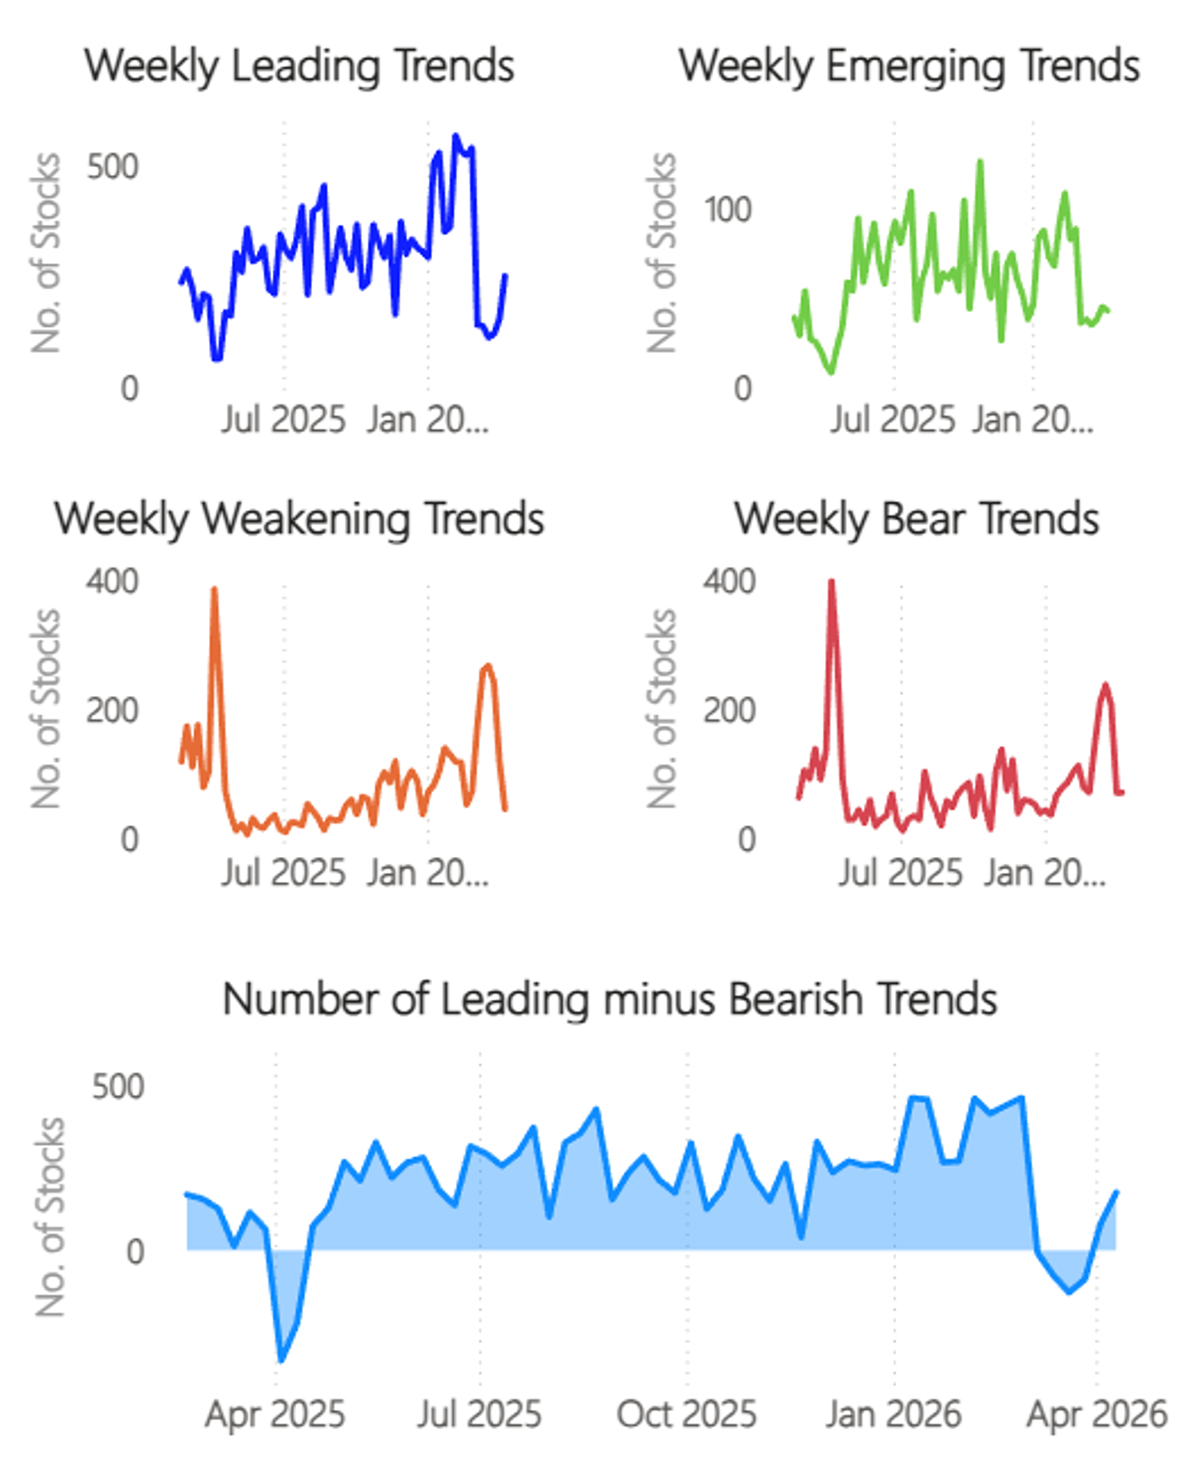
New Trends Remain Soft
The number of new price highs has improved, but not by much. More importantly, the spike in bear signals has scaled back.
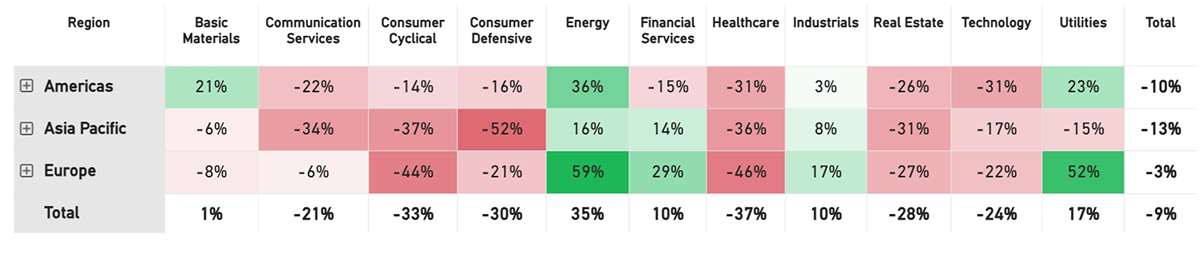
Net Winners
The winners less losers data is a powerful guide for asset allocators, which reflects what a momentum long/short strategy should look like. Energy, Utilities, and Financial Services remain the strongest sectors, with Healthcare, Consumer Cyclicals, Defensives, and Real Estate the weakest. This resembles the expectations and risks associated with higher bond yields.
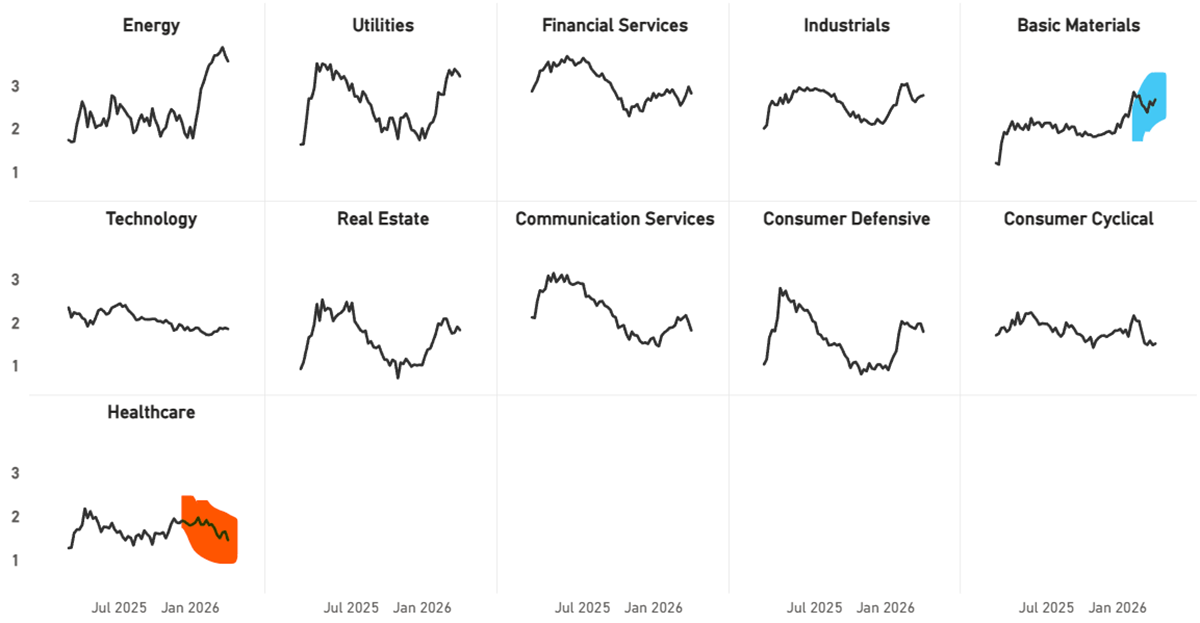
Industry Trend Changes in CAPR
There has been no material change in sectors, but Basic Materials are back, while Healthcare continues to be derated. Energy was weak until Friday, but it has opened strongly this morning.
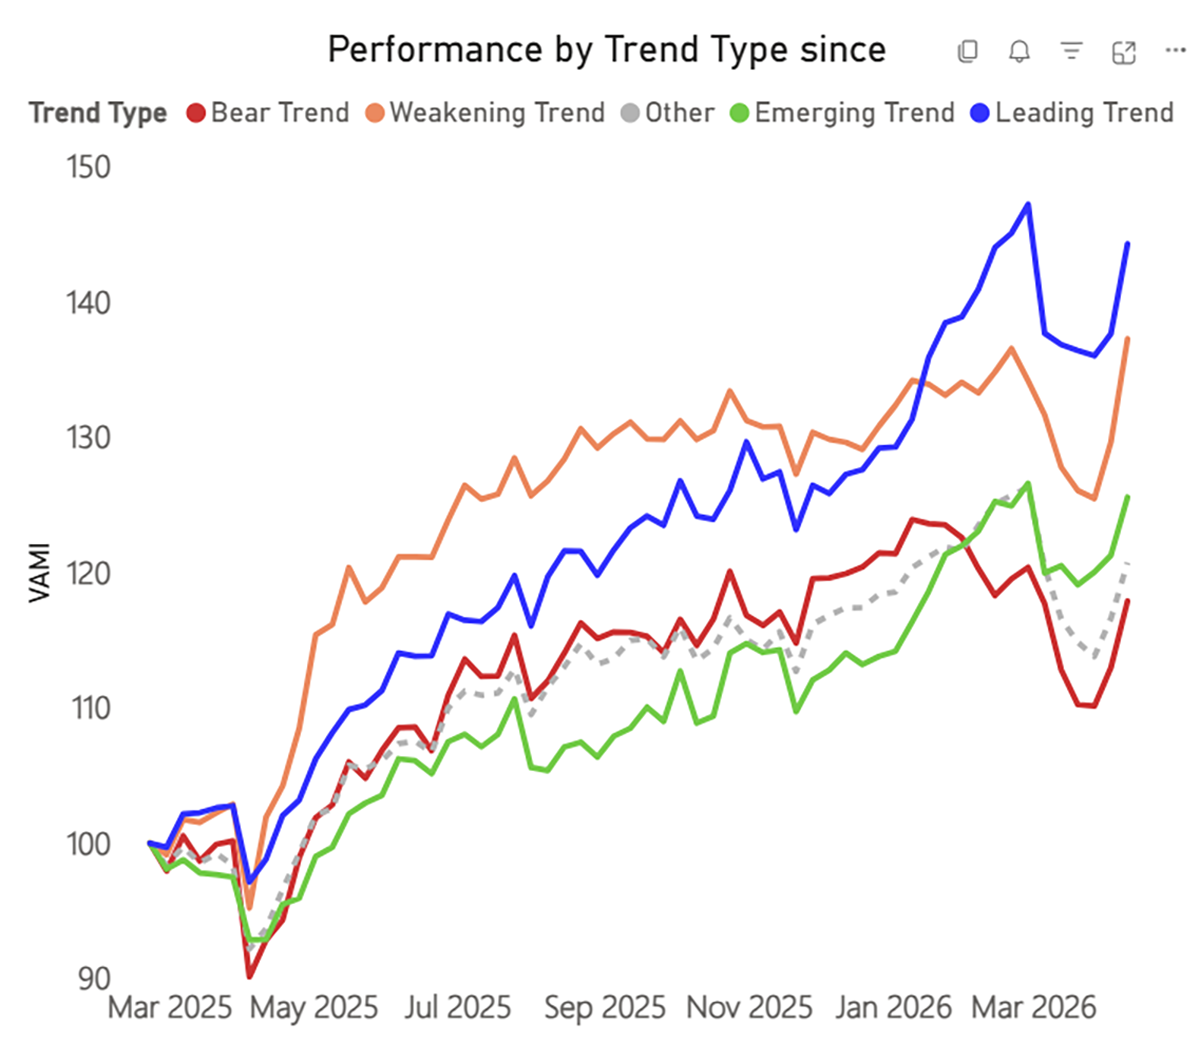
Trend Type Performance
The recovery has been broad, with the best performance from weakening and bear trends, which are oversold. I wouldn’t classify this as so much of a momentum crash as a lift across the board. The strength of the move implies considerable short positions had built up.
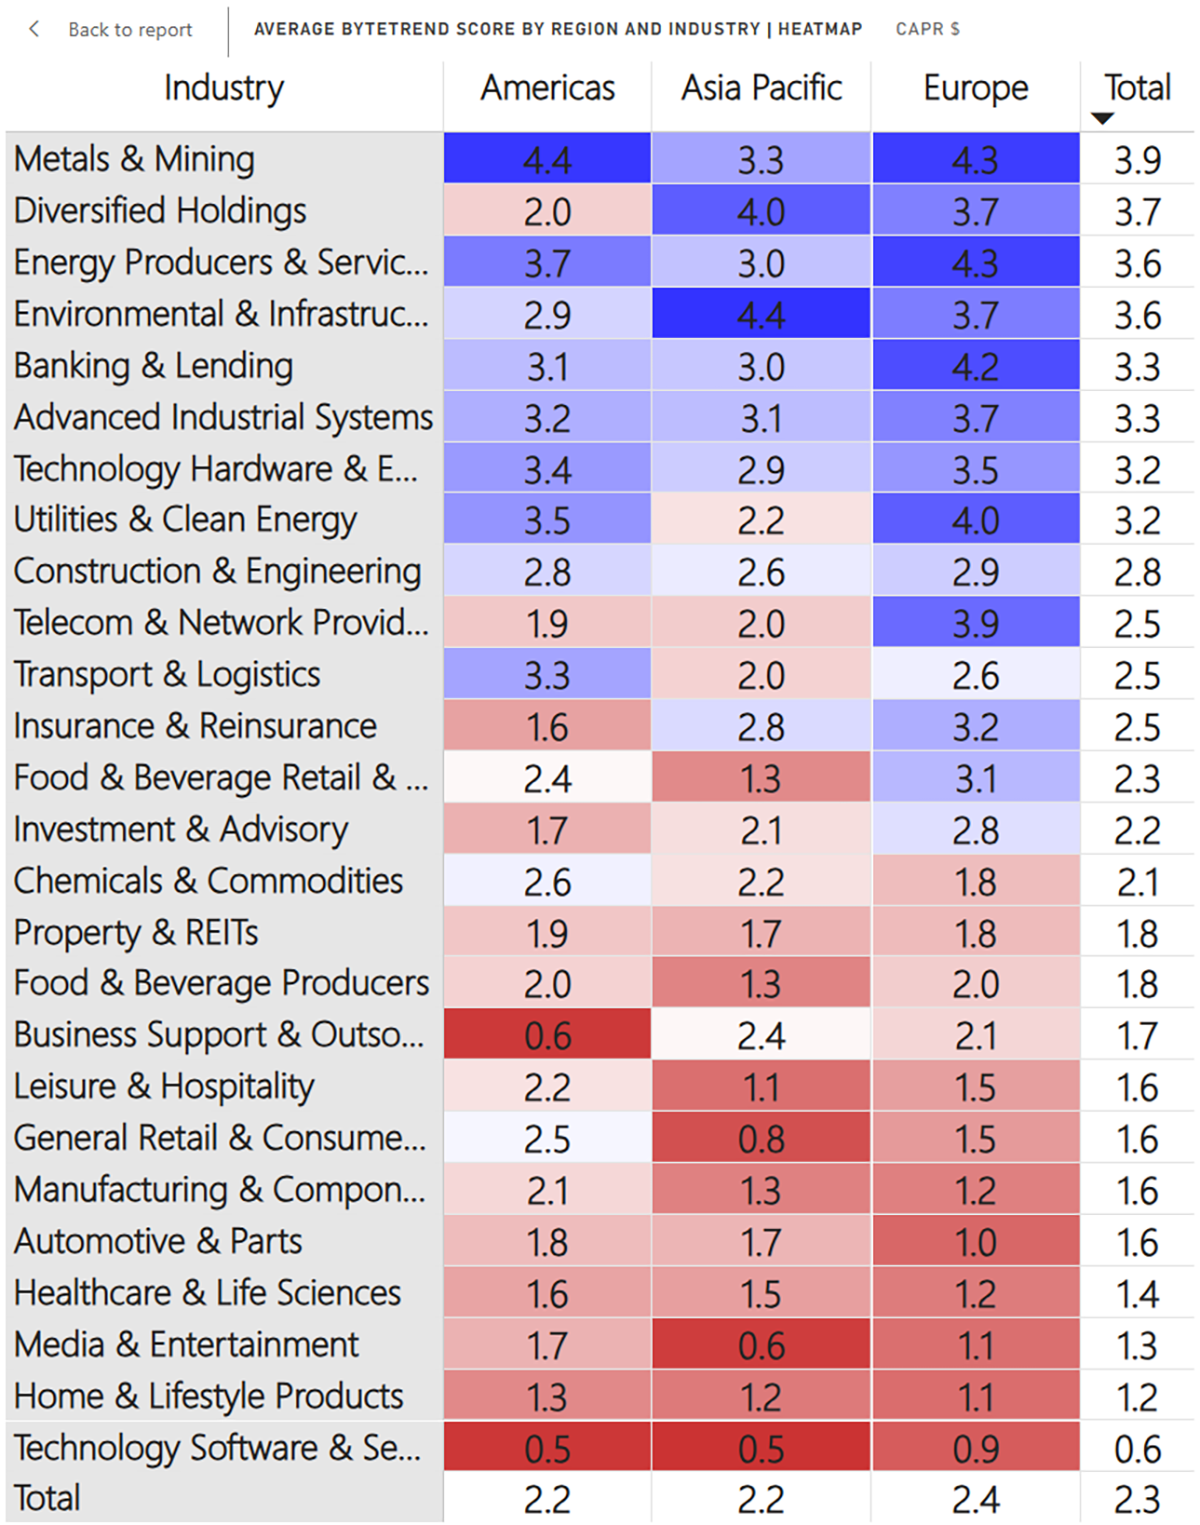
Regions and Industries Average CAPR Score
Metals are back in front with the highest group score. Utilities and Clean Energy have held up with old energy. Banks have also proved to be resilient. The Consumer, Health, and Software remain troubled. Food & Beverage has also improved significantly.
User Guide
Refer to our GTI: User Guide for an overview of the key concepts and terminology used in this report. These concepts may take a little bit of getting used to, but they are very powerful once you do.
How to Read the Tables
The Value Composite Score (Value) is measured against the company’s own financial history and not in absolute terms. The columns are Cheap (Chp), Value (Val), Fair Value (FV), Overvalued (OV), and Expensive (Exp). The Growth Composite Score (Growth) is measured by sales, earnings, cash flow, dividends, and book value on a per share basis. The columns are High, Good, Medium (Med), Low, and Negative (Neg).
Leading Trends with New Highs
These stocks are trading at the 30-week CAPR highs with a ByteTrend Score of 5. All charts shown are CAPR rebased to 100.
| Name | Annual Vol 30w | Mkt Cap $Bn | Value | Growth |
| Taiwan Semiconductor Manufacturing | 26 | 1634 | OV | High |
| ASML Holding N.V. | 40 | 578 | OV | Good |
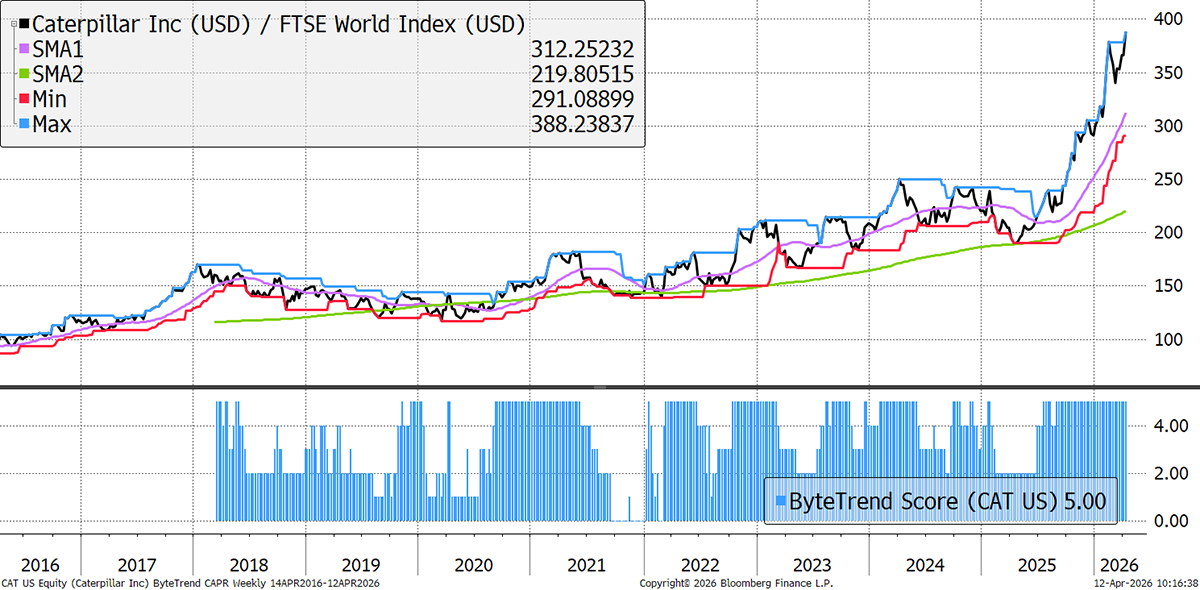
| Caterpillar Inc. | 34 | 370 | Exp | Good |
| Lam Research Corporation | 55 | 329 | Exp | Good |
| Applied Materials, Inc. | 44 | 317 | Exp | Med |
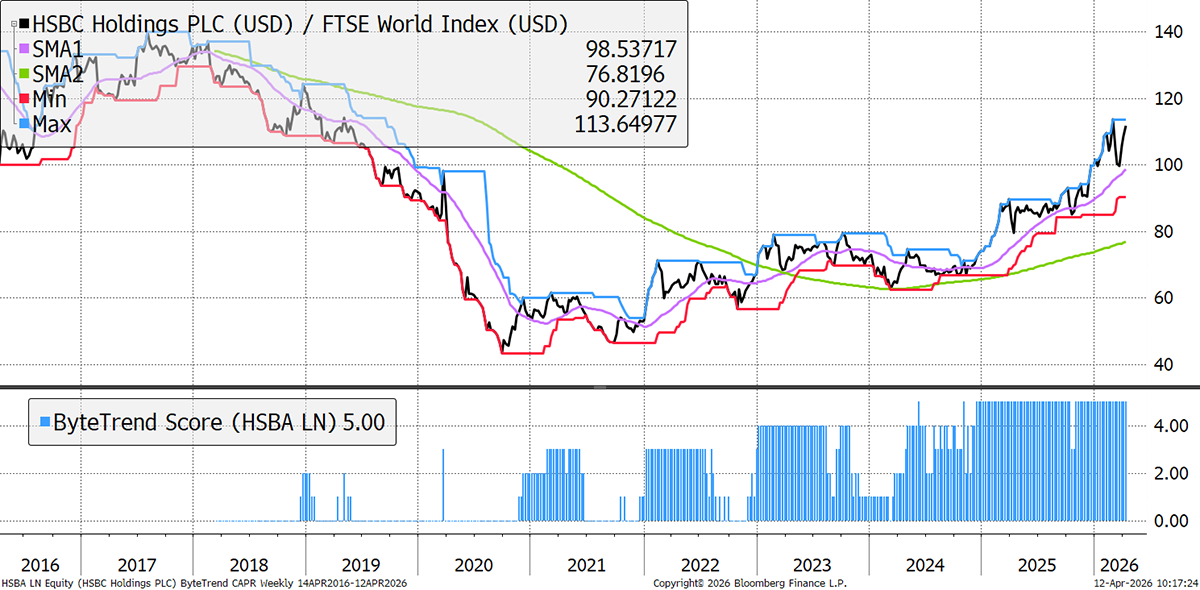
| HSBC Holdings plc | 31 | 310 | OV | Good |
| GE Vernova Inc. | 37 | 267 | OV | Med |
| Royal Bank of Canada | 14 | 240 | OV | Good |
| KLA Corporation | 45 | 228 | Exp | Good |
| Citigroup Inc. | 30 | 218 | OV | Good |
| Commonwealth Bank of Australia | 27 | 217 | OV | Good |
| Analog Devices, Inc. | 36 | 171 | OV | Med |
| Siemens Energy AG | 38 | 168 | Exp | High |
| ABB Ltd | 27 | 165 | OV | High |
| Rio Tinto Group | 24 | 160 | OV | Neg |
| Corning Incorporated | 51 | 147 | Exp | Good |
| Fast Retailing Co., Ltd. | 39 | 146 | OV | Good |
| Delta Electronics, Inc. | 49 | 142 | Exp | Good |
| Tokyo Electron Limited | 44 | 127 | Exp | Good |
| Delta Electronics (Thailand) Public | 53 | 123 | Exp | High |
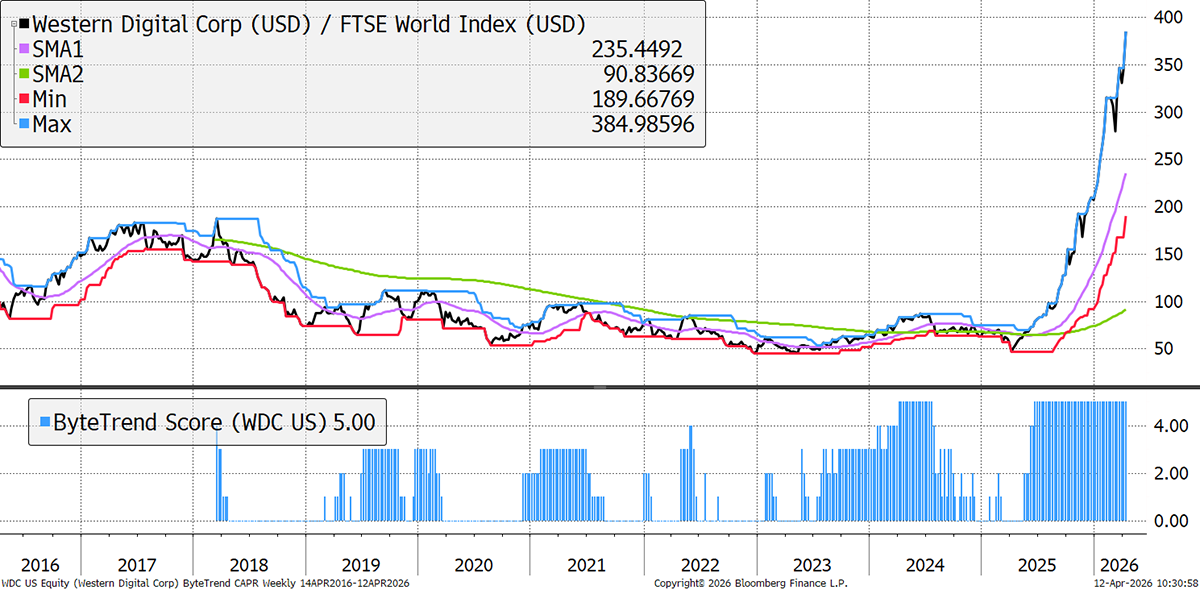
| Western Digital Corporation | 62 | 116 | Exp | Good |
| Vertiv Holdings Co | 53 | 113 | Exp | High |
| Marvell Technology, Inc. | 56 | 112 | OV | Good |
| Seagate Technology Holdings plc | 63 | 110 | Exp | Neg |
| Westpac Banking Corporation | 17 | 103 | OV | Good |
| Trane Technologies plc | 29 | 103 | OV | Good |
| Freeport-McMoRan Inc. | 49 | 97 | Exp | Neg |
| Canadian Imperial Bank of Commerce | 17 | 95 | OV | Good |
| Marriott International, Inc. | 28 | 94 | OV | Good |
| The Bank of New York Mellon | 19 | 89 | OV | High |
| Johnson Controls International plc | 33 | 87 | Exp | Med |
| Cummins Inc. | 28 | 85 | OV | High |
| Hilton Worldwide Holdings Inc. | 21 | 74 | OV | Good |
| Ciena Corporation | 51 | 70 | Exp | Good |
| PACCAR Inc | 25 | 67 | OV | Med |
| Monolithic Power Systems, Inc. | 47 | 66 | OV | High |
| Simon Property Group, Inc. | 19 | 65 | OV | Good |
| Nordea Bank Abp | 18 | 63 | FV | Good |
| HOYA Corporation | 24 | 63 | OV | Med |
| Teradyne, Inc. | 64 | 58 | Exp | Low |
| Keysight Technologies, Inc. | 49 | 56 | OV | Med |
| National Bank of Canada | 18 | 55 | OV | Good |
| Sandvik AB (publ) | 27 | 54 | OV | Good |
| ASE Technology Holding Co., Ltd. | 55 | 54 | Exp | Neg |
| AMETEK, Inc. | 22 | 54 | OV | Good |
| Nokia Oyj | 37 | 53 | Exp | Med |
| Hanwha Aerospace Co., Ltd. | 68 | 52 | Exp | High |
| Sumitomo Electric Industries, Ltd. | 51 | 52 | Exp | High |
Caterpillar
The recent mining cycle has been a boon for CAT. This strength has continued as reconstruction efforts will sustain high demand. More importantly, perhaps, is that their power and energy division has become their largest business, serving data centres.
HSBC
It is notable that HSBC is strong, as is Citigroup. Both are global banks with high exposure to Asia. This follows recent strength in Chinese banks, suggesting capital flows are seeking sanctuary in Asian financials.
Western Digital
Tech hardware remains super strong. WDC has sold out its entire production capacity for 2026. The bottlenecks are not just in the Straits of Hormuz.
New Leading Trends
These stocks are trading at the 30-week CAPR highs with a ByteTrend Score of 5, except they are new trends this week, having previously had a score below 5. All charts shown are CAPR rebased to 100.
| Name | Annual Vol 30w | Mkt Cap $Bn | Value | Growth |
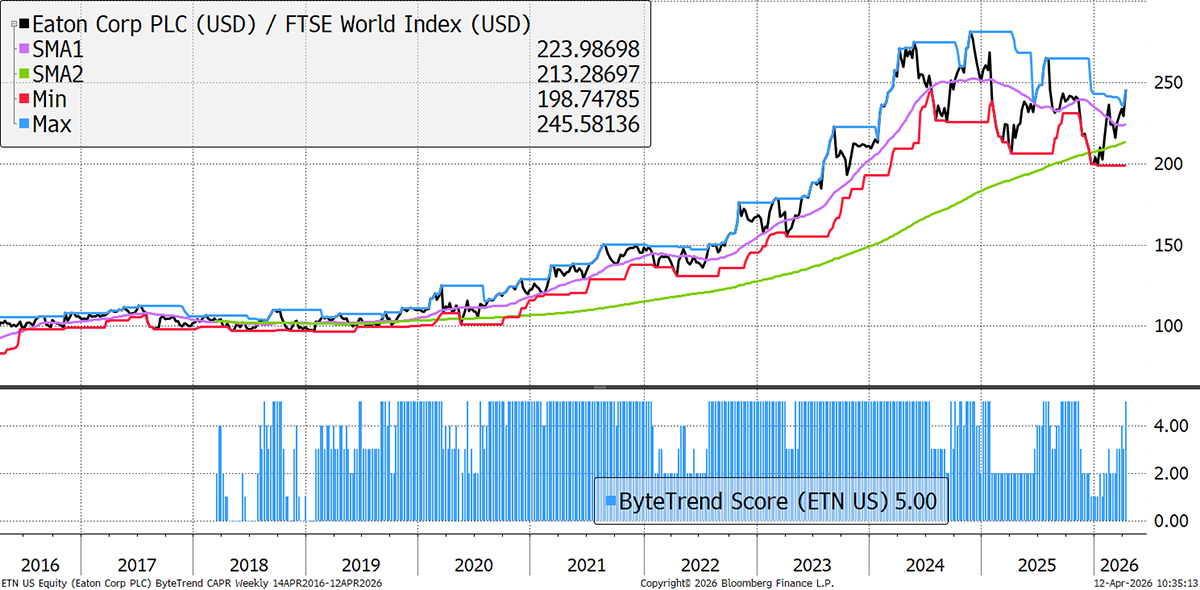
| Eaton Corporation plc | 30 | 156 | Exp | Good |
| L'Air Liquide S.A. | 18 | 128 | OV | Med |
Eaton
AI training and inference require massive, reliable power delivery, distribution, and cooling. Eaton supplies critical electrical infrastructure — switchgear, busways, power distribution units, uninterruptible power supplies, and now liquid cooling solutions — from the "grid-to-chip."
Emerging Trends
These stocks are trading at the 30-week CAPR highs with a ByteTrend Score of less than 5. They don’t have to be in an uptrend, just emerging. All charts shown are CAPR rebased to 100.
| Name | Annual Vol 30w | Mkt Cap $Bn | Value | Growth |
| Intel Corporation | 67 | 312 | OV | Neg |
| The Toronto-Dominion Bank | 15 | 168 | FV | High |
| GSK plc | 33 | 117 | FV | Med |
| Bank of Montreal | 16 | 102 | OV | Good |
| América Móvil, S.A.B. de C.V. | 27 | 82 | FV | High |
| Vale S.A. | 25 | 73 | OV | Neg |
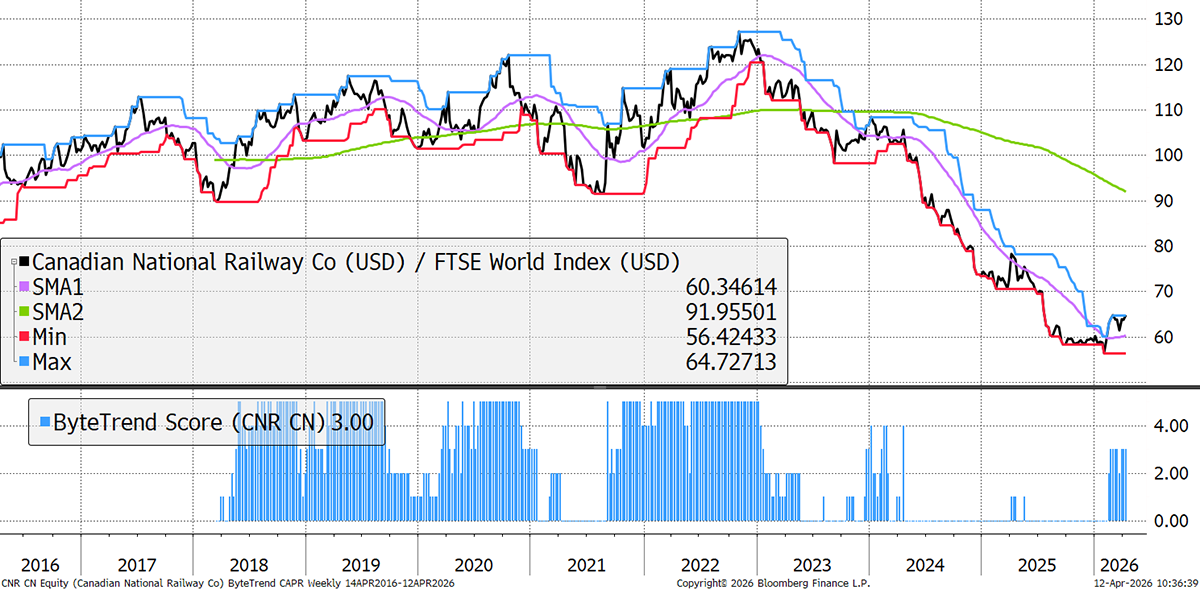
| Canadian National Railway | 21 | 67 | FV | Low |
| Digital Realty Trust, Inc. | 24 | 65 | FV | High |
| Macquarie Group Limited | 23 | 58 | OV | Med |
| BASF Se | 30 | 57 | OV | Neg |
| Ambev S.A. | 23 | 50 | Val | Good |
Canadian National Railway
CNR had been under pressure due to a multi-year freight recession, U.S. tariffs on Canadian goods (steel, lumber, autos), and soft volumes in some segments. However, it has rebounded on signs of operational improvement and defensive capital returns. It’s a slow grower but a unique hard asset.
Weakening
These stocks are trading at the 30-week CAPR lows with a ByteTrend Score above 0. They are weakening trends but not yet downtrends. All charts shown are CAPR rebased to 100.
| Name | Annual Vol 30w | Mkt Cap $Bn | Value | Growth |
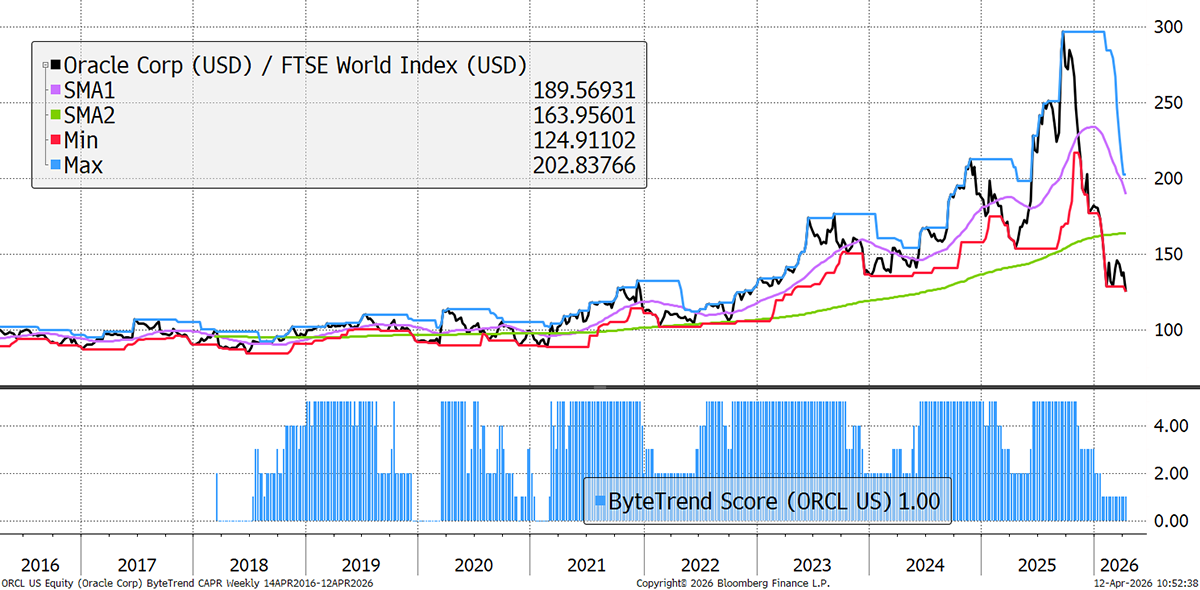
| Oracle Corporation | 45 | 397 | OV | Good |
| Palantir Technologies Inc. | 51 | 293 | OV | High |
| International Business Machines | 34 | 216 | OV | High |
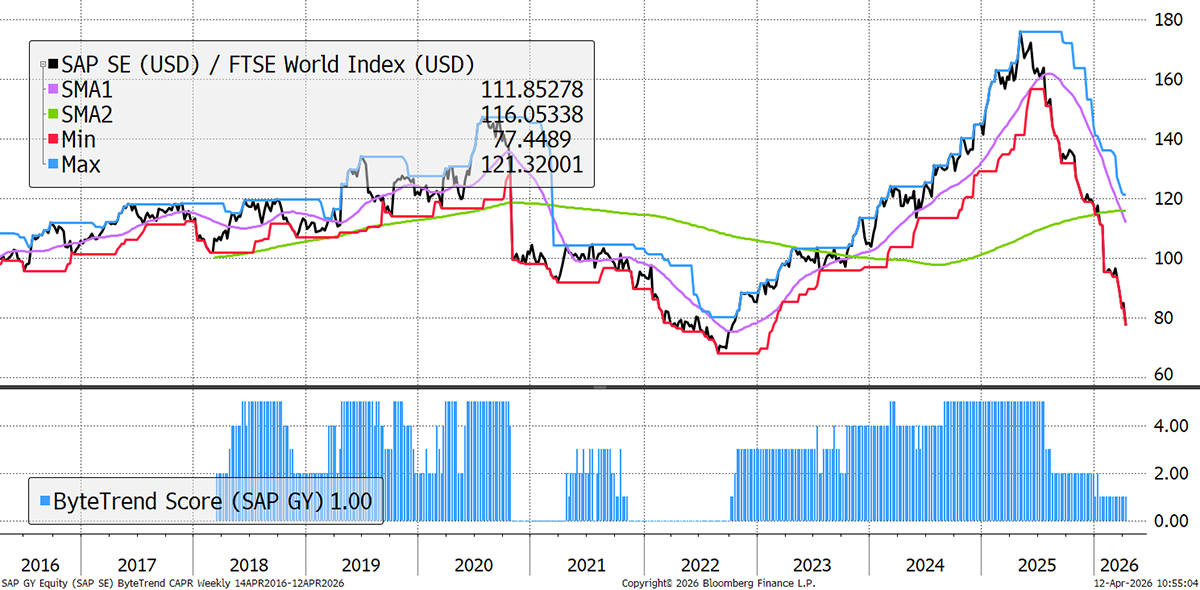
| SAP SE | 28 | 191 | FV | High |
| Intuitive Surgical, Inc. | 39 | 160 | FV | High |
| Shopify Inc. | 53 | 145 | Val | High |
| Bharti Airtel Limited | 19 | 115 | OV | High |
| The Progressive Corporation | 22 | 114 | FV | High |
| Xiaomi Corporation | 30 | 102 | FV | High |
| Cadence Design Systems, Inc. | 31 | 72 | FV | Good |
| Cintas Corporation | 23 | 70 | OV | Good |
| TransDigm Group Incorporated | 25 | 68 | OV | High |
| DoorDash, Inc. | 48 | 66 | Val | High |
| Robinhood Markets, Inc. | 60 | 62 | OV | High |
| Cloudflare, Inc. | 57 | 59 | OV | High |
Oracle
The main reason for ORCL’s weakness revolves around concerns over the massive costs of chasing the AI boom, rather than weak fundamentals. CapEx was raised from $15bn to $50bn for this year, and cash is burning as a result.
SAP
SAP, Europe’s accounting software giant, is weak, which primarily stems from disappointing cloud momentum signals and perceived lagging positioning in the AI era. The space creates both winners and losers.
Bear Trends
These stocks are trading at the 30-week CAPR lows with a ByteTrend Score of 0. They are in a downtrend. All charts shown are CAPR rebased to 100.
| Name | Annual Vol 30w | Mkt Cap $Bn | Value | Growth |
| Microsoft Corporation | 24 | 2754 | FV | Med |
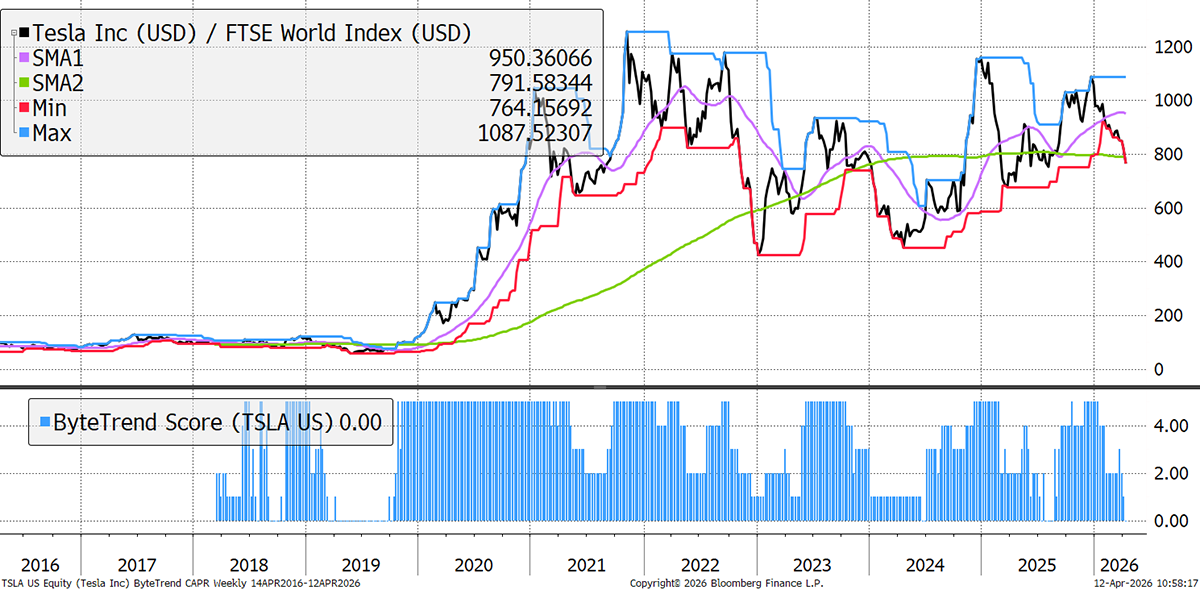
| Tesla, Inc. | 32 | 1309 | OV | Neg |
| Visa Inc. | 17 | 587 | FV | Med |
| Tencent Holdings Limited | 25 | 582 | Val | High |
| Mastercard Incorporated | 20 | 445 | FV | Good |
| AbbVie Inc. | 21 | 368 | OV | Neg |
| Reliance Industries Limited | 18 | 196 | FV | Good |
| The Walt Disney Company | 20 | 176 | Val | High |
| Abbott Laboratories | 21 | 174 | FV | Med |
| Salesforce, Inc. | 41 | 155 | Chp | High |
| QUALCOMM Incorporated | 32 | 137 | Val | Med |
| Danaher Corporation | 33 | 134 | FV | Neg |
| Stryker Corporation | 22 | 130 | FV | Good |
| Sony Group Corporation | 31 | 125 | OV | Good |
| Medtronic plc | 21 | 112 | FV | Low |
| Accenture plc | 32 | 110 | Val | Med |
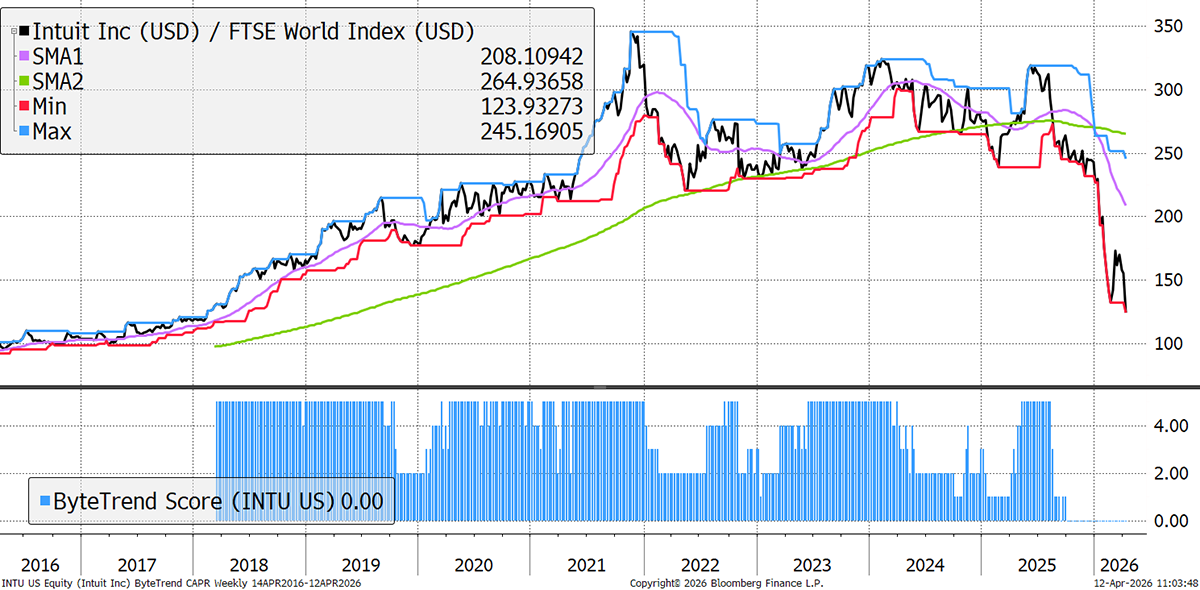
| Intuit Inc. | 53 | 98 | Chp | Good |
| Adobe Inc. | 35 | 92 | Chp | Good |
| Boston Scientific Corporation | 36 | 92 | Val | High |
| ServiceNow, Inc. | 50 | 87 | Chp | High |
| Automatic Data Processing, Inc. | 25 | 76 | Val | Good |
| Synopsys, Inc. | 46 | 75 | FV | Med |
| Aon plc | 20 | 67 | FV | Med |
| NIKE, Inc. | 37 | 63 | FV | Neg |
| Nintendo Co., Ltd. | 43 | 60 | FV | Neg |
| Infosys Limited | 26 | 56 | FV | Good |
| Hindustan Unilever Limited | 17 | 54 | FV | Med |
| Volkswagen AG | 28 | 52 | Val | Neg |
| Zoetis Inc. | 30 | 52 | Val | Good |
Tesla
TSLA has seen zero sales growth for three years, yet still trades on 12x sales. There’s also the idea that TSLA fans are preparing for the SpaceX IPO, which will steal the limelight.
Intuit
Like SAP and others in the software space, the main issue is the derating as the market questions the long-term sustainability of software’s moat. It is brutal.
GTI 200 Spreadsheet
We are pleased to share the GTI 200 spreadsheet. Download the spreadsheet below to view the CAPR and local currency scores, and more, for the world’s largest 200 stocks. Have a look at the different groups and the main list “All stocks”. The Insights tab is interesting, and don’t forget to expand the columns by clicking on the “+” at the top of the page if you want to see more trend data.
Outlook
The energy market has priced in a short war, and the risk is that this is wrong. The market was optimistic last week in the run-up to peace talks, but they have broken down, and the Straits have been blockaded by both Iran and the USA. In April, we will start to see more evidence of real shortages in oil-related products, which could turn things back into bear mode. But if the dollar remains weak, financial markets may prove more resilient than currently expected.
Thanks for reading GTI.


