Consumer Weakness


Issue 23;
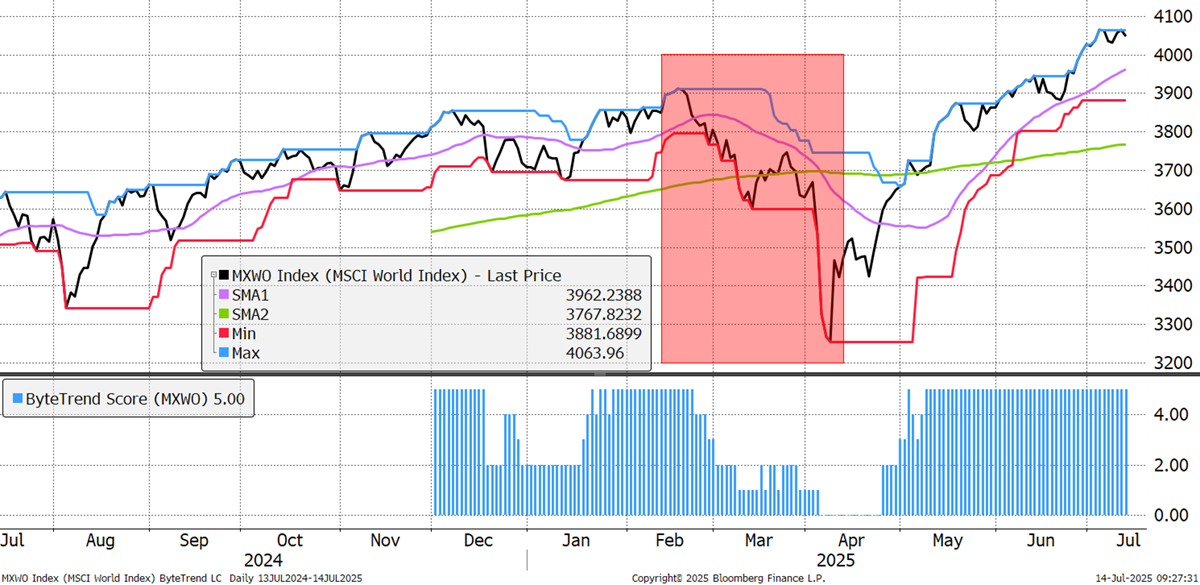
The World Index looks strong on the surface, but tariffs are back on the agenda. In February, the market eased back six weeks ahead of Trump’s tariffs announcement, as highlighted. In other words, the index was already below the 200-day moving average when the news came. This time, the tariff news comes from a stronger technical position. Perhaps the market is not concerned because it’s a tactic rather than a policy. The risk is that this time, Trump is serious.
World Index – Developed Markets – Daily
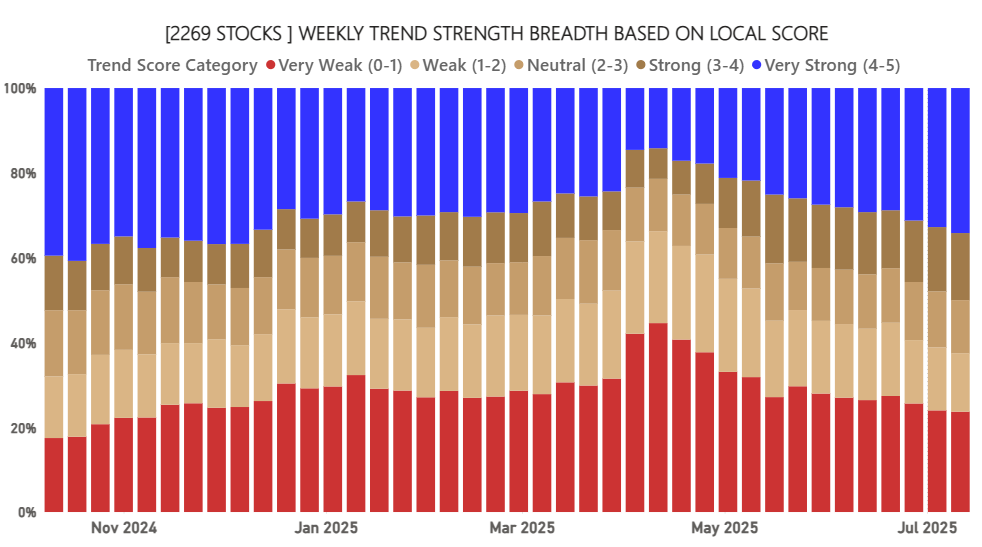
Breadth improves again for the 13th week in a row. This is bullish.
ByteTrend: Weekly Breadth Signal – Local Currency
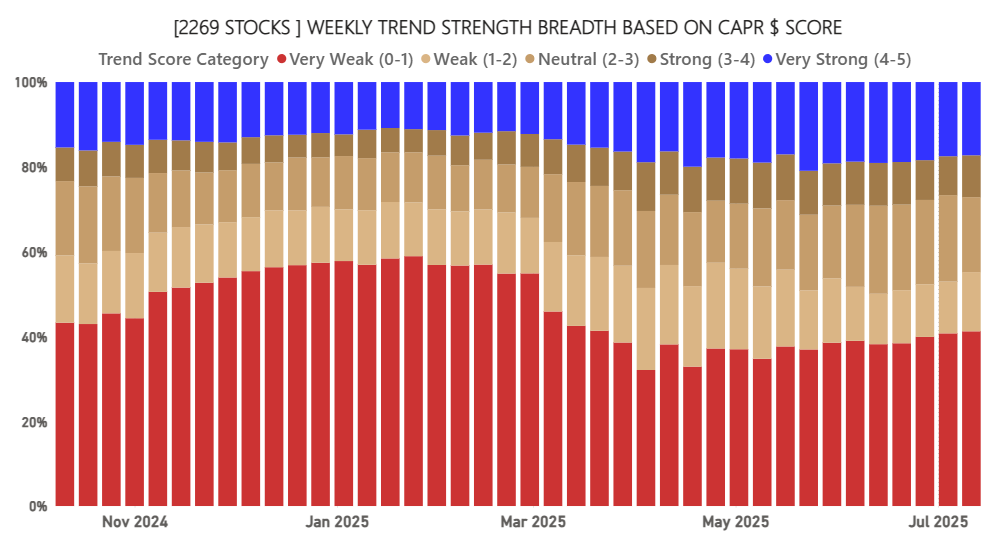
But on a CAPR basis, breadth gives a different picture. Once again, the leadership is thin, with many more stocks underperforming the World Index (red) than outperforming it (blue). This large-cap dominance is a sign of the times and reminds us that the large stocks are still hanging in there, although less so than pre-March.
ByteTrend: Weekly Breadth Signal - CAPR
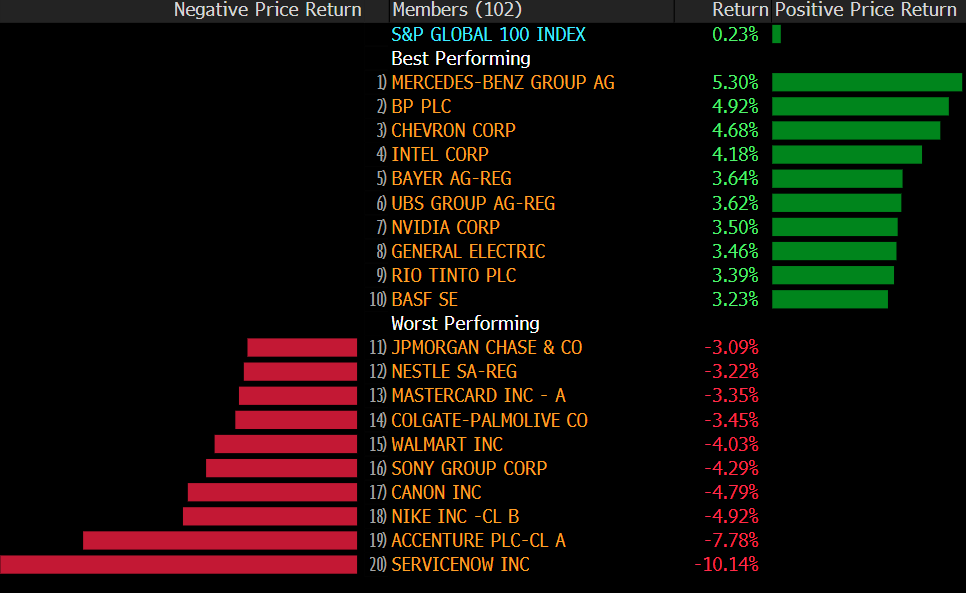
Leaders and Laggards
Last week’s leaderboard saw a bounce in energy and mining. This is related to the market’s renewed preference for hard assets. Rio Tinto is worth a closer examination. The laggards include regulars on the bear board in recent weeks, such as Nike, Colgate, and Accenture. It is noticeable that MasterCard features in this week’s Weakening Trend list.
Developed Markets Leaders and Laggards
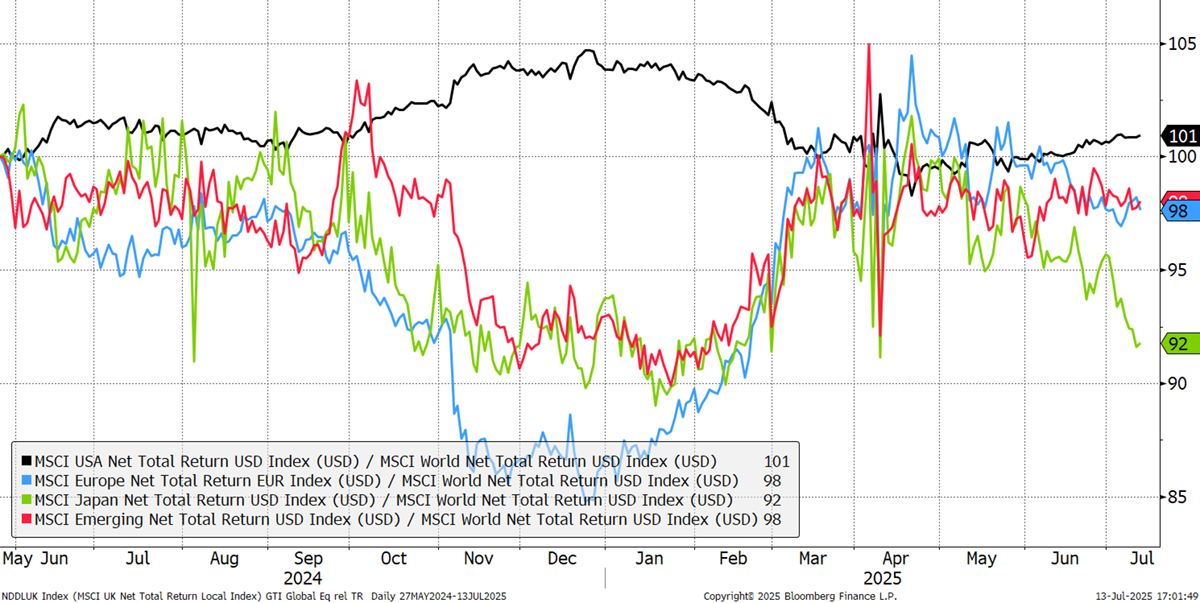
The regional CAPR chart sees Japan sliding behind while other markets are broadly neutral. The Japanese market has a ByteTrend Score of 5, but the yen is sliding again. The good news hidden in there is that a weak yen is supportive of global equities in general.
CAPR: Europe, USA, Emerging Markets and Japan - Past Year
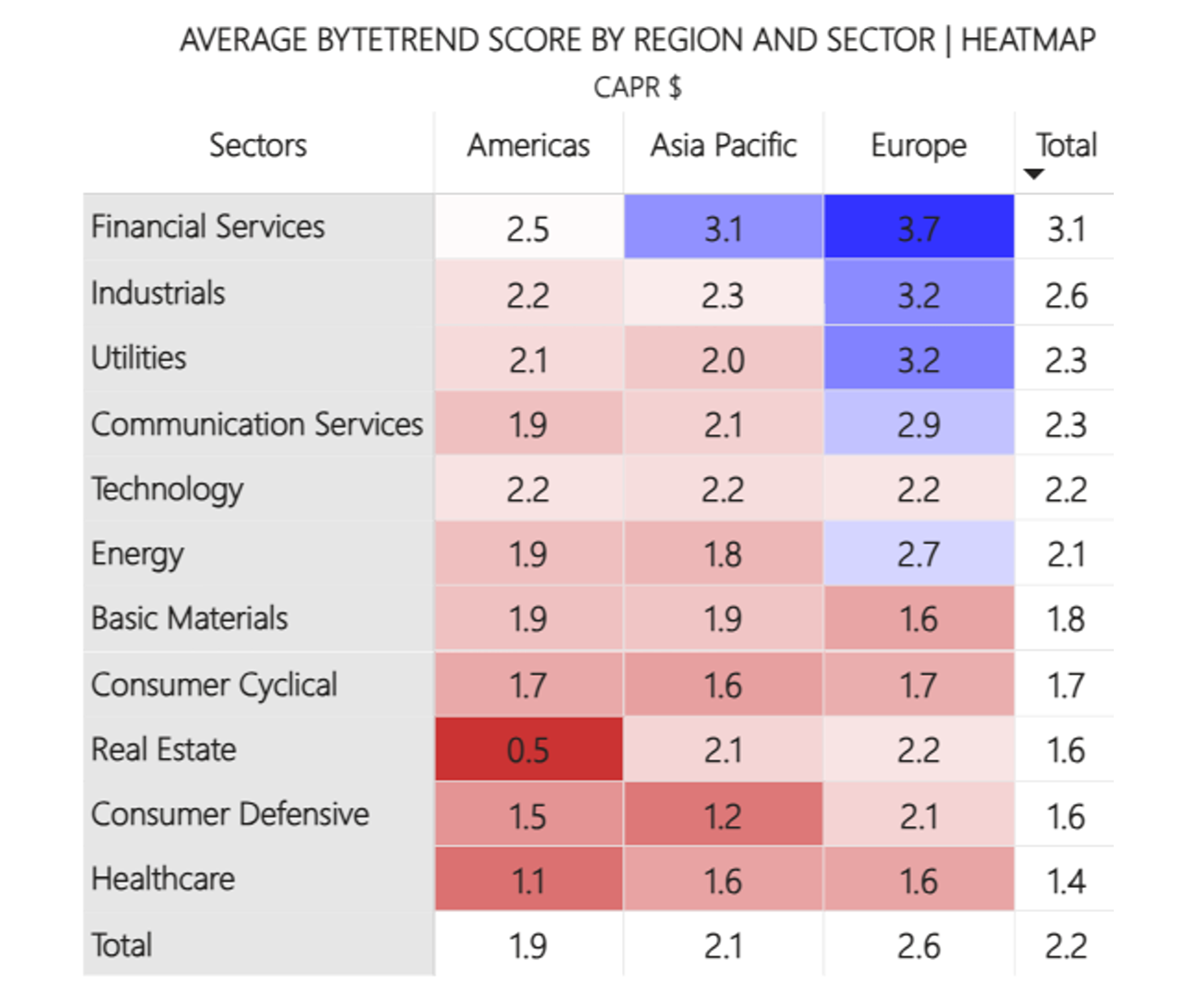
The world matrix still sees European financials in the lead and US real estate in the doghouse. Technology is down a notch while energy is stronger than last week. Financials are by far the strongest global sector and dominate this week’s Leading Trends. The consumer stocks remain weak.
Average ByteTrend Score by Region and Sector Heatmap - CAPR
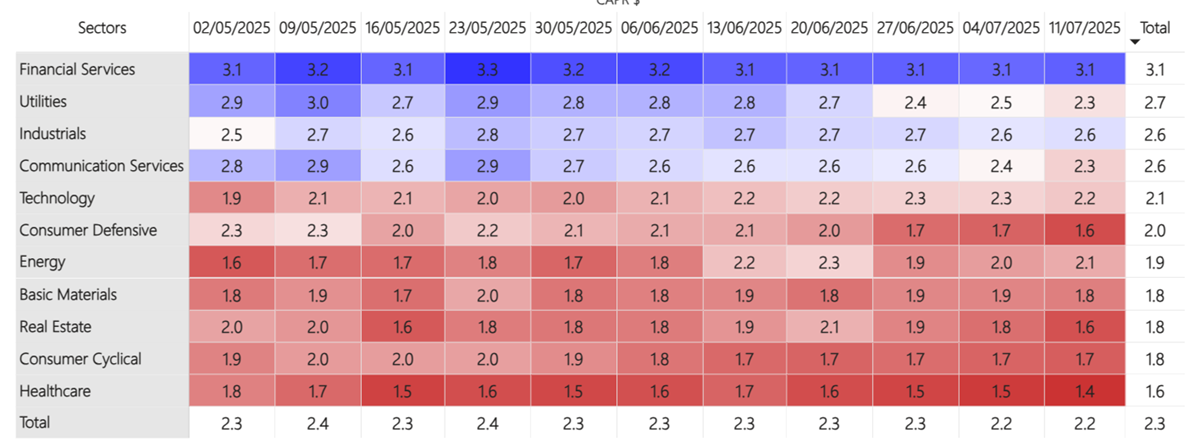
The global sector changes are shown over the last ten weeks. Energy is quietly improving and is one to watch. But we continue to see deterioration in consumer stocks and healthcare. These supposedly safe stocks have taken a beating this year, and it’s not over yet.
Sector Dynamics
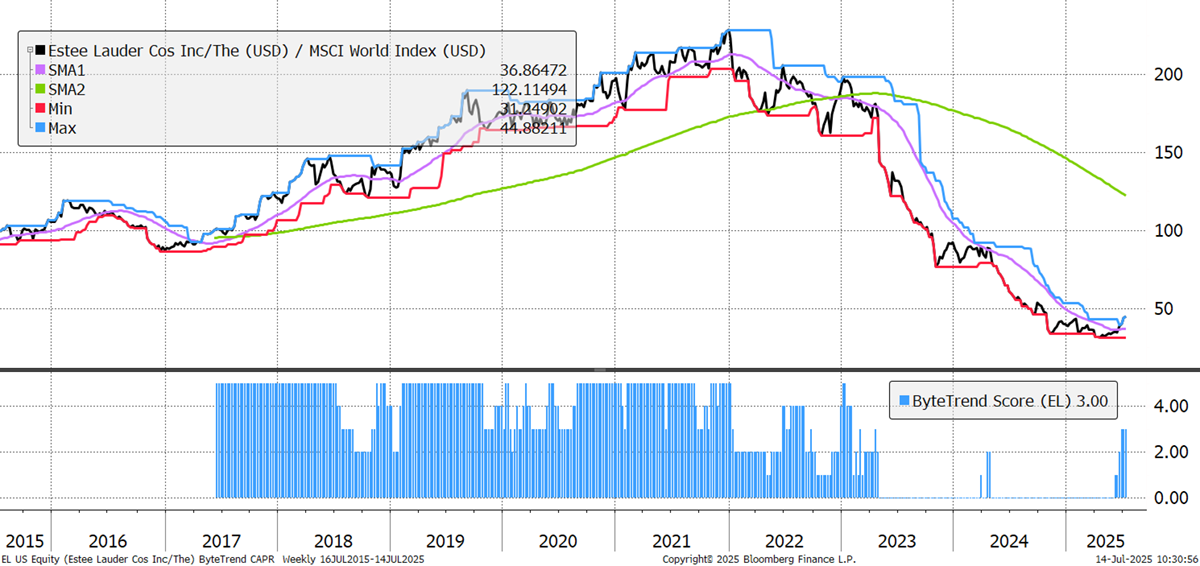
The one exception might be Estee Lauder, which is too small to feature in the Top 200, but this chart can’t be ignored.
Estee Lauder
Leading Trends with New Highs
These stocks are trading at the 30-week CAPR highs with a ByteTrend Score of 5. All charts shown are CAPR rebased to 100.
| Ticker | FX | Name | Score CAPR | % Dev from CAPR 30W High | % Dev from CAPR 30W Low | Annual. Vol 30w | MCap Bn USD | Sector | Industry |
|---|---|---|---|---|---|---|---|---|---|
| NVDA | USD | NVIDIA Corporation | 5 | 0 | 44 | 57 | 4024 | Tech | Semis |
| MSFT | USD | Microsoft Corporation | 5 | 0 | 19 | 27 | 3741 | Tech | Software Infra |
| AVGO | USD | Broadcom Inc. | 5 | 0 | 54 | 55 | 1291 | Tech | Semis |
| 2330 | TWD | Taiwan Semiconductor Manufacturing Company Limited | 5 | 0 | 24 | 25 | 975 | Tech | Semis |
| AIR | EUR | Airbus SE | 5 | 0 | 23 | 30 | 169 | Indust | Aerospace |
| 660 | KRW | SK hynix Inc. | 5 | 0 | 69 | 43 | 147 | Tech | Semis |
| GEV | USD | GE Vernova Inc. | 5 | 0 | 72 | 54 | 147 | Utility | Renew |
| SAF | EUR | Safran S.A. | 5 | 0 | 38 | 27 | 136 | Indust | Aerospace |
| LRCX | USD | Lam Research Corporation | 5 | 0 | 42 | 48 | 130 | Tech | Semis |
| SAN | EUR | Banco Santander, S.A. | 5 | 0 | 72 | 32 | 125 | Finance | Banks |
| PRX | EUR | Prosus N.V. | 5 | 0 | 49 | 39 | 124 | Comms | Internet |
| KLAC | USD | KLA Corporation | 5 | 0 | 35 | 44 | 122 | Tech | Semis |
| BATS | GBp | British American Tobacco p.l.c. | 5 | 0 | 32 | 25 | 112 | Con Disc | Tobacco |
| RR | GBp | Rolls-Royce Holdings plc | 5 | 0 | 74 | 39 | 111 | Indust | Aerospace |
| COIN | USD | Coinbase Global, Inc. | 5 | 0 | 100 | 82 | 99 | Finance | Exchanges |
| RCL | USD | Royal Caribbean Cruises Ltd. | 5 | 0 | 56 | 53 | 92 | Con Cycl | Trav Serv |
| HOOD | USD | Robinhood Markets, Inc. | 5 | 0 | 136 | 81 | 87 | Tech | Software Infra |
| EMR | USD | Emerson Electric Co. | 5 | 0 | 22 | 31 | 79 | Indust | Ind Mach |
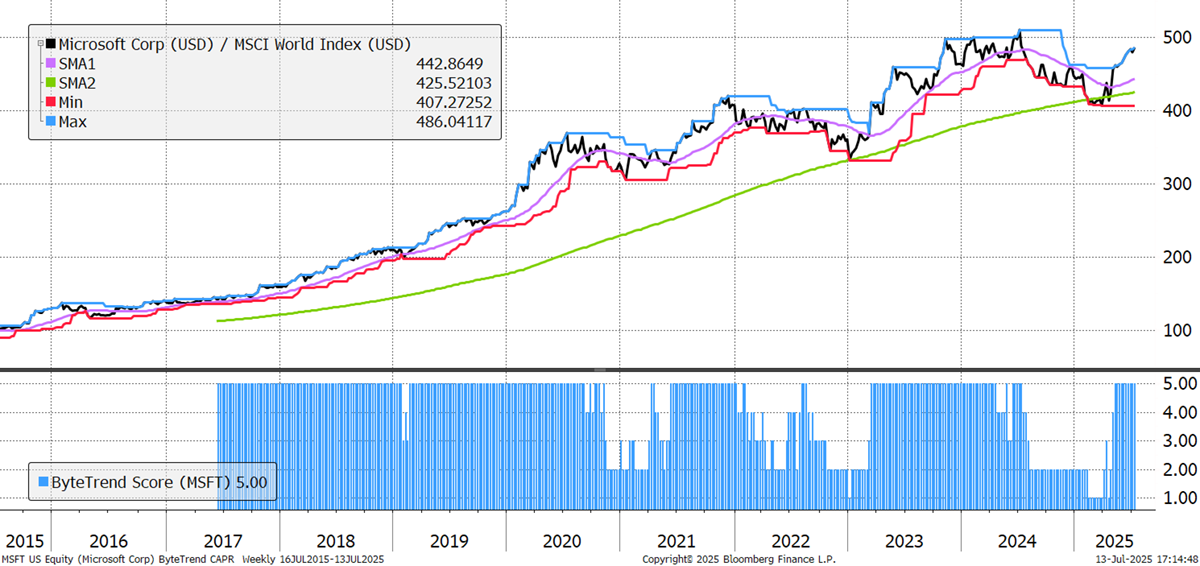
Microsoft’s Cloud business (Azure) is a key driver of its growth, and it’s competing well with Amazon’s Web Services division. Its AI assistant “Copilot” is seeing early success too. The business as a whole has shown consistent mid-teen revenue growth, backed by incredible margins thanks to high switching costs for its customers, and free cash flow per share has risen strongly over a very long period. It is one of the world’s great companies, but when valued at 14x sales, the highest since the tech bubble in 2000, investors are assuming this all continues for a very long time. Above all, notice the scale. The excess return since 2020 is fairly modest.
Microsoft
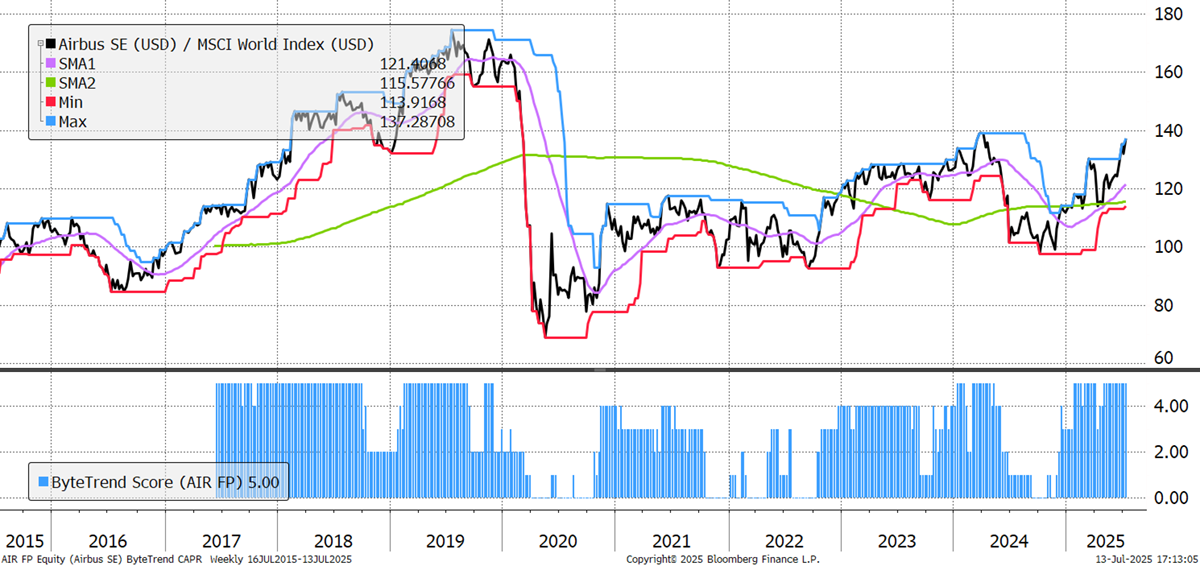
Airbus and Boeing run a long-term duopoly, which is typically good for profits. There is a growing competitive threat from China, but Boeing has essentially left the field clear for Airbus to succeed in the last few years. Airbus is starting to capitalise, seeing healthy growth for the last ten quarters, with healthy returns on capital and a return to a net cash position after the balance sheet got hit during the pandemic. Great chart for a sustained recovery.
Airbus
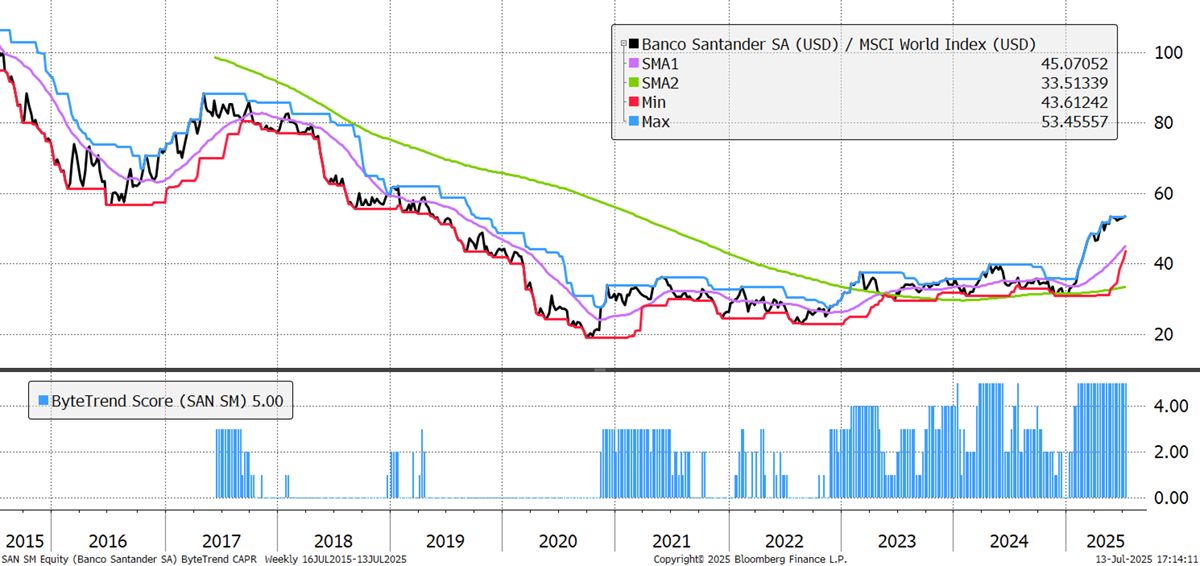
European financials have been strong, and 170-year-old Banco Santander is a good example, breaking out against the World Index since January. It reported record profits in Q1 of this year with record fee income and lower costs, announced a big buyback and grew its dividend.
Banco Santander
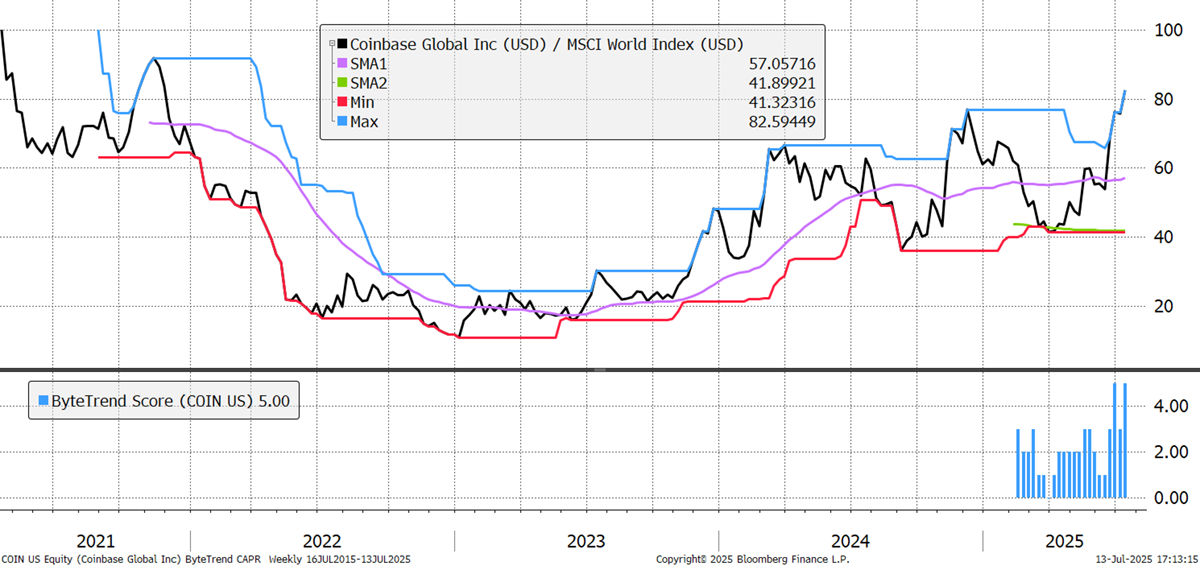
Coinbase is the go-to stock for crypto, just like Newmont is for gold. It is at the heart of custody, trading, staking, and embracing new technologies. It was listed in 2021 and hasn’t had a good start, but it’s now a leader in its field. It even receives 50% of the revenues from Circle’s stablecoin issuance.
Coinbase
There are 67 additional bear trends available to GTI Premium clients. The leaders are dominated by financials, mainly banks. Precious metals show up alongside copper. Internet stocks barely feature this week.
Emerging Trends
These stocks are trading at the 30-week CAPR highs with a ByteTrend Score of less than 5. They don’t have to be in an uptrend, just emerging. All charts shown are CAPR rebased to 100.
| Ticker | FX | Name | Score CAPR | % Dev from CAPR 30W High | % Dev from CAPR 30W Low | Annual. Vol. 30w | MCap Bn USD | Sector | Industry |
|---|---|---|---|---|---|---|---|---|---|
| AMD | USD | Advanced Micro Devices, Inc. | 4 | 0 | 44 | 51 | 237 | Tech | Semis |
| TXN | USD | Texas Instruments Incorporated | 3 | 0 | 29 | 37 | 201 | Tech | Semis |
| BA | USD | The Boeing Company | 3 | 0 | 37 | 48 | 171 | Indust | Aerospace |
| BMO | CAD | Bank of Montreal | 3 | 0 | 9 | 18 | 82 | Finance | Banks |
| CM | CAD | Canadian Imperial Bank of Commerce | 4 | 0 | 19 | 17 | 68 | Finance | Banks |
| FCX | USD | Freeport-McMoRan Inc. | 4 | 0 | 31 | 51 | 67 | Materials | Copper |
| BMW | EUR | Bayerische Motoren Werke AG | 3 | 0 | 20 | 33 | 60 | Con Cycl | Automakers |
| IFX | EUR | Infineon Technologies AG | 3 | 0 | 30 | 44 | 58 | Tech | Semis |
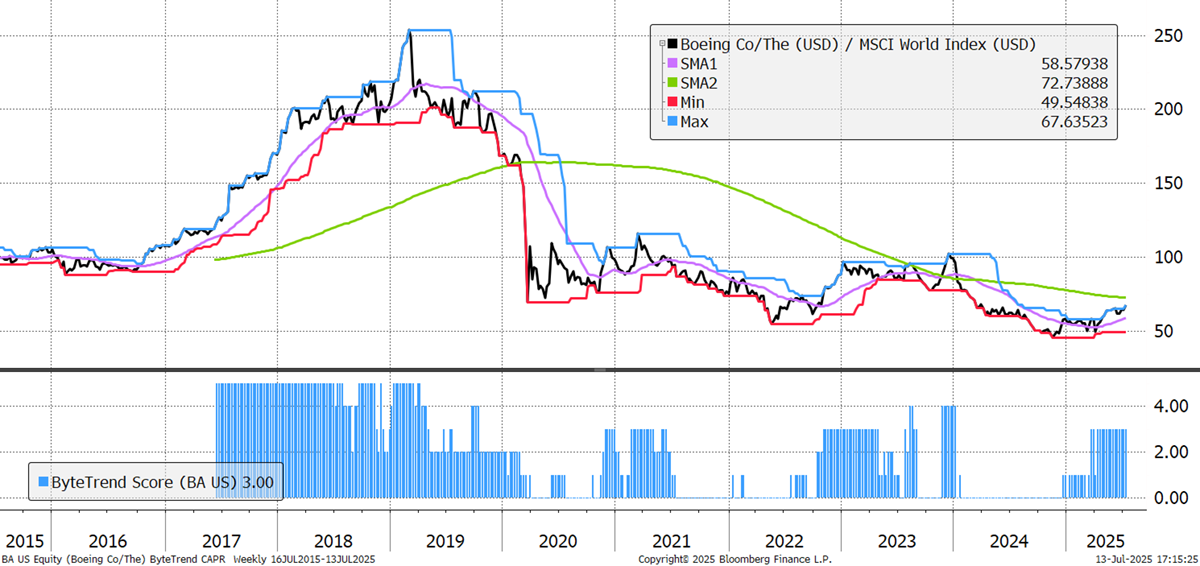
Boeing’s chart looks very different to Airbus's, but after a very difficult few years, it is starting to show some strength of its own. This is more of a turnaround story, as a series of accidents have created disastrous PR for the historic plane manufacturer, exposing a culture that was lax on safety and quality, and high on cutting corners. Naturally, all energy is now going into fixing this, and investors are beginning to sense green shoots. Sales are falling, and it’s currently loss-making. However, its backlog grew in Q1, with rising deliveries and improving manufacturing throughput all gaining attention.
Boeing