
Energy Slumps


Issue 13;
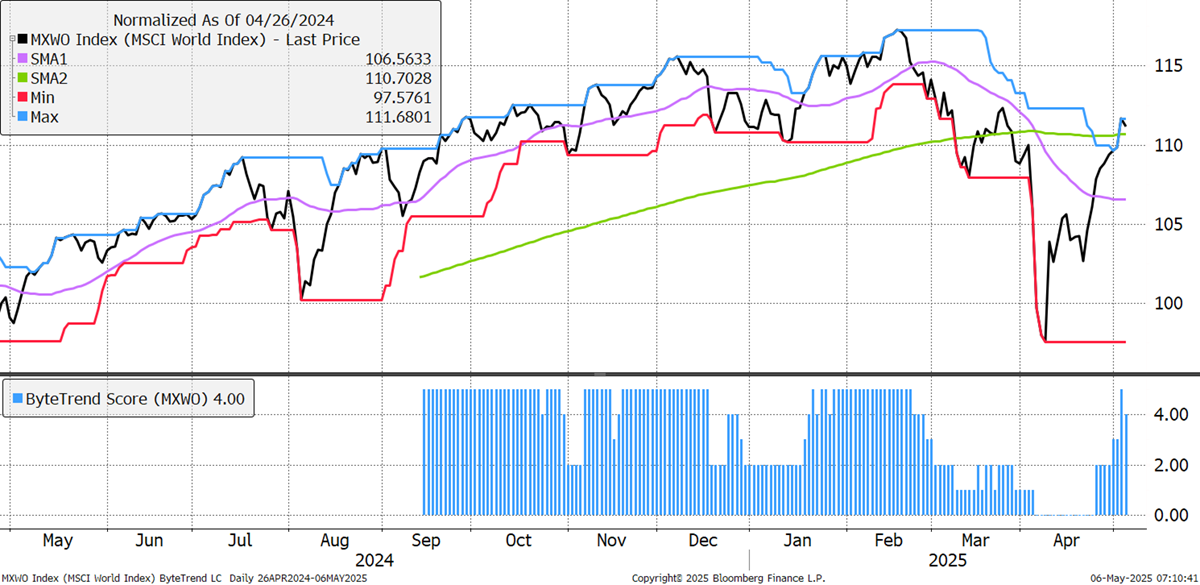
The World ByteTrend Score is a 4, as the 30-day moving average remains negatively sloping. When measured in US dollars, things look healthy.
World Index – Developed Markets – Daily in USD
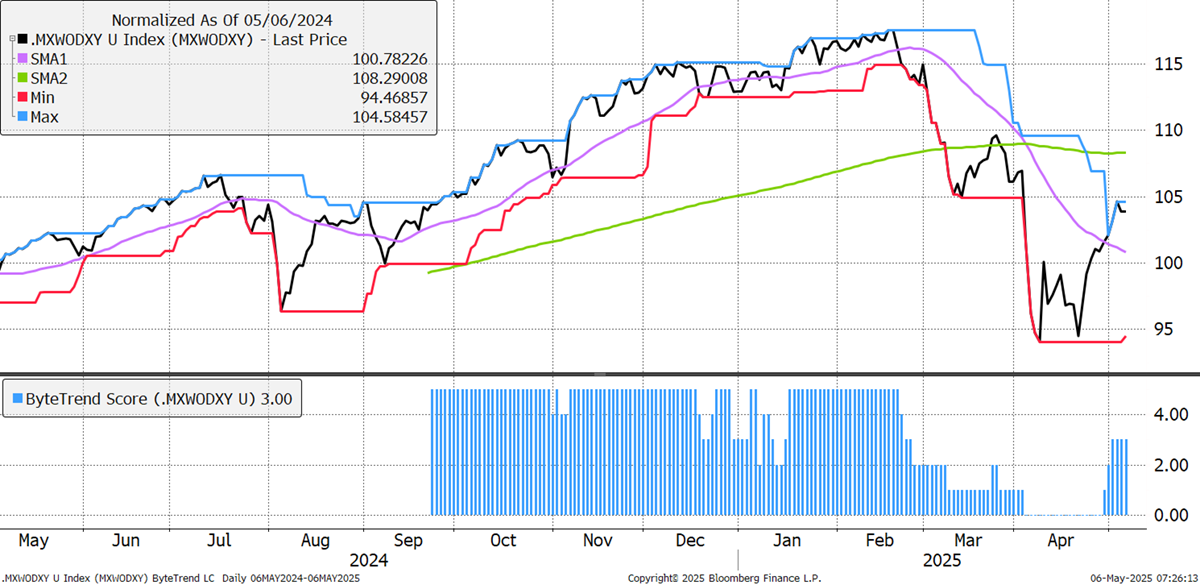
However, with the weak dollar, it must be stressed that most of the world doesn’t see things that way. In a global non-dollar currency basket (average of EUR, JPY, GBP, etc.), the ByteTrend Score is a 3, and still well below the 200-day moving average. It is important for investors to understand that a weak dollar flatters the world index when measured in dollars.
World Index – Developed Markets – Daily – in Global non-Dollar Currency Basket
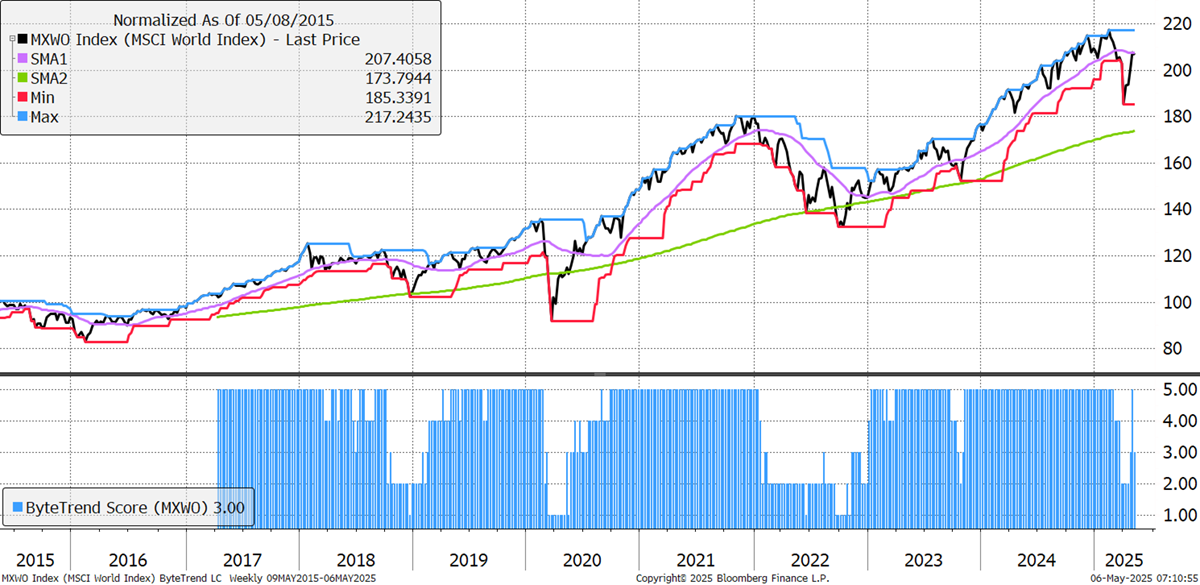
On the weekly chart, the ByteTrend Score is a 3 as the 30-week moving average is still negatively sloping, and the price is yet to touch the blue 20-week max line.
World Index – Developed Markets - Weekly
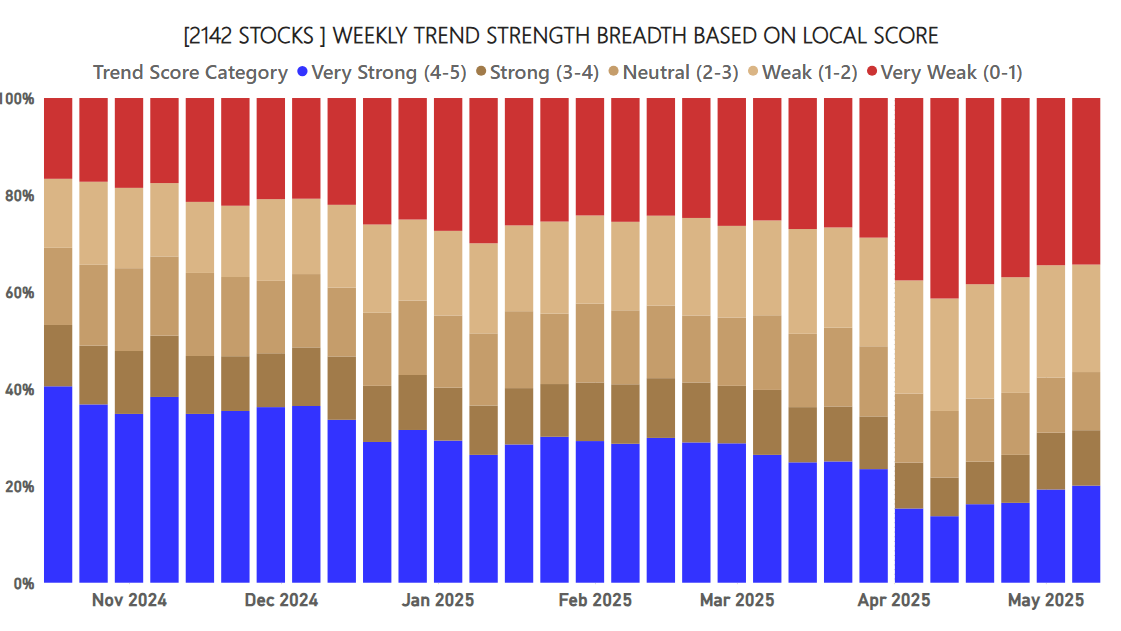
Breadth in local currency has improved slightly, but there are half the number of strong trends (ByteTrend score of 5 in blue) compared to last November. 30% of trends are bear trends (ByteTrend Score of 0 in red), which is a number that has been slowly shrinking in this recovery.
ByteTrend: Weekly Breadth Signal
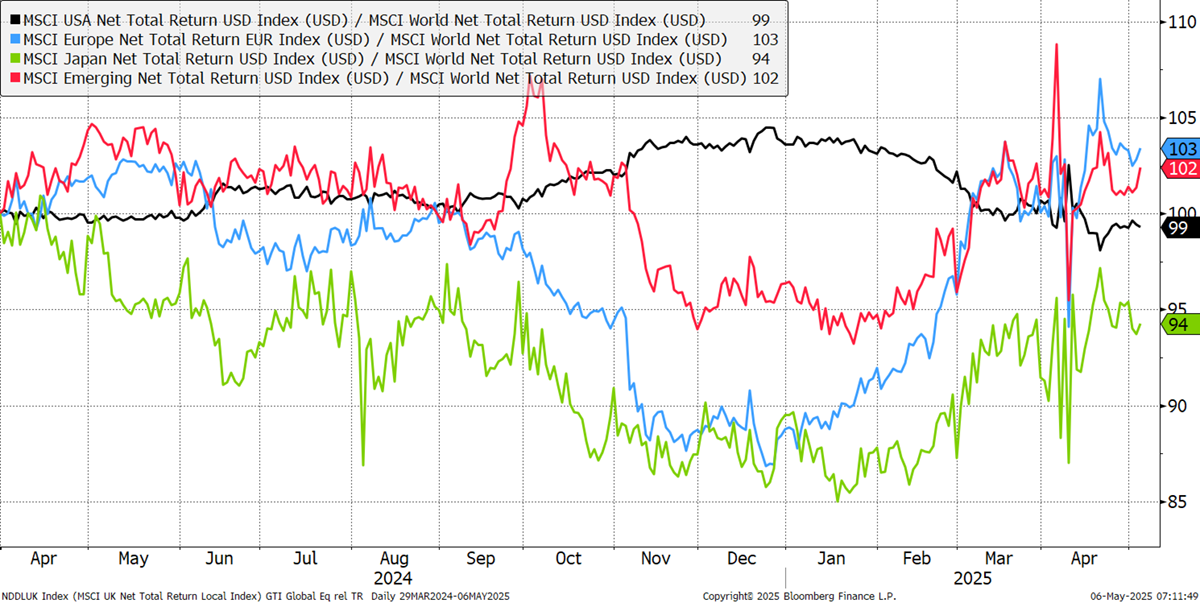
The regional CAPR chart saw the US market (black) turn down last week, with EM (China) and Europe the strongest.
Europe, USA, Emerging Markets, Japan CAPR
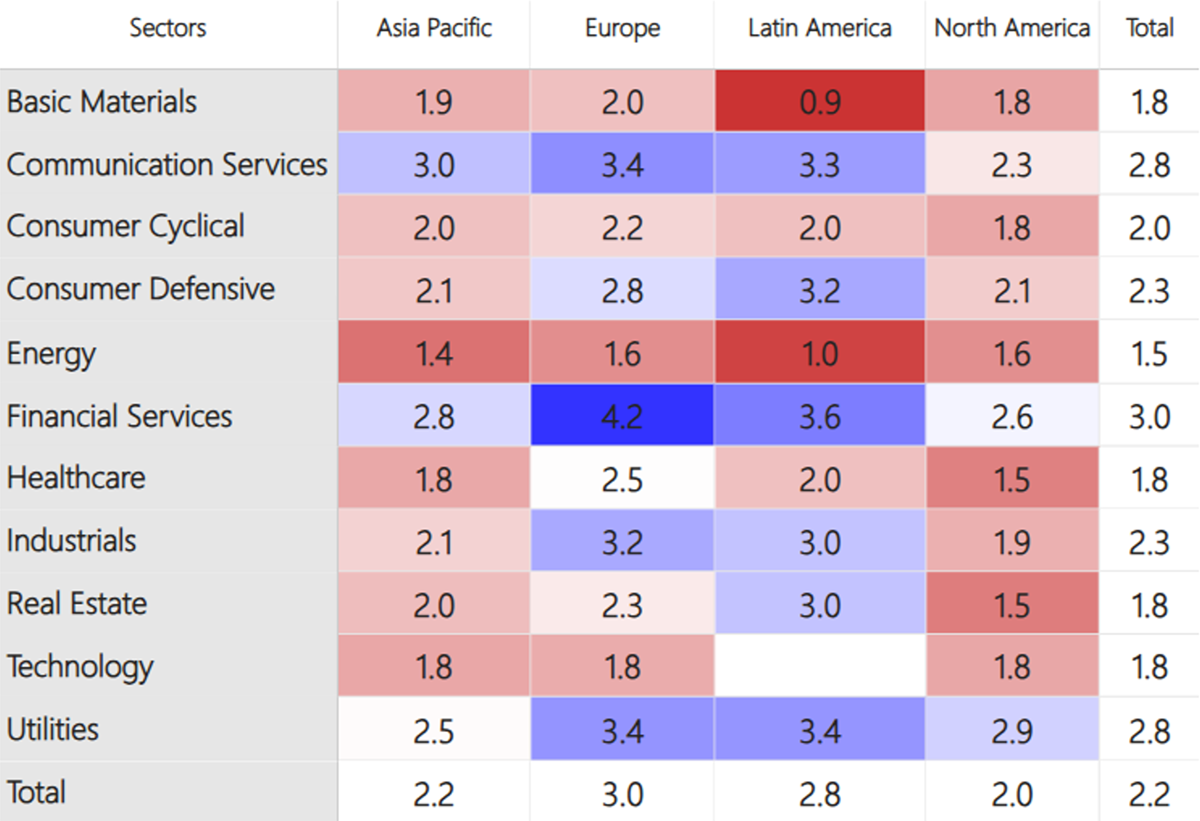
At the stock level, the ByteTrend average scores are the highest in Europe and the weakest in the US. Financial services remains the strongest sector, followed by utilities. Real estate, materials, and technology are weak, but energy is the weakest.
Average ByteTrend Score by Region and Sector Heatmap - CAPR
Overall, aerospace and software are shining through, yet on the bear side, energy and logistics are in a slump.
Leading Trends with New Highs
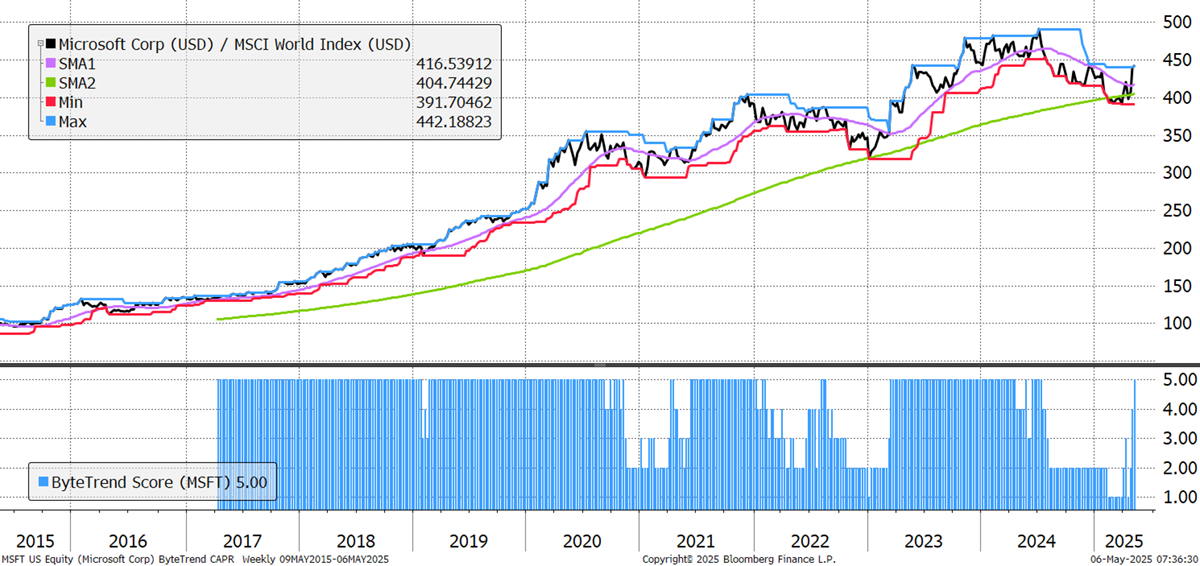
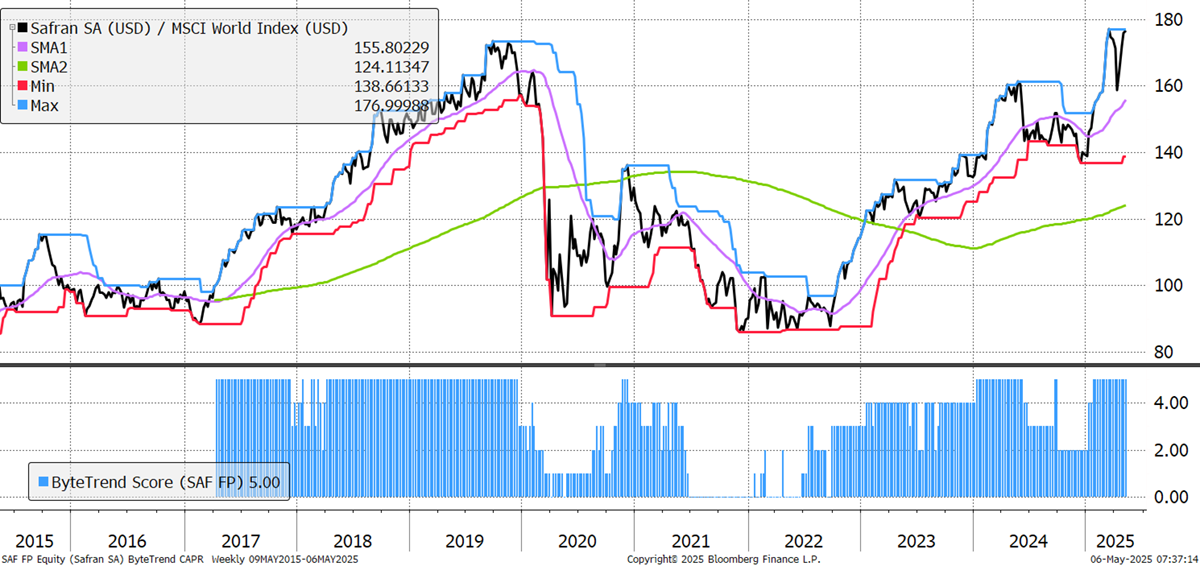
These stocks are trading at the 30-week CAPR highs with a ByteTrend Score of 5. All charts shown are CAPR rebased to 100.
| Ticker | FX | Name | CAPR | Dev | Vol | Cap | Sector | Industry |
|---|---|---|---|---|---|---|---|---|
| MSFT | USD | Microsoft | 5 | 29 | 28 | 3,240.7 | Tech | Software Infra |
| SAP.DE | EUR | SAP | 5 | 83 | 27 | 353.1 | Tech | Software |
| PLTR | USD | Palantir Tech | 5 | 368 | 93 | 292.5 | Tech | Software Infra |
| GE | USD | General Electric | 5 | 106 | 39 | 222.9 | Indust | Aerospace |
| BKNG | USD | Booking | 5 | 70 | 29 | 168.9 | Con Cycl | Trav Serv |
| ALV.DE | EUR | Allianz | 5 | 60 | 18 | 163.9 | Finance | Insurance |
| SAF.PA | EUR | Safran | 5 | 59 | 27 | 114.8 | Indust | Aerospace |
| CRWD | USD | CrowdStrike | 5 | 89 | 50 | 109.9 | Tech | Software Infra |
| 7974.T | JPY | Nintendo | 5 | 79 | 29 | 100.1 | Tech | Gaming |
| ISP.MI | EUR | Intesa Sanpaolo | 5 | 72 | 30 | 96.6 | Finance | Reg Banks |
| RR.L | GBp | Rolls-Royce | 5 | 191 | 40 | 87.2 | Indust | Aerospace |
| RHM.DE | EUR | Rheinmetall AG | 5 | 362 | 49 | 83.7 | Indust | Aerospace |
| FTNT | USD | Fortinet | 5 | 63 | 41 | 83.6 | Tech | Software Infra |
| TDG | USD | TransDigm | 5 | 63 | 26 | 82.7 | Indust | Aerospace |
Microsoft announced good results last week when fears were high about corporate earnings. Revenues were up 22% in constant currency. The Azure cloud services business grew 35% year-over-year, also in constant currency. AI Services contributed 16 percentage points of that overall growth, driven by faster-than-expected capacity availability. While AI was one key driver, the "non-AI" Azure business also outperformed, reminding investors that there’s more to tech than AI. This is the only Magnificent 7 stock with a ByteTrend Score of 5. (Apple 1, NVIDIA 2, Alphabet 3, Amazon 1, Meta 3, Tesla 2)
Microsoft
In the first quarter, new aircraft orders surged by 73% in the US, driven by tariff front-running. Safran’s own good results came a day after that news in late April amidst a wider rebound from the tariff shock. The French aerospace and defence group's adjusted revenue jumped 16.7% YoY to €7.3bn. This was mainly driven by its propulsion division, which reported a 19% growth of €3.7bn on the back of higher civil engine spare parts sales.
Safran
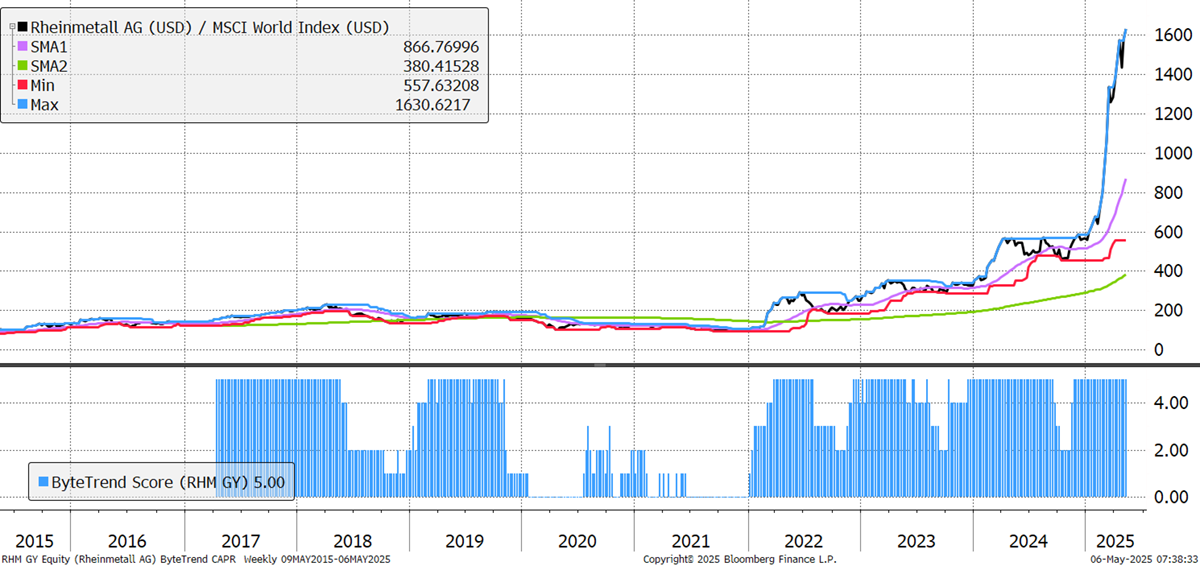
Rheinmetall’s chart is one for the ages, and it’s still going. It fell an incredible 30% on 7 April, but it has clawed it all back and more. Ukraine’s mineral deal with the US is signed, but the direction of European defence spending has changed, and it is a prime beneficiary. Revenue growth has jumped from mid-single-digit levels to 35.9% in 2024, and the share price has accelerated even faster.
Rheinmetall AG
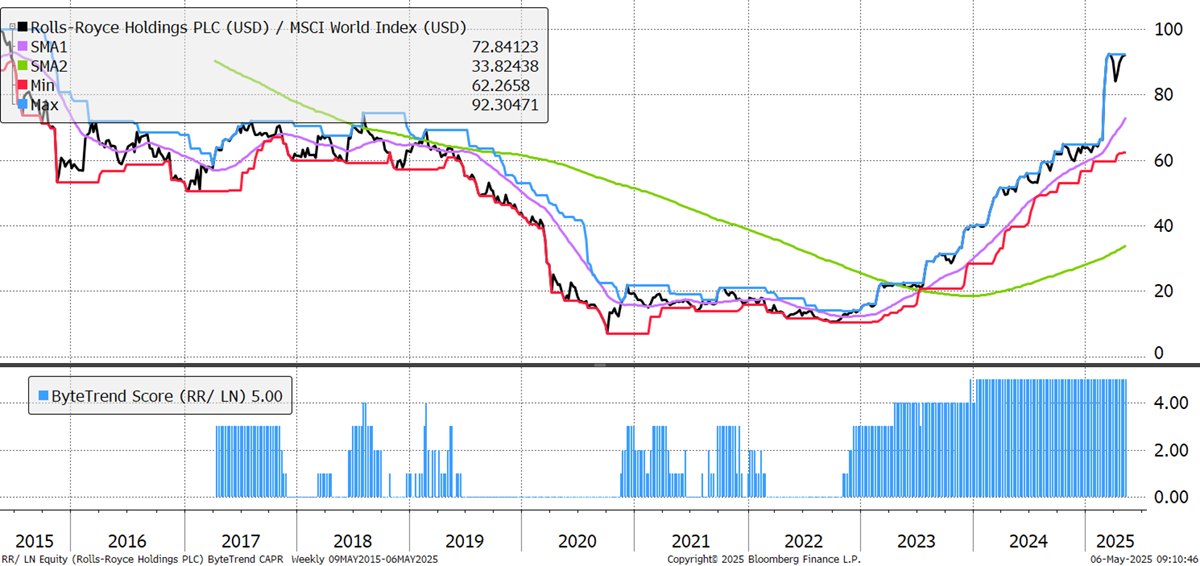
Rolls-Royce fell over 25% after 2 April’s tariff announcements but has regained almost all its lost ground. On 1 May, it said it was sticking to its guidance for FY25 results based on a strong start to the year, which helped the rally. Over £850m of their £1bn buyback program for 2025 is still to be completed this year.
Rolls-Royce
There are 60 additional leading trends with new highs in the GTI universe.
Emerging Trends
These stocks are trading at the 30-week CAPR highs with a ByteTrend Score of less than 5. They don’t have to be in an uptrend, just emerging. All charts shown are CAPR rebased to 100.
| Ticker | FX | Name | CAPR | Dev | Vol | Cap | Sector | Industry |
|---|---|---|---|---|---|---|---|---|
| RELIANCE | INR | Reliance Industries | 4 | 17 | 24 | 230.0 | Energy | O&G Ref |
| UBER | USD | Uber Tech | 4 | 73 | 42 | 178.6 | Tech | Software |
| SCHW | USD | Charles Schwab | 3 | 18 | 33 | 151.2 | Finance | Cap Mkts |
| BA | USD | Boeing | 3 | -1 | 50 | 140.6 | Indust | Aerospace |
| PRX | EUR | Prosus | 4 | 37 | 38 | 106.5 | Comms | Internet |
| DASH | USD | DoorDash | 4 | 79 | 37 | 87.0 | Comms | Internet |
| SE | USD | Sea | 4 | 35 | 44 | 84.4 | Con Cycl | Spec Retail |
| CDNS | USD | Cadence Design | 4 | 39 | 42 | 84.3 | Tech | Software |
| WES | AUD | Wesfarmers | 4 | 37 | 20 | 58.0 | Con Cycl | Home Impr |
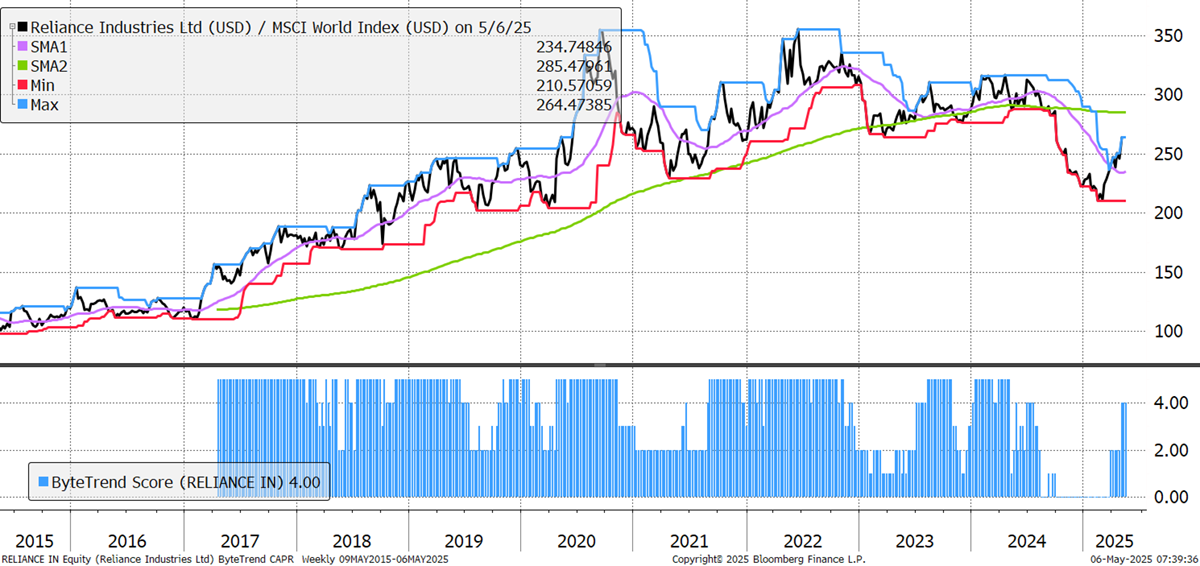
India’s great run ended last year, and Reliance was an early warning signal. But it’s back in the emerging list as 2025 has started well. It stands out from the energy crowd, which is down sharply in recent months. Good results from its oil business in mid-January clearly helped, led by net profit margin expansion, and the diversification into 5G telecoms and retail make it less reliant on the oil price. It now has 170m 5G customers, and the retail division grew EBITDA by 17% YoY.
Reliance Industries
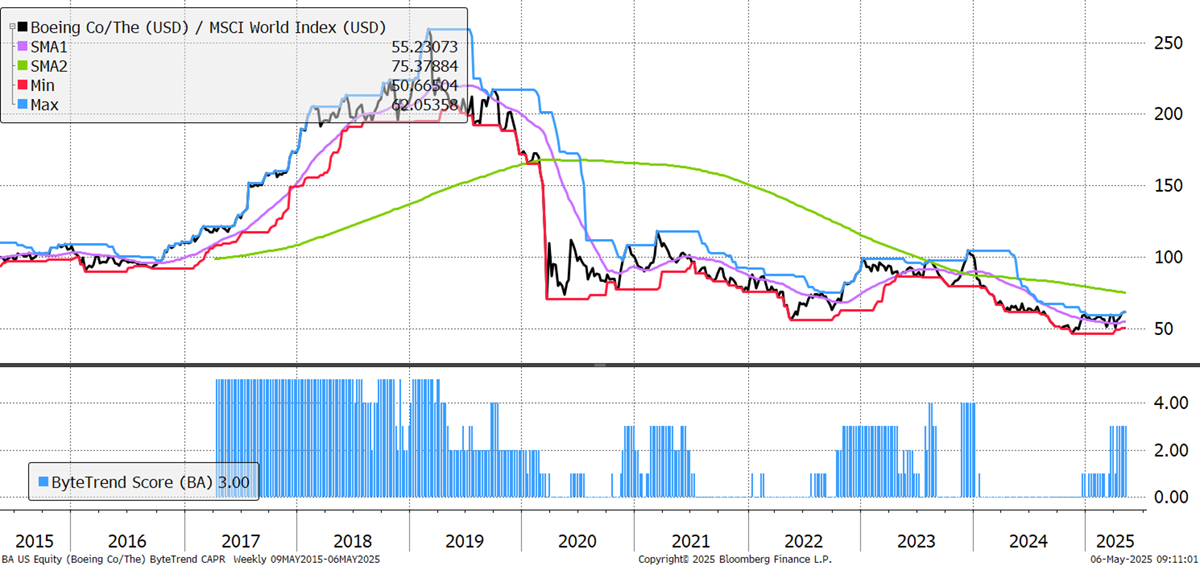
Up 17% in the last ten days and outperforming the world in that time, Boeing appears in the emerging trend list for the second week in a row. This was driven by the same US Durable Goods Orders data released on 24 April that boosted Safran. New orders for manufactured durable goods in the US surged 9.2% month-over-month to $315.7 billion in March 2025, far exceeding market expectations of 2%. The sharp uptick was largely driven by a rush in orders for commercial aircraft, with “nondefense aircraft and parts” up 139%.
Boeing
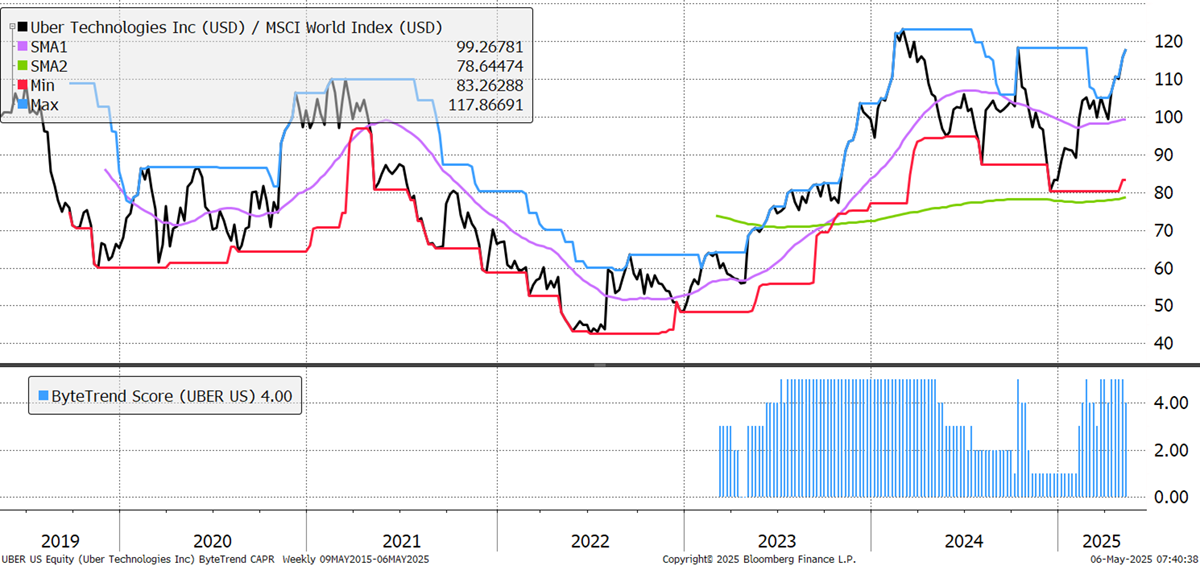
Uber is another tech business that burned cash to gain scale, but it is now maturing. It has turned its profitability around, with six quarters of positive returns on capital and a record ROIC of 26.8% in the most recent one. Revenues per (full-time office) employee are high at $1.4m and growing.
Uber Technologies
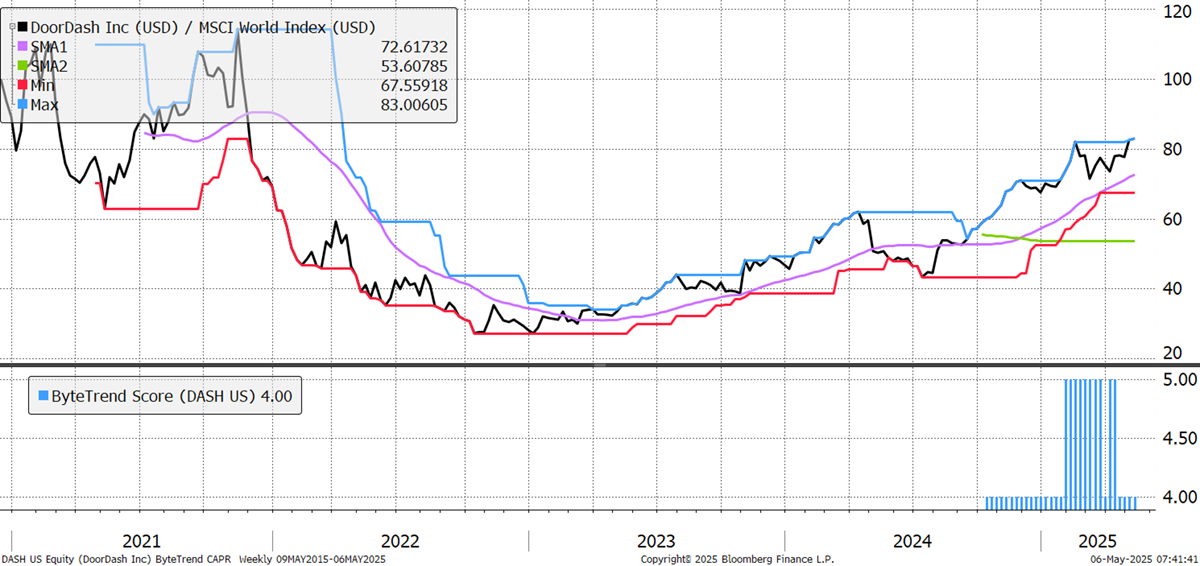
DoorDash is buying Deliveroo for £2.9bn (180p per share). Their markets do not overlap, so the goal is to jumpstart their presence in new markets and boost Deliveroo with their own operating model. DoorDash is the largest player in the US food delivery market and claims to have about 90% of all major restaurant brands in the country on its platform. It will report results today.
DoorDash
There are 48 additional emerging trends in the GTI universe.
Weakening
These stocks are trading at the 30-week CAPR lows with a ByteTrend Score above 0. They are weakening trends but not yet downtrends. All charts shown are CAPR rebased to 100.
| Ticker | FX | Name | CAPR | Dev | Vol | Cap | Sector | Industry |
|---|---|---|---|---|---|---|---|---|
| AAPL | USD | Apple | 1 | 11 | 33 | 2,987.8 | Tech | Cons Elec |
| XOM | USD | Exxon Mobil | 1 | 4 | 25 | 446.8 | Energy | O&G Int |
| CVX | USD | Chevron | 1 | -10 | 28 | 236.7 | Energy | O&G Int |
| BX | USD | Blackstone | 1 | 14 | 40 | 177.7 | Finance | Asset Man |
| COP | USD | ConocoPhillips | 1 | -15 | 33 | 110.8 | Energy | O&G Exp |
| PETR3.SA | BRL | Petrobras | 1 | 26 | 29 | 70.9 | Energy | O&G Int |
| MSI | USD | Motorola | 2 | 31 | 28 | 67.6 | Tech | Comms |
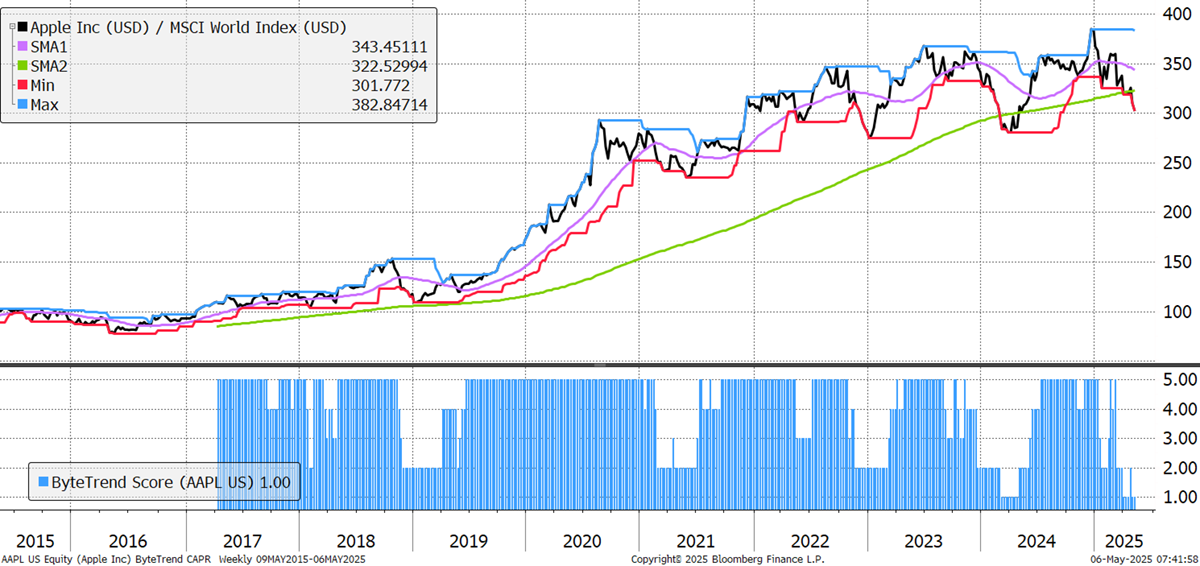
By the looks of things, Apple’s great run ended in 2020, as it hasn’t outperformed since the autumn of that year. That’s not how it feels, but it’s true. It has retreated to a CAPR score of 1 in just a few months; only the 200-week moving average remains intact. Its supply chains are hyper-efficient, large, and international, and the tariff war has turned them from an advantage into a problem.
Apple
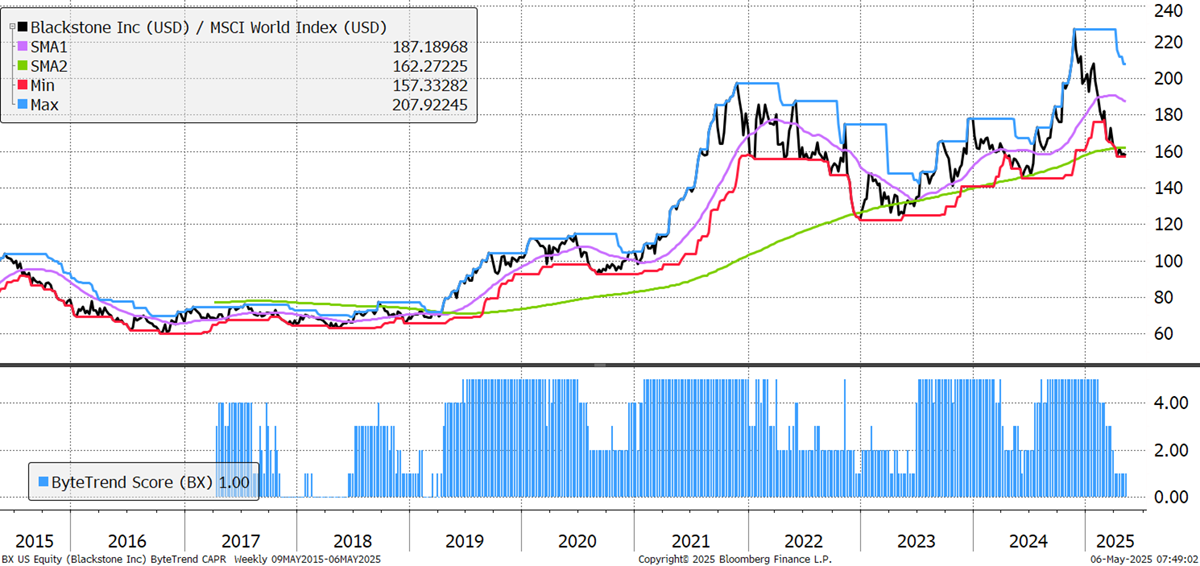
Private equity is coming under pressure. The Yale model of endowment fund asset allocation has led to a huge rise in allocations to private equity and debt in recent decades. Now, heavily exposed institutions that want to sell are only able to liquidate their listed holdings in PE firms or funds. Private equity has suffered liquidity problems, putting downward pressure on the stocks.
Blackstone
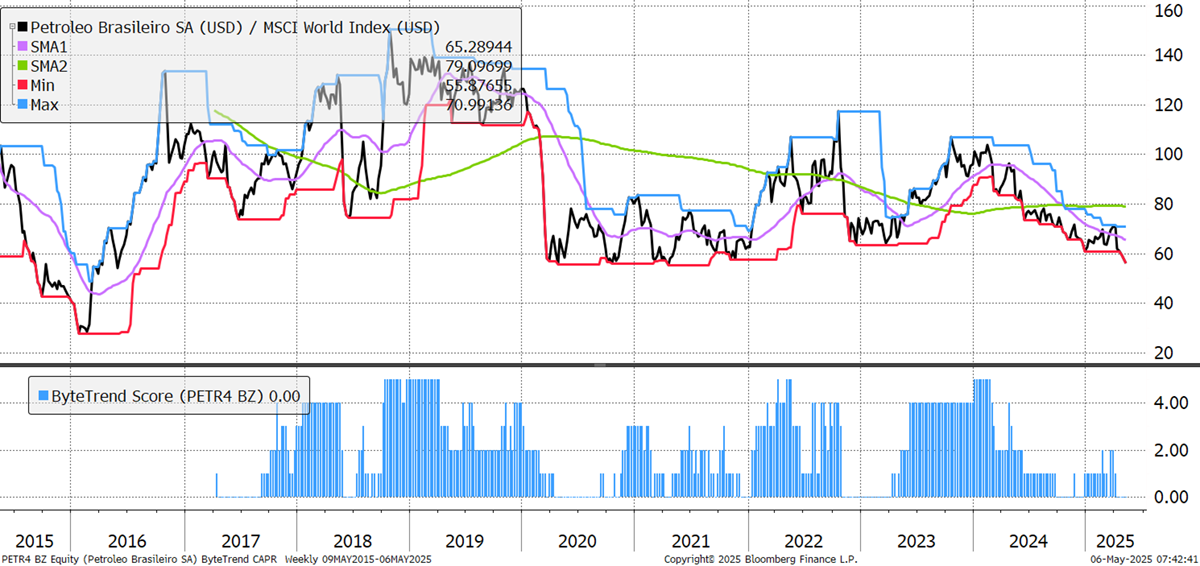
We single out Petrobras, but weak energy stocks are plentiful. Oil prices have broken down materially from their range and are signalling recession or a supply glut following Trump’s first 100 days. The US administration celebrates this fall, but it may not be telling them what they think it is, as the US oil industry rages at the uncertainty and unprofitability. This is not what they voted for.
Petroleo Brasileiro
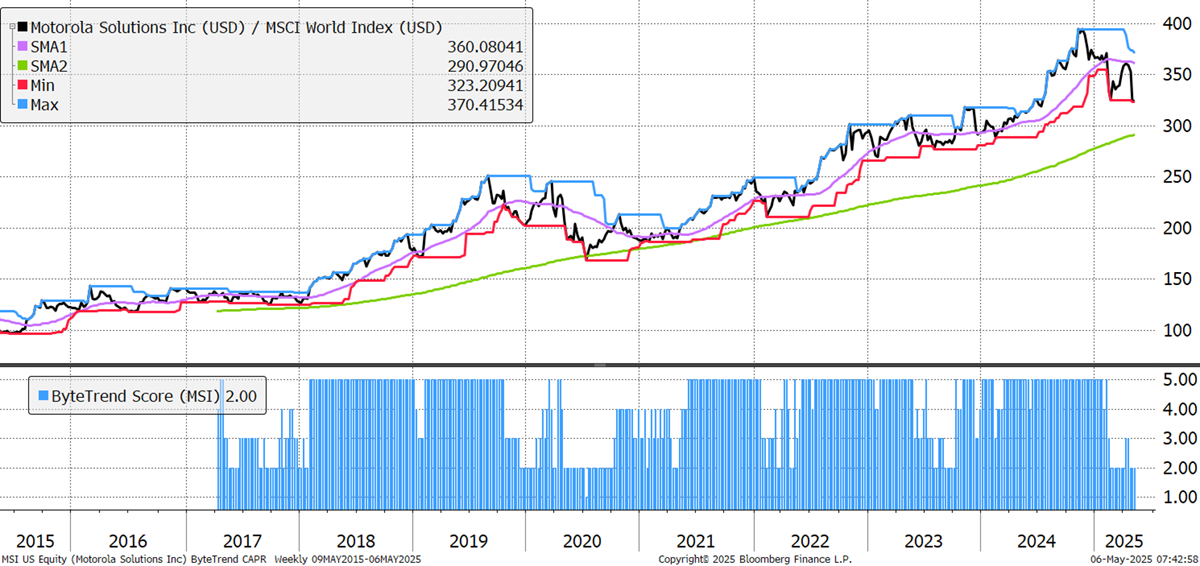
Motorola diversified following its challenging period in the noughties. Today, it is split between Motorola Mobility, owned by Lenovo, which makes and sells smartphones and other consumer electronics worldwide, and Motorola Solutions, which provides mission-critical communications, security technology, and software for public safety and enterprise clients. Another company with hefty valuation multiples that is reliant on a diverse international supply chain.
Motorola Solutions
There are 48 additional weakening trends in the GTI universe.
Bear Trends
These stocks are trading at the 30-week CAPR lows with a ByteTrend Score of 0. They are in a downtrend. All charts shown are CAPR rebased to 100.
| Ticker | FX | Name | CAPR | Dev | Vol | Cap | Sector | Industry |
|---|---|---|---|---|---|---|---|---|
| 2222.SR | SAR | Saudi Arabian Oil | 0 | -19 | 13 | 1,605.9 | Energy | O&G Int |
| MC.PA | EUR | LVMH | 0 | -30 | 30 | 278.2 | Con Cycl | Luxury |
| PEP | USD | PepsiCo | 0 | -22 | 20 | 180.9 | Con Disc | Soft Drinks |
| TMO | USD | Thermo Fisher | 0 | -24 | 26 | 159.5 | Health | Med Diag |
| QCOM | USD | Qualcomm | 0 | -4 | 35 | 153.1 | Tech | Semis |
| BLK | USD | BlackRock | 0 | 17 | 30 | 142.7 | Finance | Asset Man |
| DHR | USD | Danaher | 0 | -17 | 30 | 141.3 | Health | Med Diag |
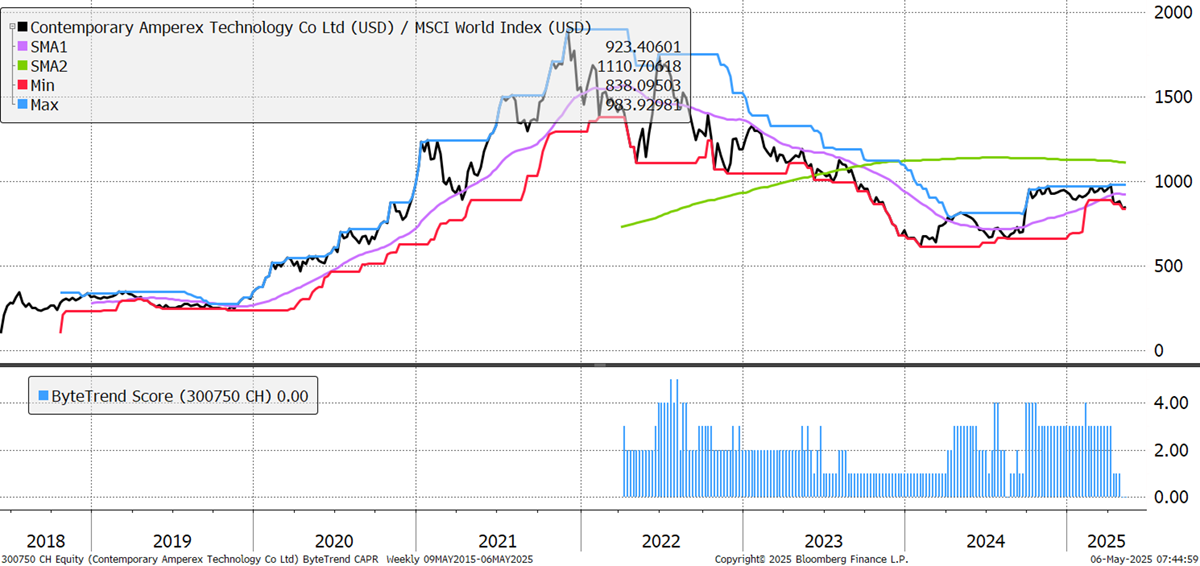
| 300750.SZ | CNY | CATL | 0 | -3 | 23 | 139.7 | Indust | Electrical |
| UNP | USD | Union Pacific | 0 | -4 | 23 | 129.4 | Indust | Rail |
| LOW | USD | Lowe's | 0 | 2 | 21 | 126.0 | Con Cycl | Home Impr |
| SBUX | USD | Starbucks | 0 | -14 | 36 | 92.8 | Con Cycl | Restaurants |
| 0386.HK | HKD | Ch Petrochem | 0 | -5 | 17 | 88.2 | Energy | O&G Int |
| 600028.SS | CNY | Ch Petrochem | 0 | 6 | 13 | 88.1 | Energy | O&G Int |
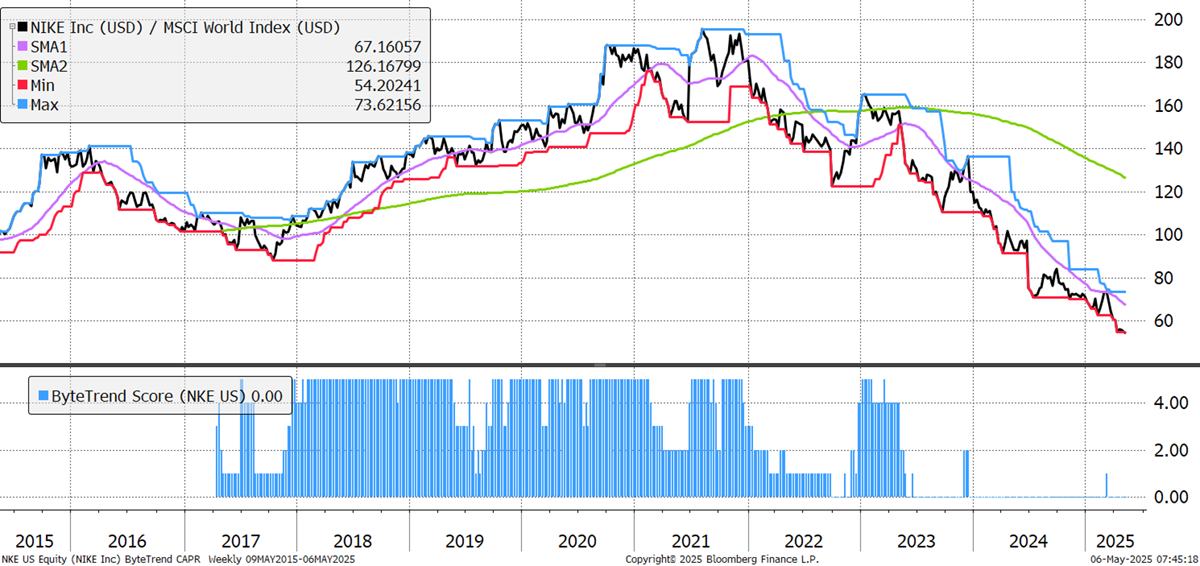
| NKE | USD | Nike | 0 | -48 | 31 | 84.7 | Con Cycl | Footwear |
| UPS | USD | UPS | 0 | -42 | 29 | 81.0 | Indust | Logistics |
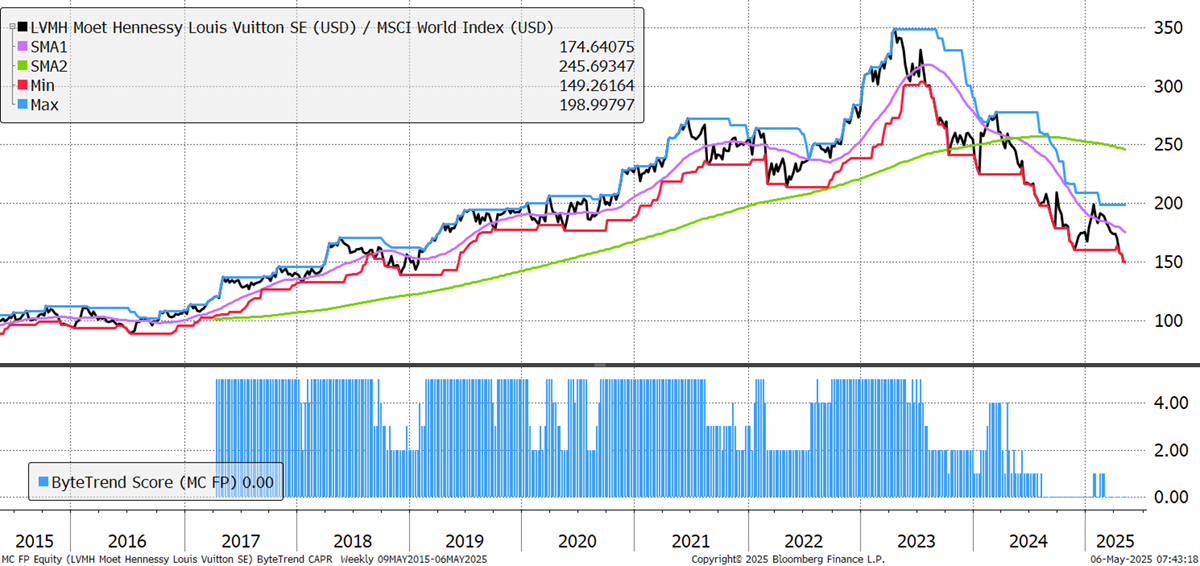
LVMH is top of the luxury pile. Its diversification is usually a benefit, as when alcohol is weak, maybe clothes are strong. This time, all divisions have come under pressure together, and Luxury stocks were being valued like software companies, giving them plenty of room to fall. It’s down around 45% from its peak, and its FCF/EV yield is back above 5% - it’s joint-highest in a decade. It has incredible brand power that will endure through generations, but the chart says hold off for now.
LVMH
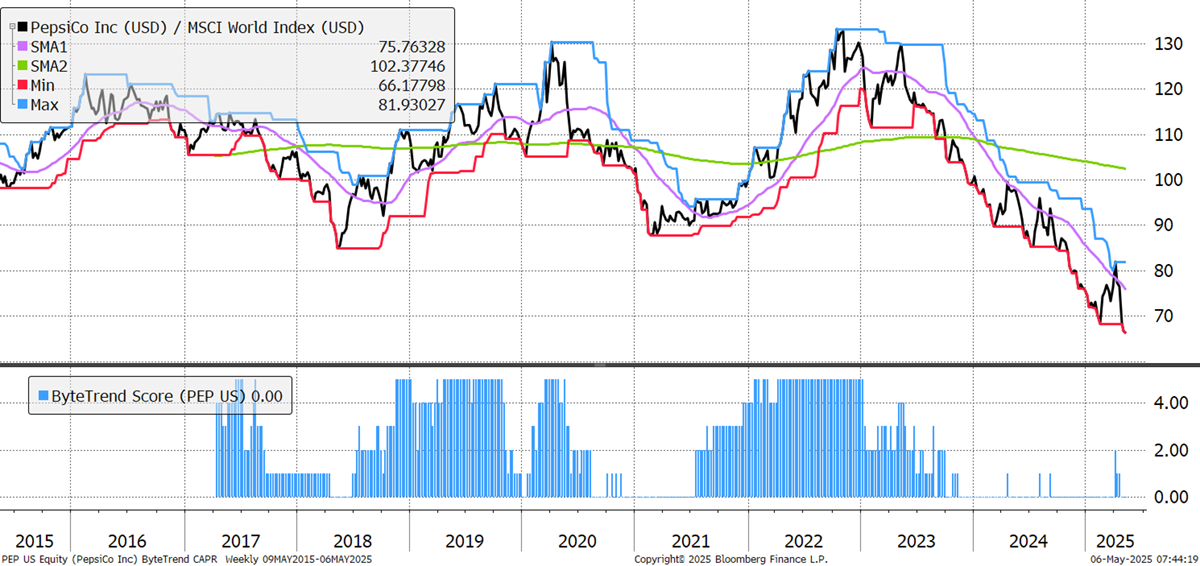
Consumer staples had a moment in the sun as they provided their usual shelter in a market correction. However, PepsiCo’s problems are bigger than tariffs, as it last scored a 5 in 2022. Cost pressures, consumer preferences becoming healthier, and now GLP-1 drugs helping people cut back have all damaged the business, even as Coca-Cola has held up okay. Frito-Lay and Quaker saw particular difficulties in 2024, with the latter being forced into high-profile product recalls.
PepsiCo
China’s battery leader CATL’s valuation has collapsed since 2021, with its EV/Sales down 90%. However, this was actually driven by the denominator, as revenues were growing at well over 100% for most of 2022 and 2023. It has set two higher lows since February 2024 and is the world leader in a critical and fast-growing industry. The tariff war creates a bad narrative for Chinese companies, but clean energy companies like CATL were already highly targeted by tariffs and focus their energy outside the US, which is lagging on battery deployment.
CATL
Nike’s sad story continues, as it has failed to bounce with the rest in recent weeks. The FCF/EV yield at 6.2% is now the highest since 2010, but returns on capital are sliding lower, and revenue growth has turned negative. Their pullback from retail stores to focus on e-commerce and direct-to-consumer channels following the pandemic is looking more and more destructive.
Nike
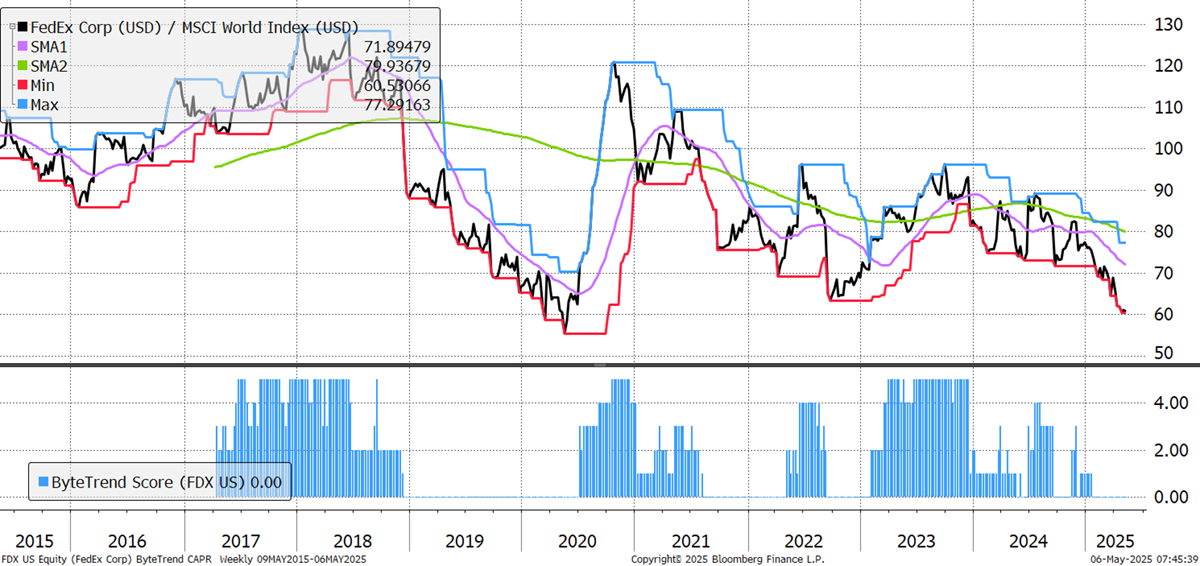
All of the major transport stocks are in bear trends, not only FedEx but also CSX, UPS, and Norfolk Southern. Buffett owns BNSF; perhaps seeing the latest numbers made it a good time to retire. This signal does not bode well for trade.
FedEx
There are 184 additional bear trends in the GTI universe.
Outlook
The market panic is over, at least for the time being. The preference for software over energy and logistics reminds us of the pandemic, but this time, it’s goods not moving rather than people. Defence is also strong, which isn’t necessarily a good thing.
Uber is the most notable stock and is worthy of a closer look.
Thanks for reading GTI.


