
Energy Stocks Chasing Gold


Issue 34;
- India's weakness broadens.
- Payments, exchanges, capital markets, and brokers are soft.
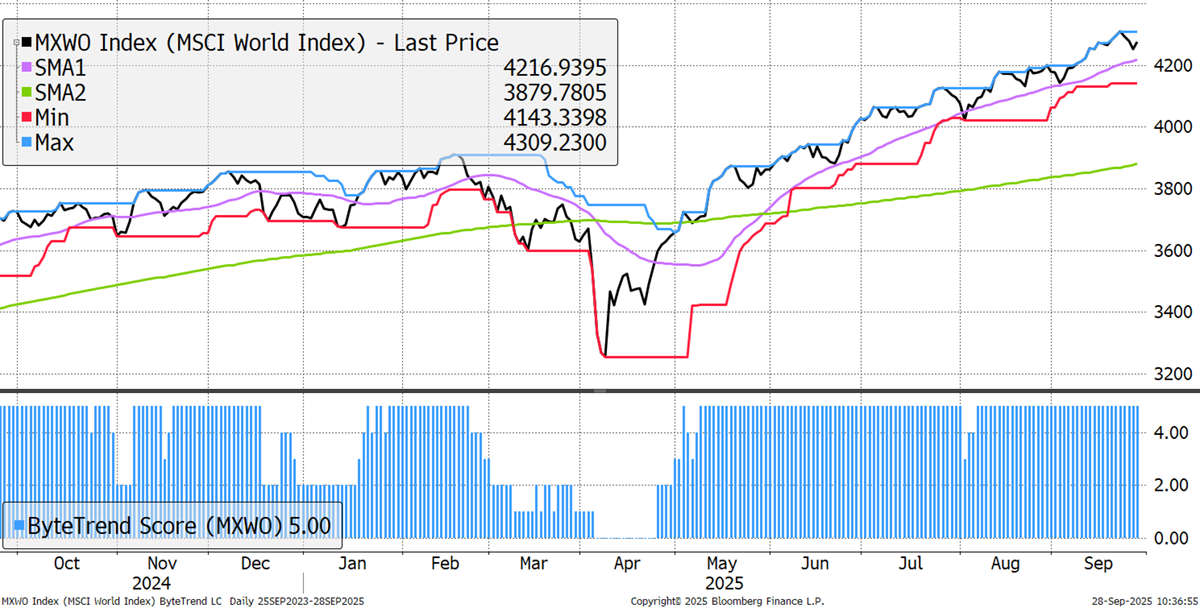
The World Index keeps going up, but as readers might suspect, the heavy lifting continues to be from the world’s largest companies. As we highlighted last week, just 33 companies make up a third of global market capitalisation. This is a momentum market on a scale that is rarely seen.
World Index – Developed Markets – Daily
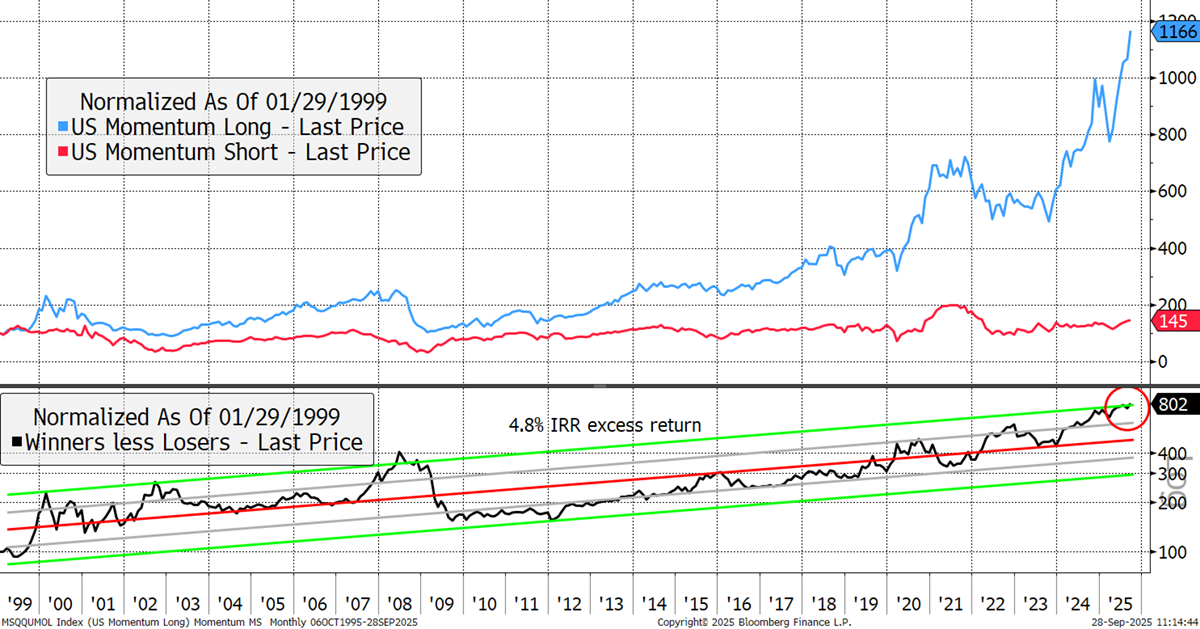
Over 25 years, the momentum effect in the USA is on fire. The annual excess return is 3.4% since 1999, which puzzles the academics. That is, the leading stocks over the past year have beaten the losing stocks by 4.8% per annum. Yet since 2020, when the money supply ballooned, that rate has risen to 18.9% p.a. The relative line (black) is extended just as it was in 1999 and 2007. This is a wild time in markets.
US Momentum Since 1999
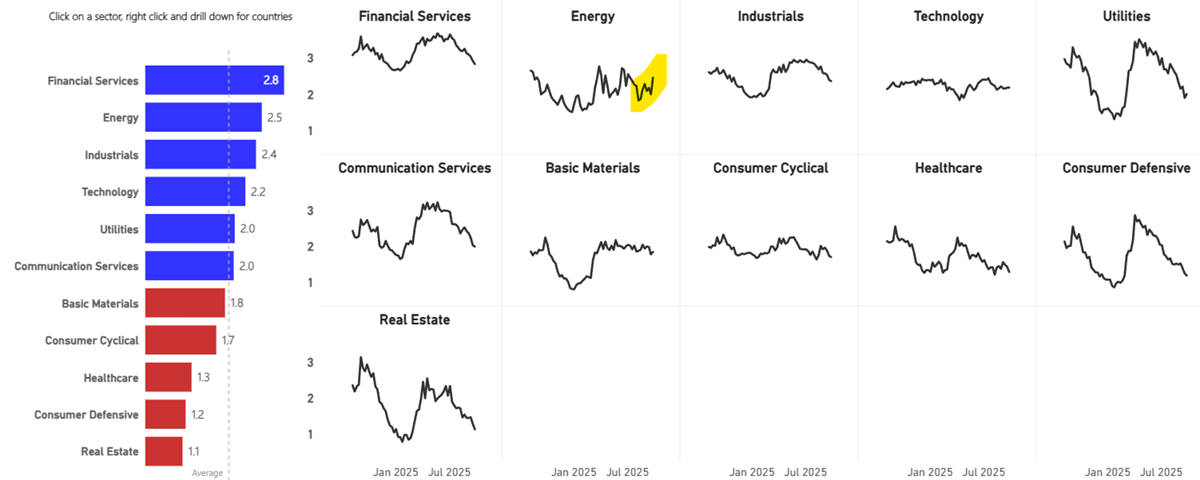
Let’s not kid ourselves otherwise. Looking at the sectors, they are mostly lagging the market, with technology keeping up, and energy, the land of promise. Recall these are equally weighted measures, and so it masks the power of the mega caps. Also, notice the weakening in financials.
Global Sectors CAPR
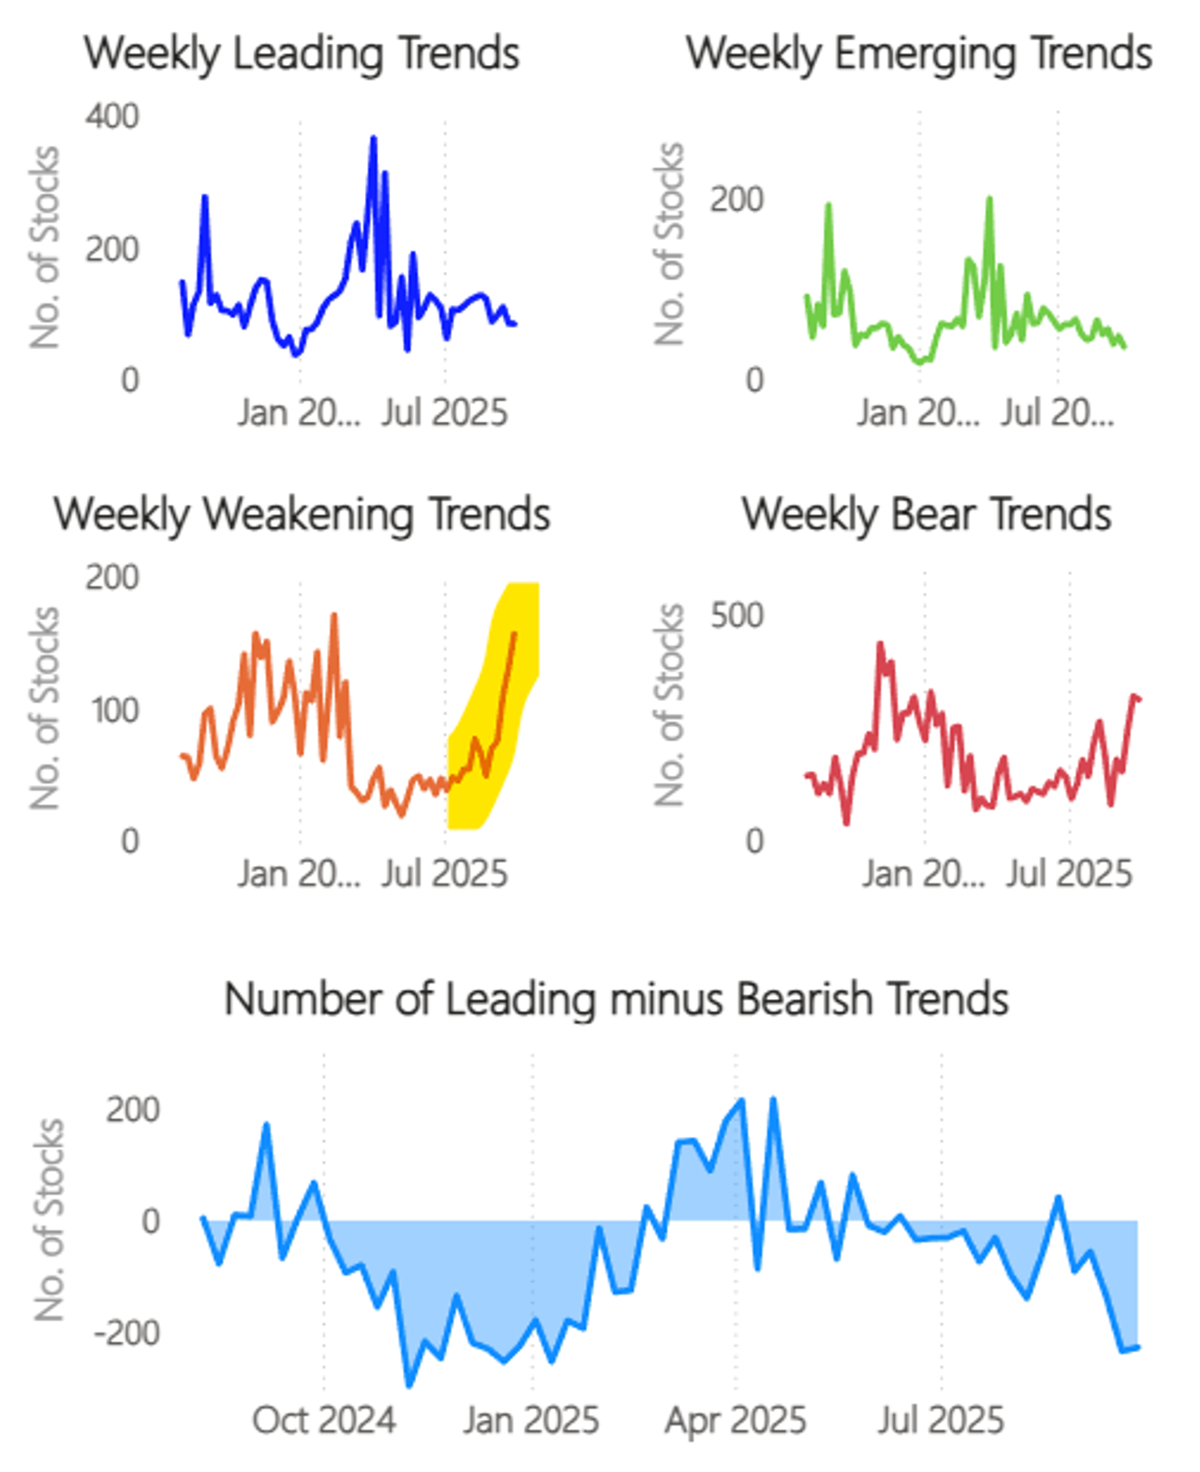
Rashpal Sohan, our resident genius behind the scenes, keeps on hitting sixes. The breadth chart, for the world’s largest 2,500 stocks, now goes back to 2020. So far, the bearish trends (red) are contained, so the bear is unlikely to kick off this week. But the bullish trends (blue) have stabilised. In 2020/21, nearly twice as many stocks drove the market higher. This time, it is far fewer.
ByteTrend: Weekly Breadth Signal – Local Currency
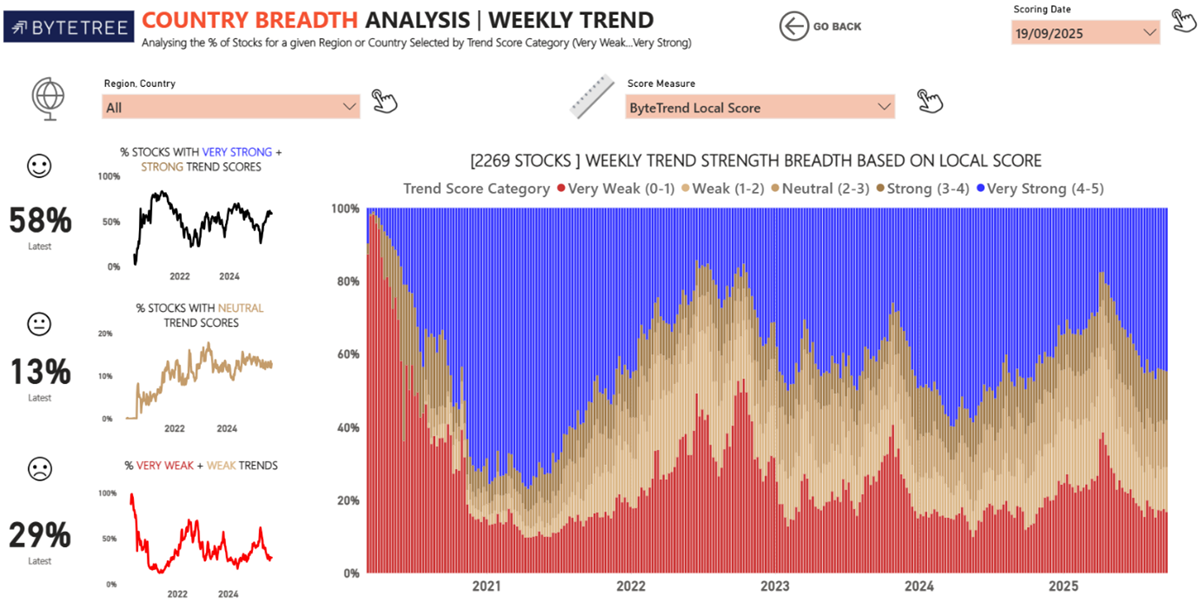
Yet we highlight the surge in weakening trends, which warns us that the seeds of the next bear market have been sown.
ByteTrend Trend Classifications
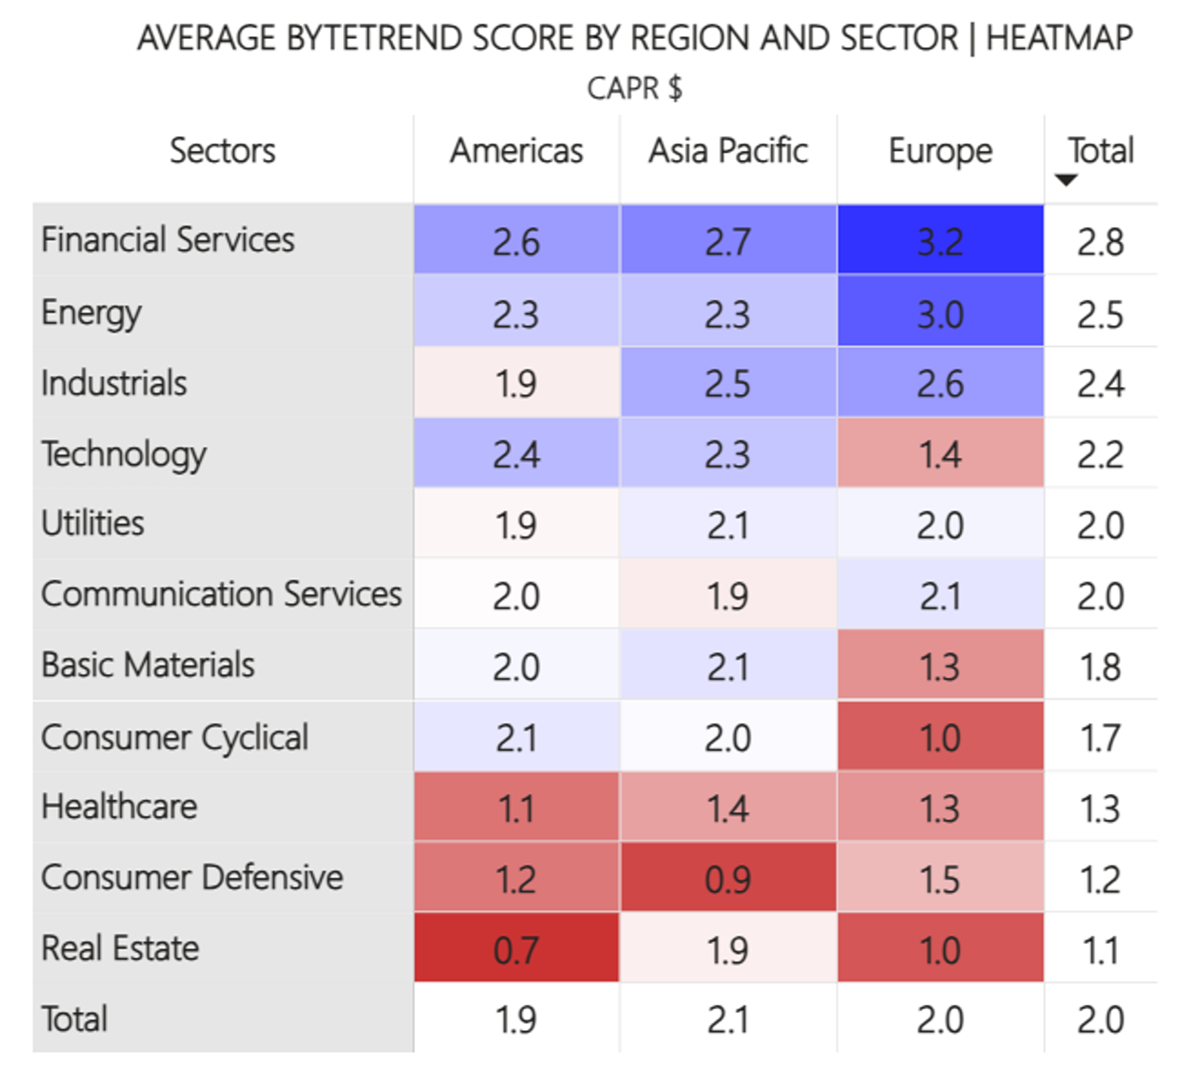
The world matrix shows a boom in energy, which was near the bottom of the list a few weeks ago. Technology and communications (internet) are slightly stronger. Europe and Asia are stronger at the expense of the Americas (excluding Mexico, which is strong).
Average ByteTrend Score by Region and Sector Heatmap - CAPR
Leading Trends with New Highs
These stocks are trading at the 30-week CAPR highs with a ByteTrend Score of 5. All charts shown are CAPR rebased to 100.
| 2330 | TWD | Taiwan Semiconductor Manufacturing Company Limited |
| JPM | USD | JPMorgan Chase & Co. |
| MS | USD | Morgan Stanley |
| GS | USD | The Goldman Sachs Group, Inc. |
| HSBA | GBp | HSBC Holdings plc |
| APP | USD | AppLovin Corporation |
| CAT | USD | Caterpillar Inc. |
| C | USD | Citigroup Inc. |
| AIR | EUR | Airbus SE |
| 9984 | JPY | SoftBank Group Corp. |
| LRCX | USD | Lam Research Corporation |
| SAN | EUR | Banco Santander, S.A. |
| PRX | EUR | Prosus N.V. |
| KLAC | USD | KLA Corporation |
| RR | GBp | Rolls-Royce Holdings plc |
| 2899 | HKD | Zijin Mining Group Company Limited |
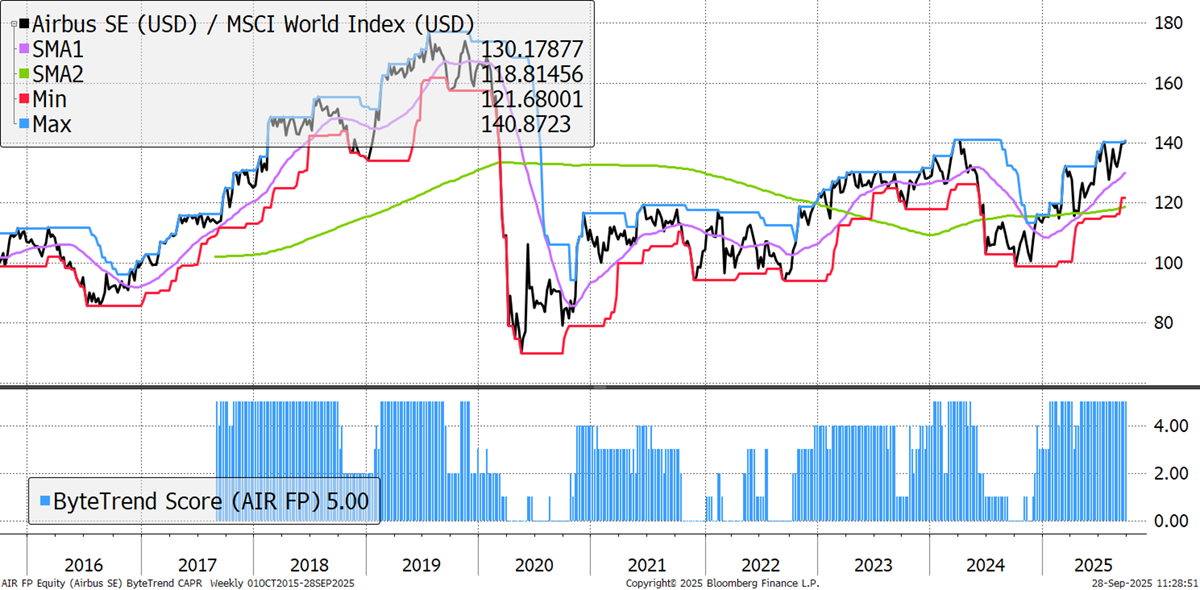
Airbus
The defence theme continues to deliver outperformance. Airbus has been a leading trend for almost all of 2025 and is on the verge of a five-year CAPR high. It is trying to ramp up its engine supply by investing heavily in new capacity. As of its H1 results in July, it had sixty planes without engines, a number it hopes to reduce to zero by the end of 2025. This pushed deliveries into the second half of the year, but it maintained its guidance, nonetheless.
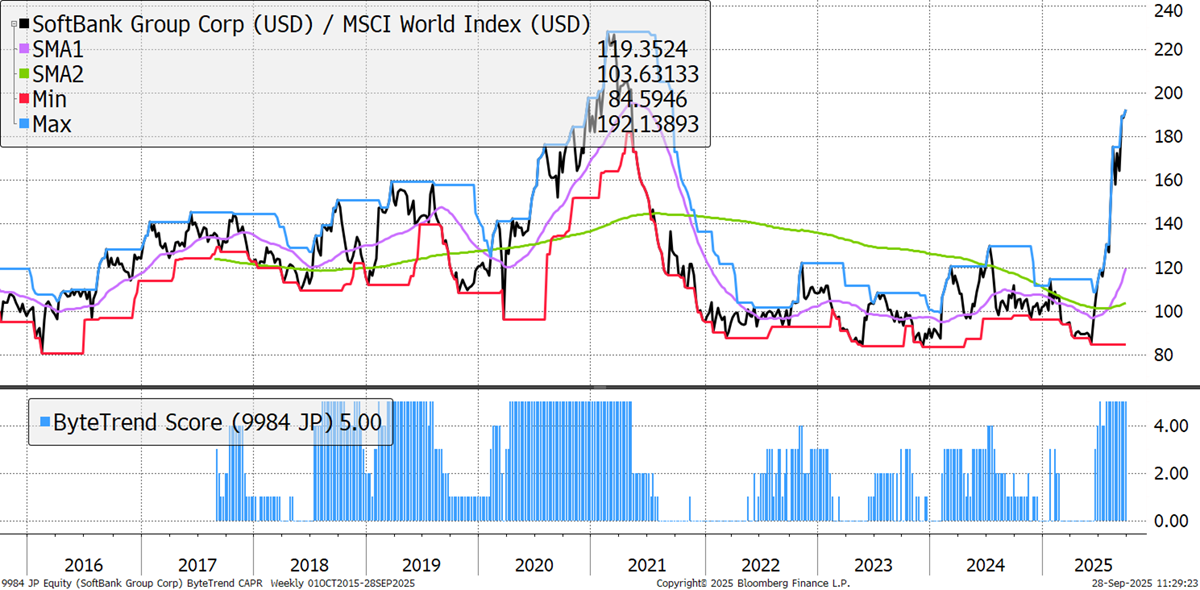
SoftBank
The Japanese tech conglomerate and investor’s incredible run continues. It loves a tech bubble, and the ongoing AI frenzy is perfect for it. Its stake in British chipmaker Arm keeps delivering excellent returns, as it remains over double its IPO price thanks to high and consistent growth (+25% YoY in Q1 2026). The number of enterprises using Arm-based chips for cloud processing has seen a 14x increase since 2021.
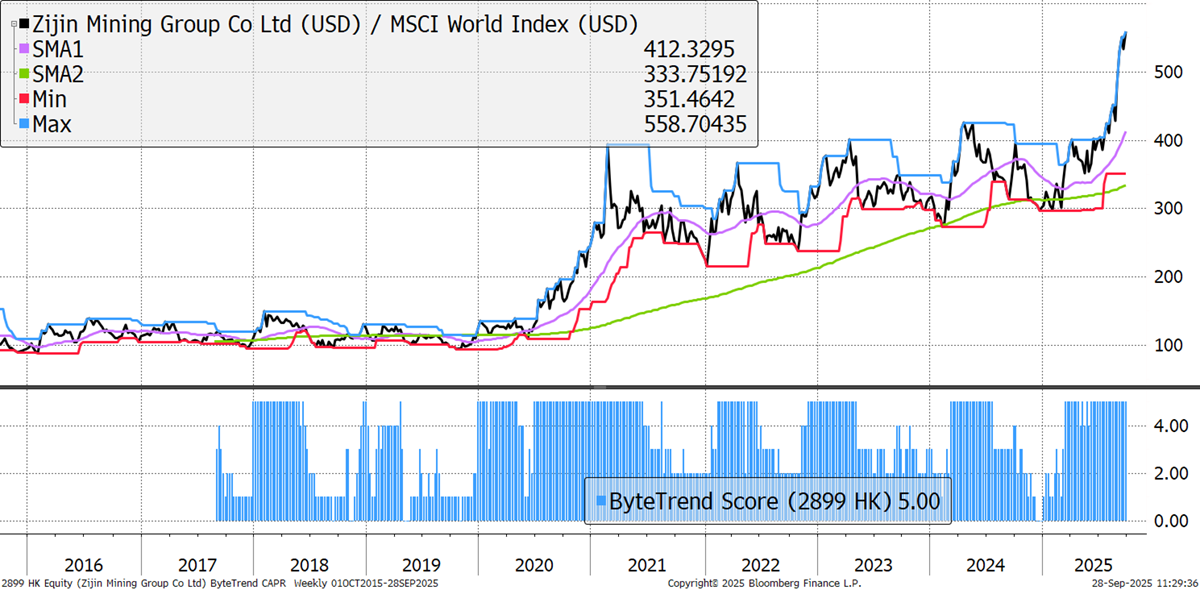
Zijin Mining
It’s a good time to be a gold and copper miner, and Zijin is no different. It reported a strong first half of 2025, with net profit surging 54% year-on-year to RMB 23.2 billion ($3.2 billion), driven by robust production growth amid high metal prices. Copper production was up 10% YoY, and gold was up 17%. Acquisitions are driving further growth in Ghana (Akyem Gold Mine), Kazakhstan (Raygorodok Gold Mine), and China (Zangge Mining).
There are 76 additional leading trends with new highs in the GTI universe. There was a notable pickup in energy stocks. The gold mining trade has broadened into industrial metals. The banks and tech are showing fewer leaders.
Emerging Trends
These stocks are trading at the 30-week CAPR highs with a ByteTrend Score of less than 5. They don’t have to be in an uptrend, just emerging. All charts shown are CAPR rebased to 100.
| TSLA | USD | Tesla, Inc. |
| 9988 | HKD | Alibaba Group Holding Limited |
| 5930 | KRW | Samsung Electronics Co., Ltd. |
| BAC | USD | Bank of America Corporation |
| ASML | EUR | ASML Holding N.V. |
| INTC | USD | Intel Corporation |
| TD | CAD | The Toronto-Dominion Bank |


