Feels Like 1999


Issue 32;
- The market is being driven by volatile stocks.
- Too many companies are being left behind.
The World Index retains its ByteTrend Score of 5, which it has held for the past 28 days.
World Index – Developed Markets – Daily
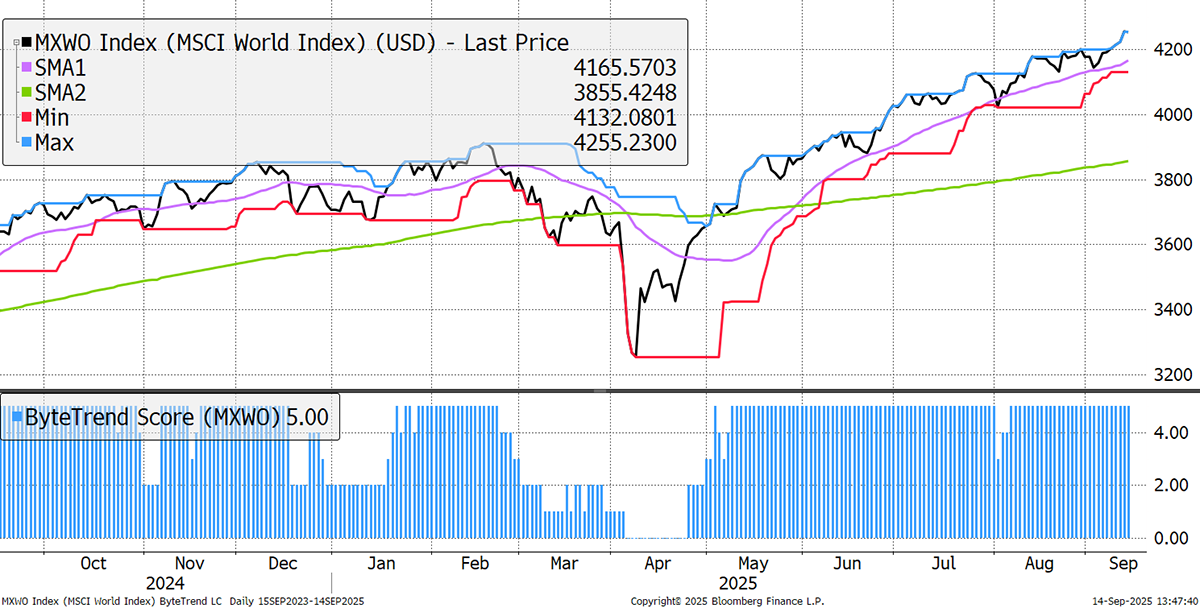
Backtesting the score to 1970, and the world record was 124 consecutive days in May 1987. The market faced a 28% correction the following October. In March 2017, a score of 5 was held for 96 days, which led to a 20% correction. The recent 28 days don’t sound like much.
World Index – Number of Days with a ByteTrend Score of 5 – Daily
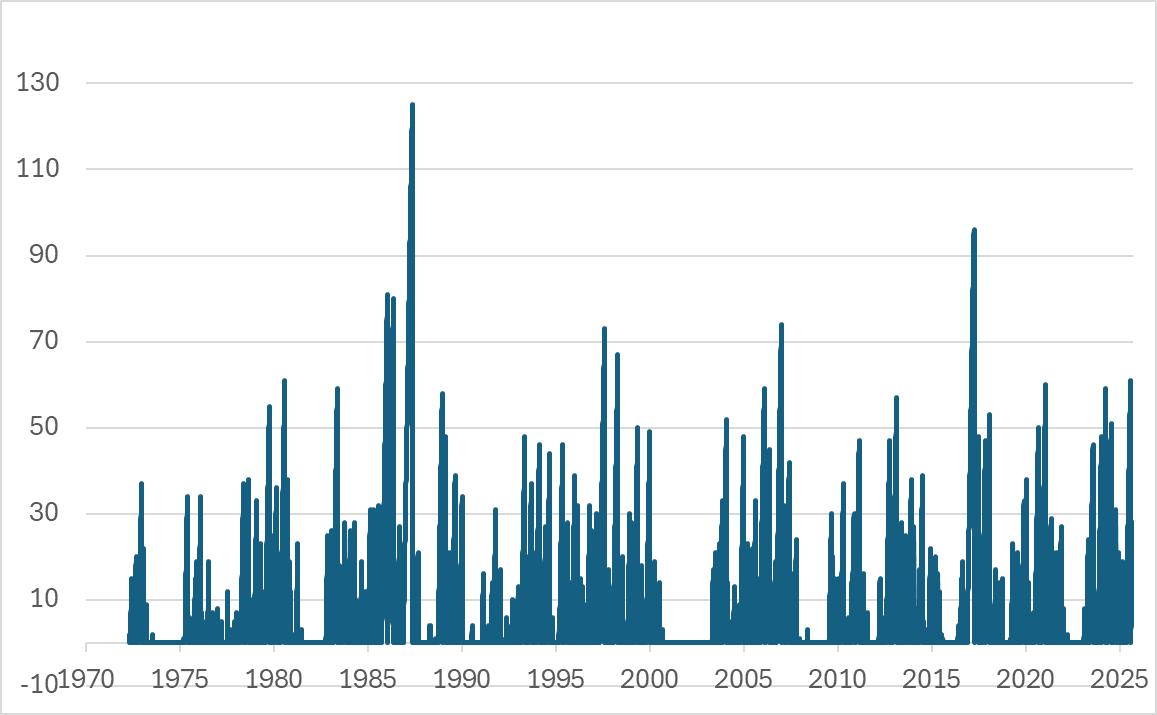
But if we glaze over the brief Autumn setback, this post-April run would amount to 92 days, which would be the third-highest reading on record. It is perhaps invalid to ignore the modest correction in August, as it actually happened; however, it still paints a picture of how long this rally has been going on. We mustn’t turn bearish until there is evidence of things going wrong, but we will gladly take the liberty to highlight the risks.
We showed this chart a few months ago, and it’s time to show it again. This bull market, as in 2020/21, has been driven by high volatility stocks, while the less risky low vol stocks, generally known as quality, have been left behind. It is right to be suspicious of bull markets led by the riskier stocks.
High Versus Low Volatility Stocks
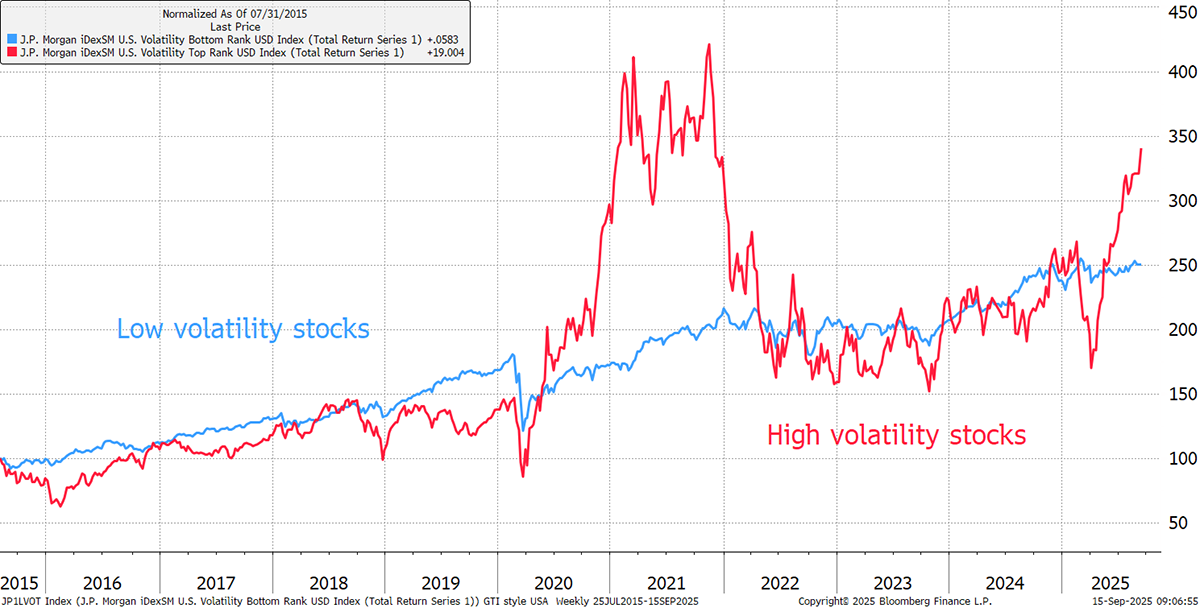
We shall keep a close eye on this because a rotation back into low vol stocks will likely mark the end of this bull market.
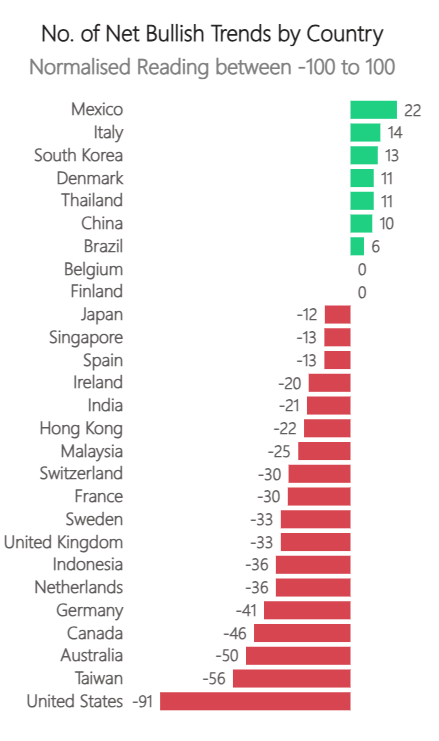
It’s not over until it’s over, and while last week saw few countries deliver more positive stock moves than negatives, the index remains positive. Thailand improved, as did China, but Mexico stood out. On the bear side, Taiwan and the USA were weaker.
These charts and more are available on the GTI 200 spreadsheet, which is free to download at the end of this update. The charts can be found in the “insights” tab.
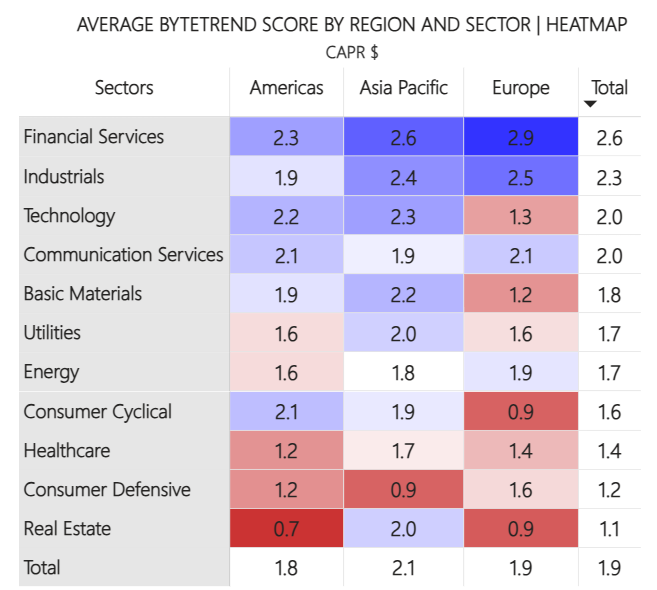
The world matrix now sees Asia in the lead as it takes over from Europe. It still sees financials as the best sector, but that lead is cooling despite some mega banks making CAPR highs last week. Asian REITS stand out against Europe and the US. Utilities have dropped considerably, while healthcare is a little stronger. The emerging winner is basic materials.
Average ByteTrend Score by Region and Sector Heatmap - CAPR
In ByteTree Venture, which is available through the ByteTree PRO package, we chose our best idea of the week, which is normally published on Monday afternoons.
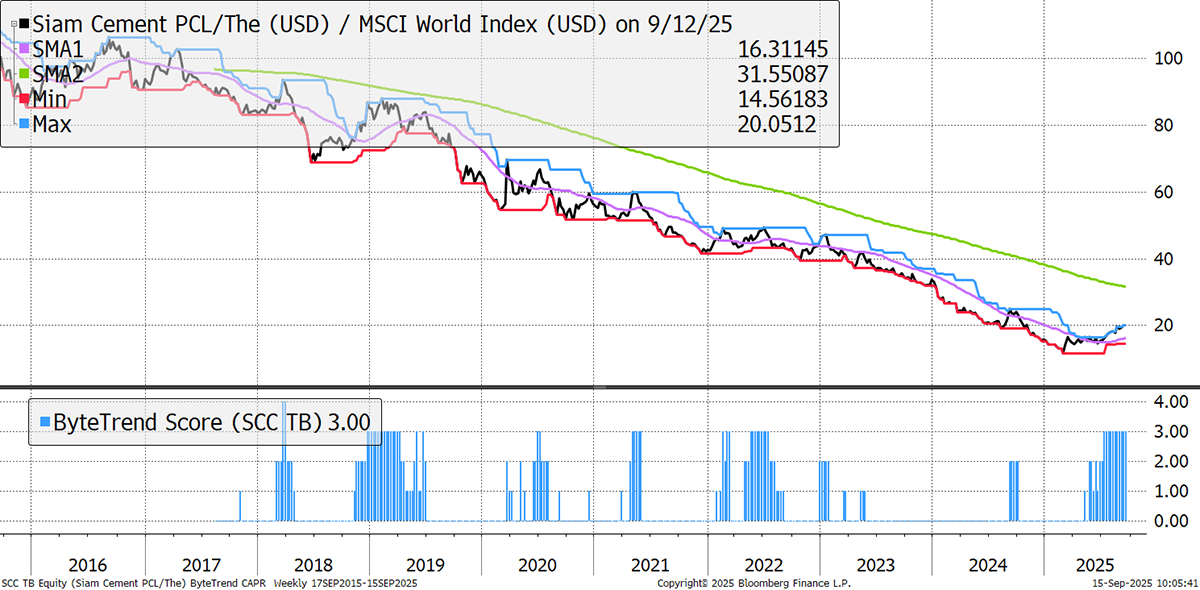
Siam Cement
This week, it won’t be Siam Cement as the stock is too hard to buy for most investors. But it trades at its lowest valuation for a generation, and this is a very good opportunity to pick up a regional monopoly with the new government’s pledge for stability.
For this week’s idea, subscribe to ByteTree PRO.
Leading Trends with New Highs
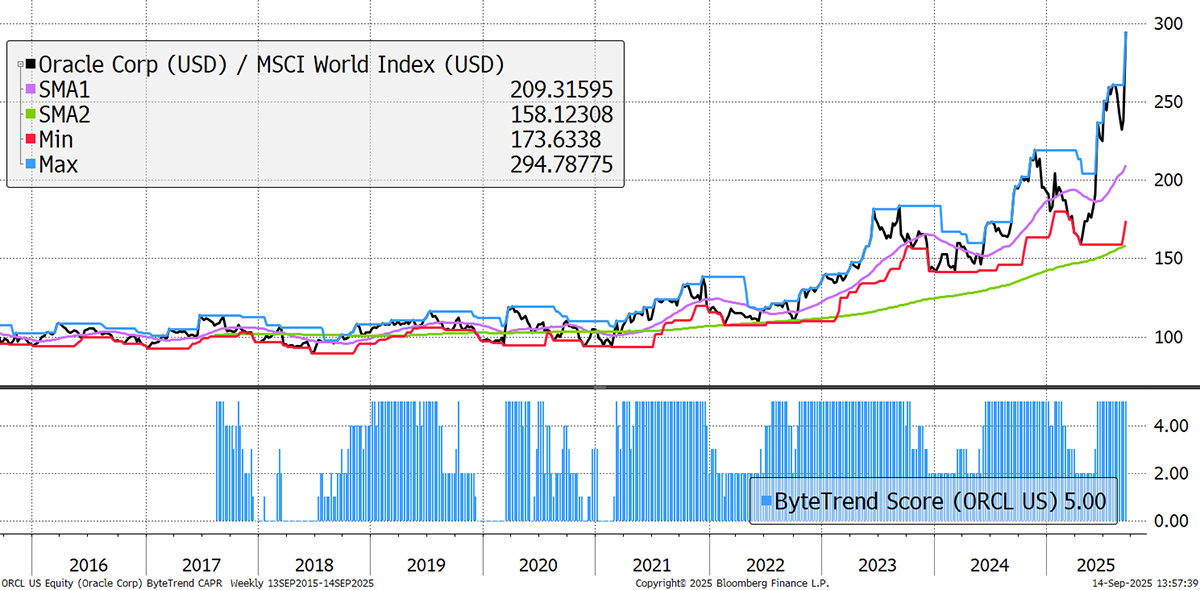
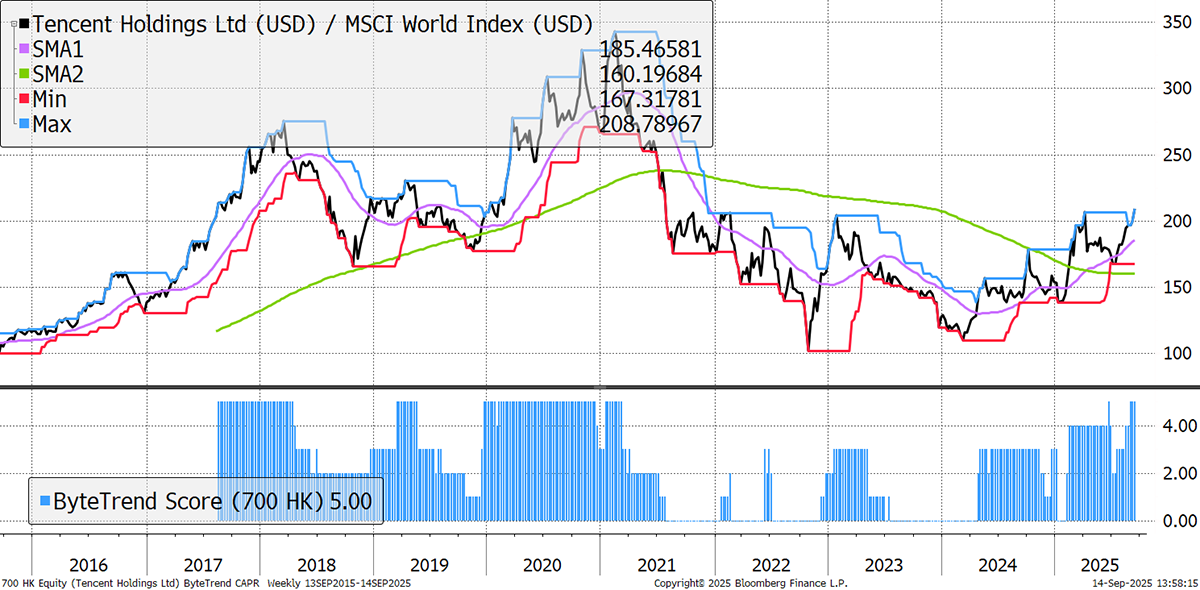
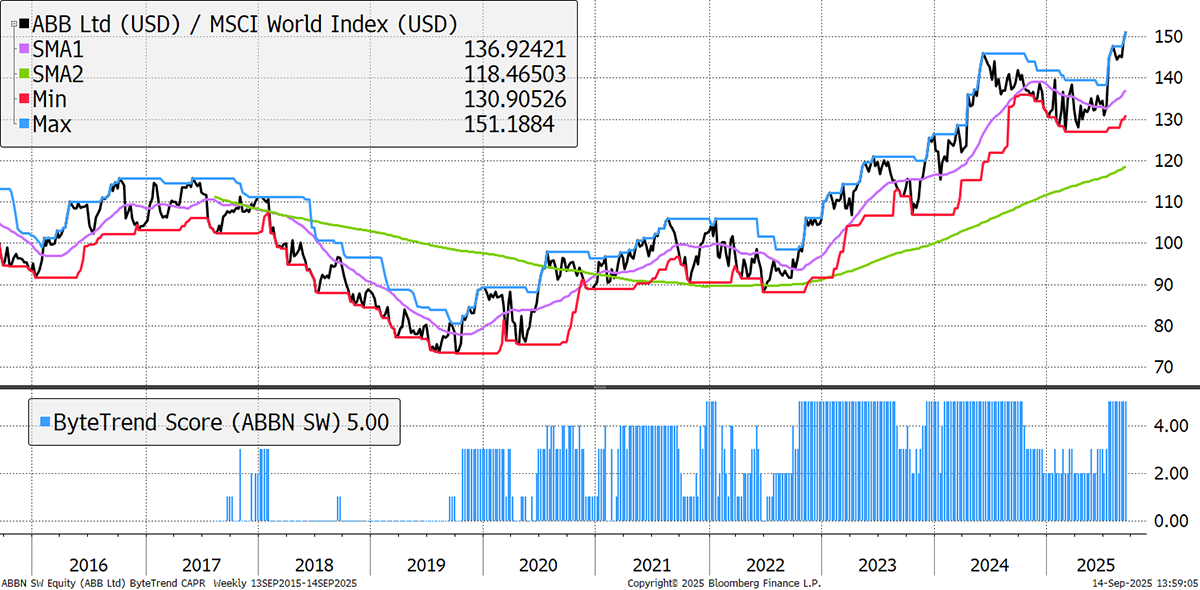
These stocks are trading at the 30-week CAPR highs with a ByteTrend Score of 5. All charts shown are CAPR rebased to 100.
| GOOGL | USD | Alphabet Inc. |
| AVGO | USD | Broadcom Inc. |
| 2330 | TWD | Taiwan Semiconductor Manufacturing Company Limited |
| ORCL | USD | Oracle Corporation |
| 700 | HKD | Tencent Holdings Limited |
| MS | USD | Morgan Stanley |
| HSBA | GBp | HSBC Holdings plc |
| GS | USD | The Goldman Sachs Group, Inc. |
| APP | USD | AppLovin Corporation |
| C | USD | Citigroup Inc. |
| AIR | EUR | Airbus SE |
| MU | USD | Micron Technology, Inc. |
| 9984 | JPY | SoftBank Group Corp. |
| 660 | KRW | SK hynix Inc. |
| SAN | EUR | Banco Santander, S.A. |
| LRCX | USD | Lam Research Corporation |
| APH | USD | Amphenol Corporation |
| PRX | EUR | Prosus N.V. |
| ABBN | CHF | ABB Ltd |
| RR | GBp | Rolls-Royce Holdings plc |
| 2899 | HKD | Zijin Mining Group Company Limited |
| 2317 | TWD | Hon Hai Precision Industry Co., Ltd. |
| 9999 | HKD | NetEase, Inc. |
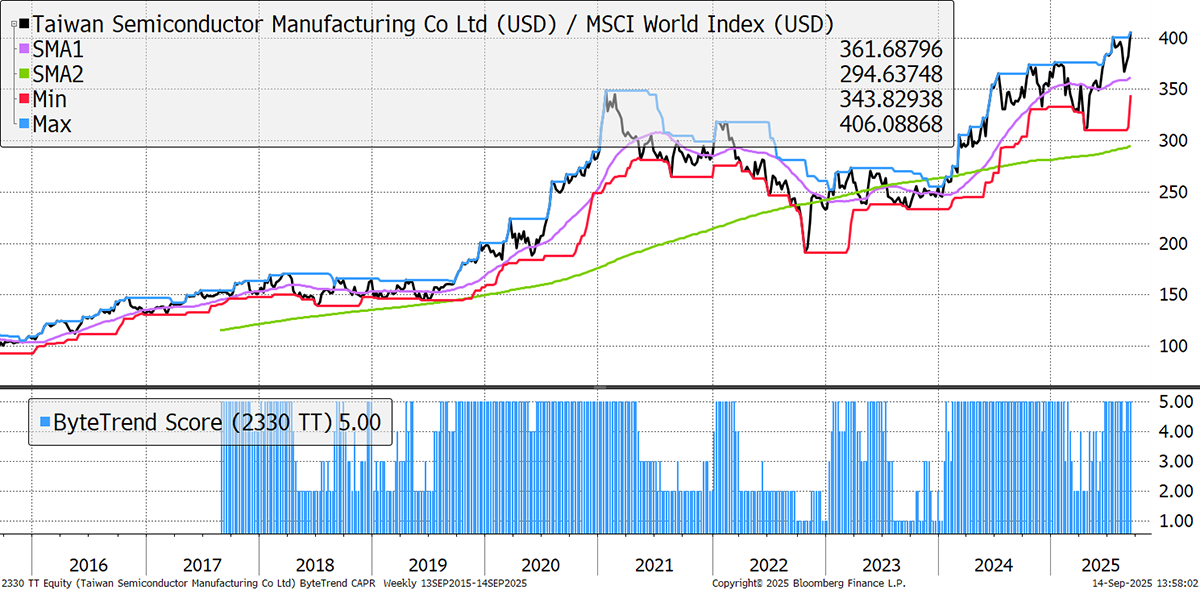
TSMC
TSMC is one of those rare things: an elephant that gallops. Despite its one trillion-dollar market cap and dominant market position, its August revenues were 34% higher than a year before. It has outperformed the index over the short and long term, yet still sits on an undemanding 20x price/earnings ratio due to its exceptional 40% net profit margins.
Oracle
Oracle was boosted massively this week by knockout results, and analysts sharply upgraded their estimates for revenue growth in the coming few years. Its capex has gone from 20% of sales to 45%, and gross profit margins have fallen from 80% to 70%, but the gamble is paying off as its 2028 and 2029 analyst sales estimates were raised by 10% and 25% respectively. The AI boom may not pay immediate dividends, but if they’re big enough, investors seem happy to wait.
Tencent
Chinese tech is beaten down, trading on much more acceptable multiples than some American stocks, but growth is now returning, and returns on capital too. It was a net issuer of shares from 2005 until December 2022, but the tide has turned, and it has bought back 4% of its shares since then. Its capex is rising rapidly, as it invests heavily in AI to develop cloud services and build out a data centre footprint.
ABB
Data centres are the newest reason to spend more on upgrading the grid, as they are power-hungry and growing fast. But grids were already seeing major investment from efforts to modernise and decarbonise. ABB posted a record $9.8 billion order intake (up 14% YoY) and $8.9 billion revenue in Q2 2025 (6%), with US order growth up 37%, driven by electrification, automation, and surging AI infrastructure investment. It’s also spinning off its robotics division, worth multiple billions of dollars.
There are 71 additional leading trends with new highs in the GTI universe. Gold stocks feature heavily, as do electrical industrials focused on building out the grid, and three new banks join the category. Semiconductors are also strong, along with large global banks.
Emerging Trends
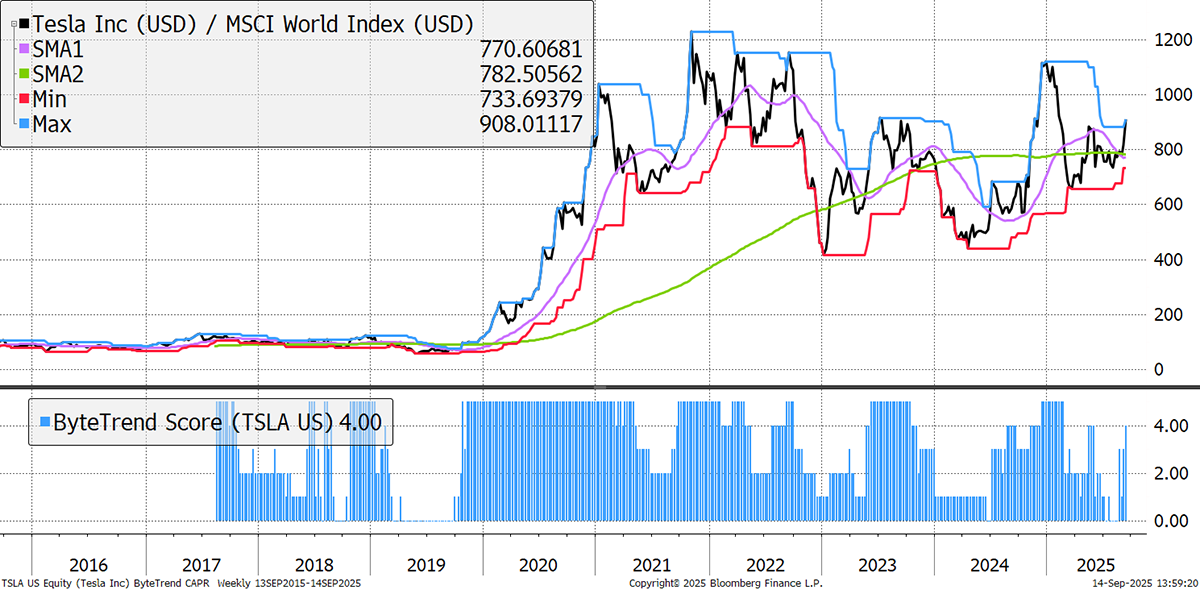
These stocks are trading at the 30-week CAPR highs with a ByteTrend Score of less than 5. They don’t have to be in an uptrend, just emerging. All charts shown are CAPR rebased to 100.
| TSLA | USD | Tesla, Inc. |
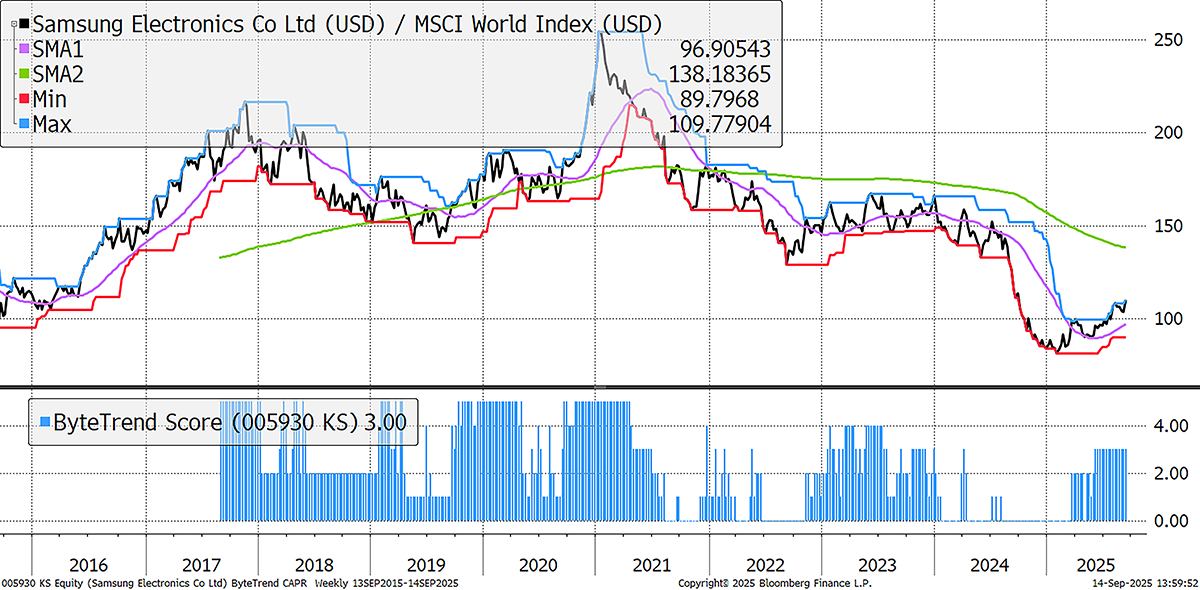
| 5930 | KRW | Samsung Electronics Co., Ltd. |
| SE | USD | Sea Limited |
Tesla
Tesla bounces back from the dead for the nth time. It’s a high vol stock, but it will be interesting to see whether it can make an all-time CAPR high, as it has gone sideways for five years. The rollout of its autonomous vehicles got much fanfare among the in-crowd, as they now offer better safety and lower cost than drivers who can get tired, distracted, angry, or intoxicated. With its robots starting to appear too, and Musk supposedly focused again (with a $1bn pay package), the stock refuses to give up.
Samsung
Samsung’s potential comeback was first flagged in these pages at the beginning of August. We wrote, “The Galaxy S25 series are seeing high demand, alongside its legacy DRAM chips. The analysts are upgrading. It’s a shovel provider to the AI boom on an undemanding 13x PE for next year.” These things remain true, and the stock is up 8.5% since then.