
Global Equity Caution Seems Prudent


Issue 57;
- Stockmarkets weaken in the energy surge.
- The VIX remains elevated while breadth deteriorates.
- Safe havens embrace digital.
Global Trends is a deep dive into global equities. The aim of this analysis is to better understand which countries, sectors, industries, and stocks are driving market returns. Not only does it help investors identify opportunities, but it also highlights the risks. We try to condense as much important information as possible, focusing on what really matters each week. Embrace this as a weekly discipline, and you’ll soon have a much better understanding of global financial markets.
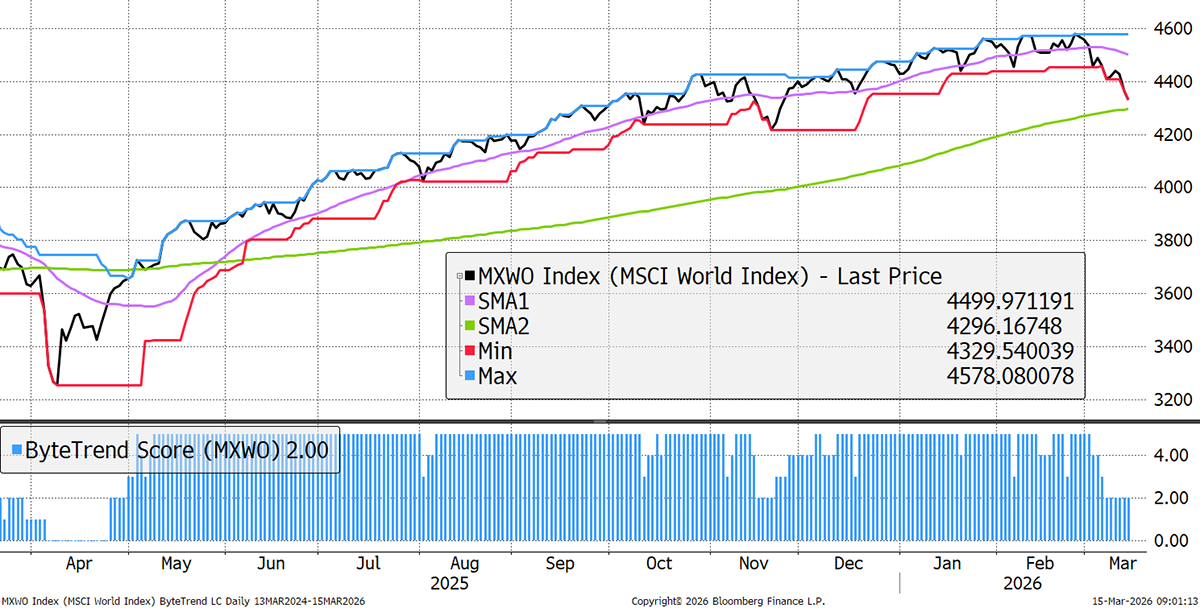
The World Index holds a ByteTrend Score of 2 in USD. The price now sits on the 200-day moving average. Volatility is rising alongside the oil price, and the risks come from rapidly rising bond yields.
World Index – Developed Markets – Daily
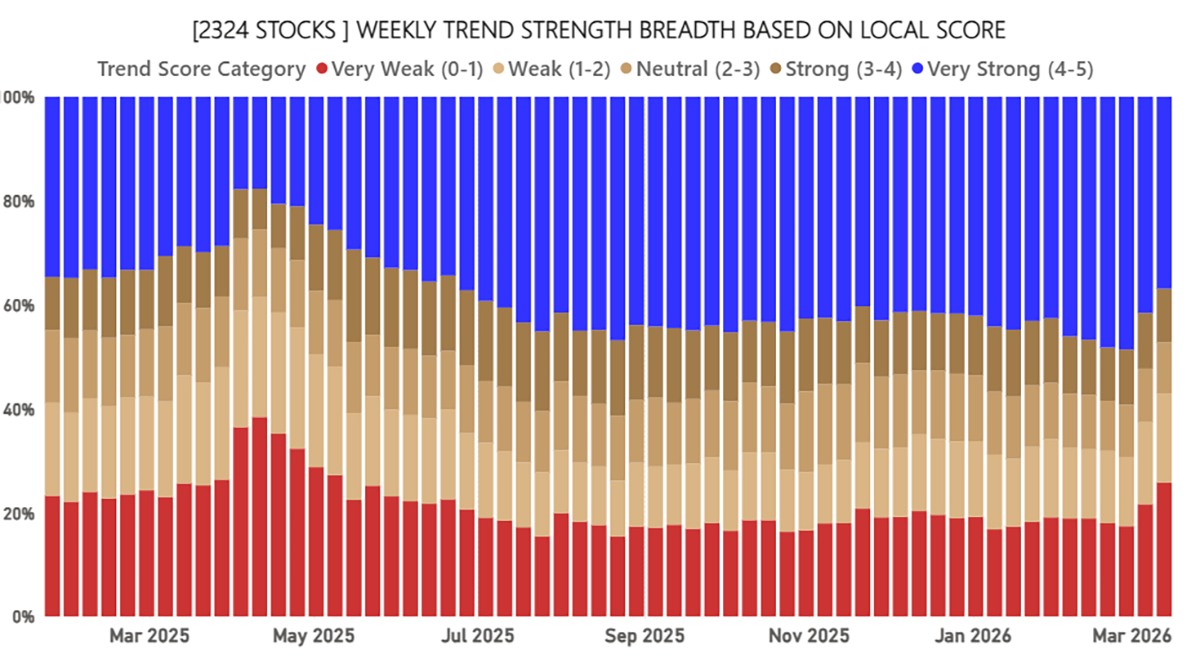
Global Equity Breadth – Local Currency
Breadth is now deteriorating for the second week in a row. Fewer stocks are rising in local currency terms, while new downtrends are developing.
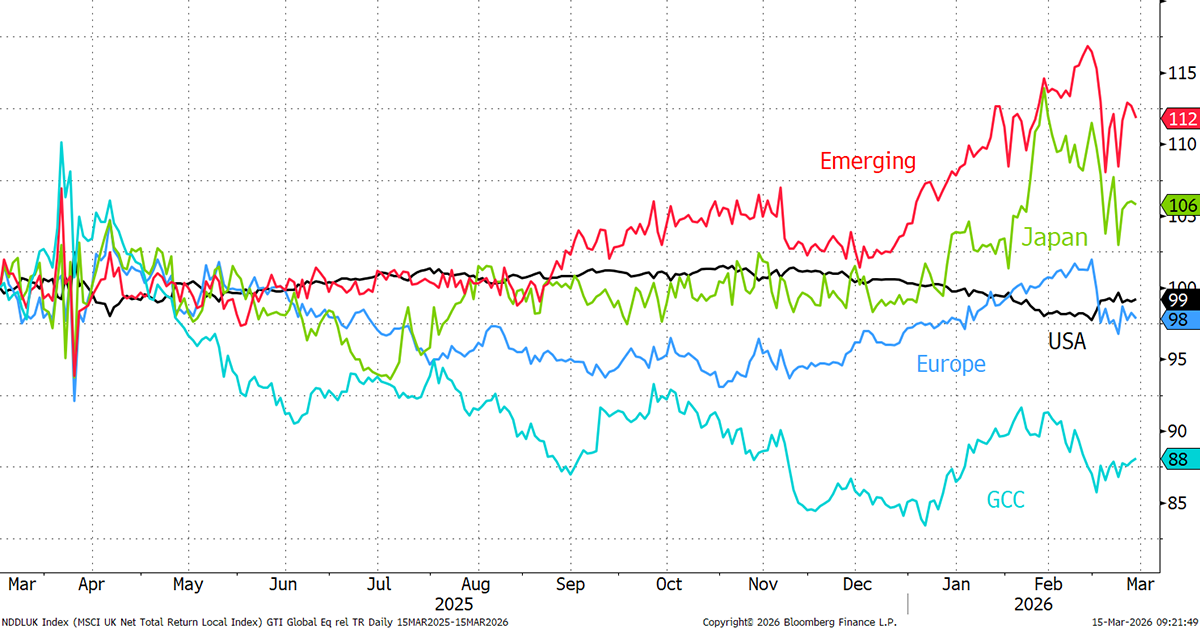
Mean Reversion
There is a rebound in Emerging Markets and Japan, while the US holds steady. The Gulf countries have lagged but proved resilient since the shock. Saudi Aramco has helped.
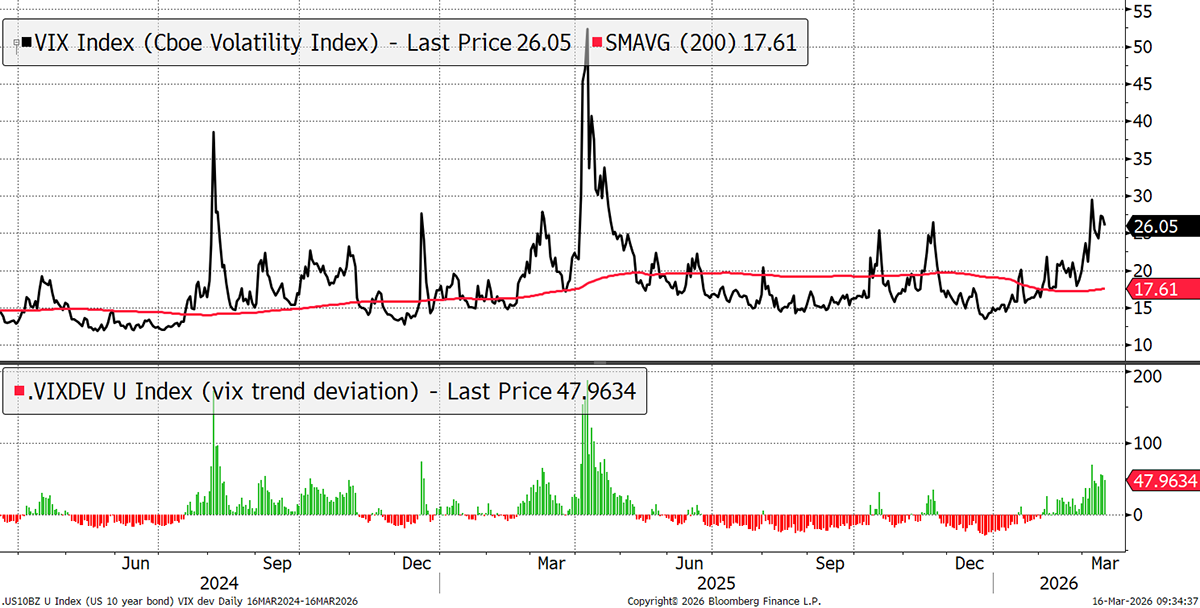
Equity Volatility
The VIX has not made a new high but remains elevated as the price of options remains high. Perhaps the system can cope with $105 oil. No doubt it can, but if the ships don’t move, it can only go higher.
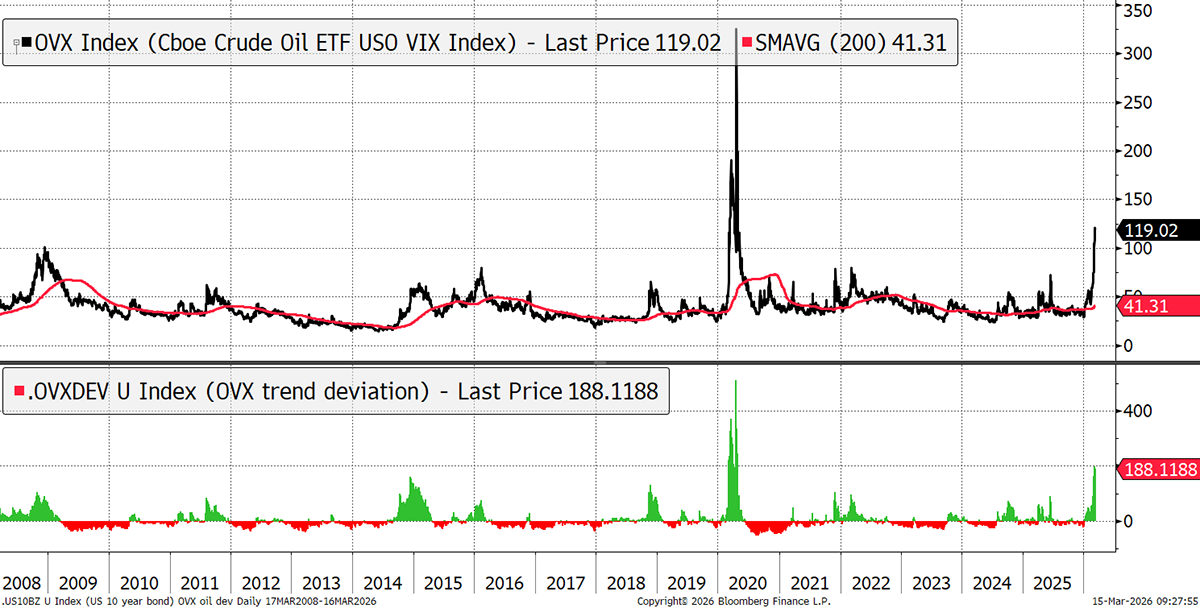
Oil VIX (OVX)
OVX, oil’s implied volatility, is 15 points higher than last week. There is uncertainty in oil prices.
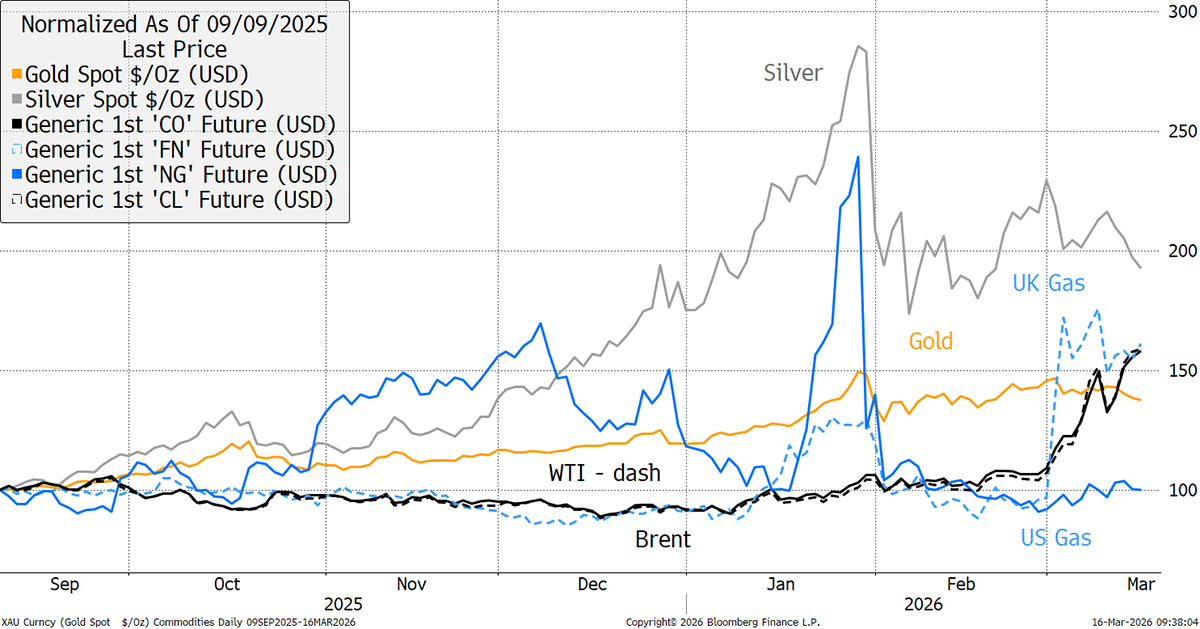
Commodity Prices
I repeat this chart, as precious metals are losing steam. Gas has been flat over the past week, but oil is rising again.
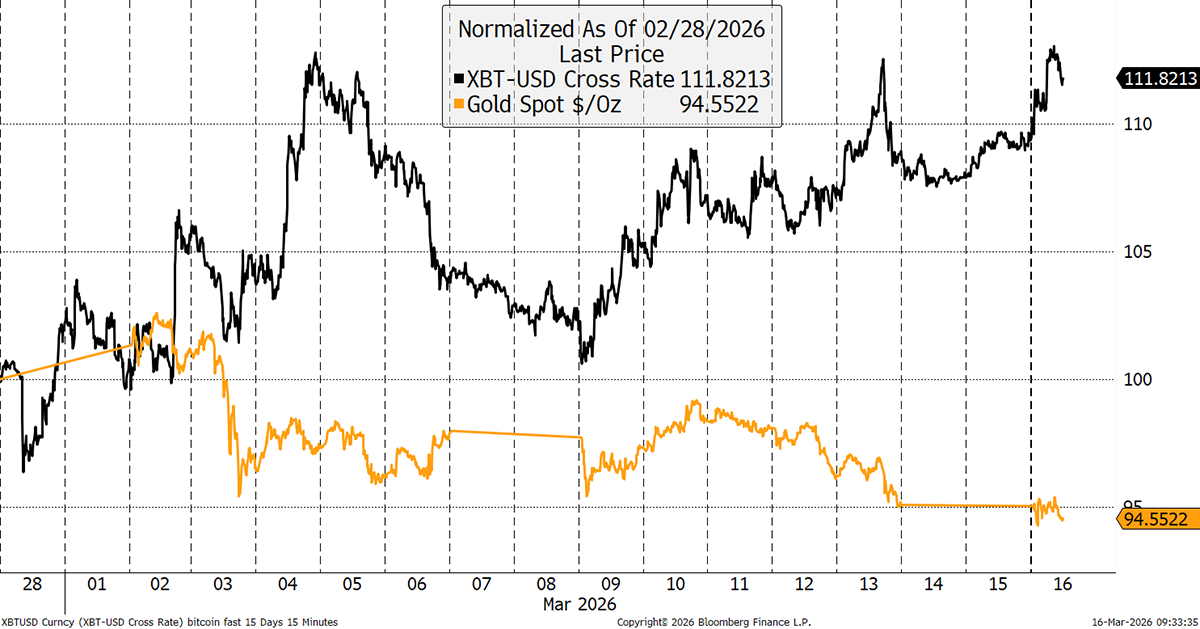
Bitcoin versus Gold
Since hostilities began, Bitcoin has gained while gold has pulled back. Few serious investors seem to acknowledge this. The logic is that a liquid alternative asset, which is digital, becomes even more relevant at times of war. Gold doesn’t trade over the weekend, hence the flat line.
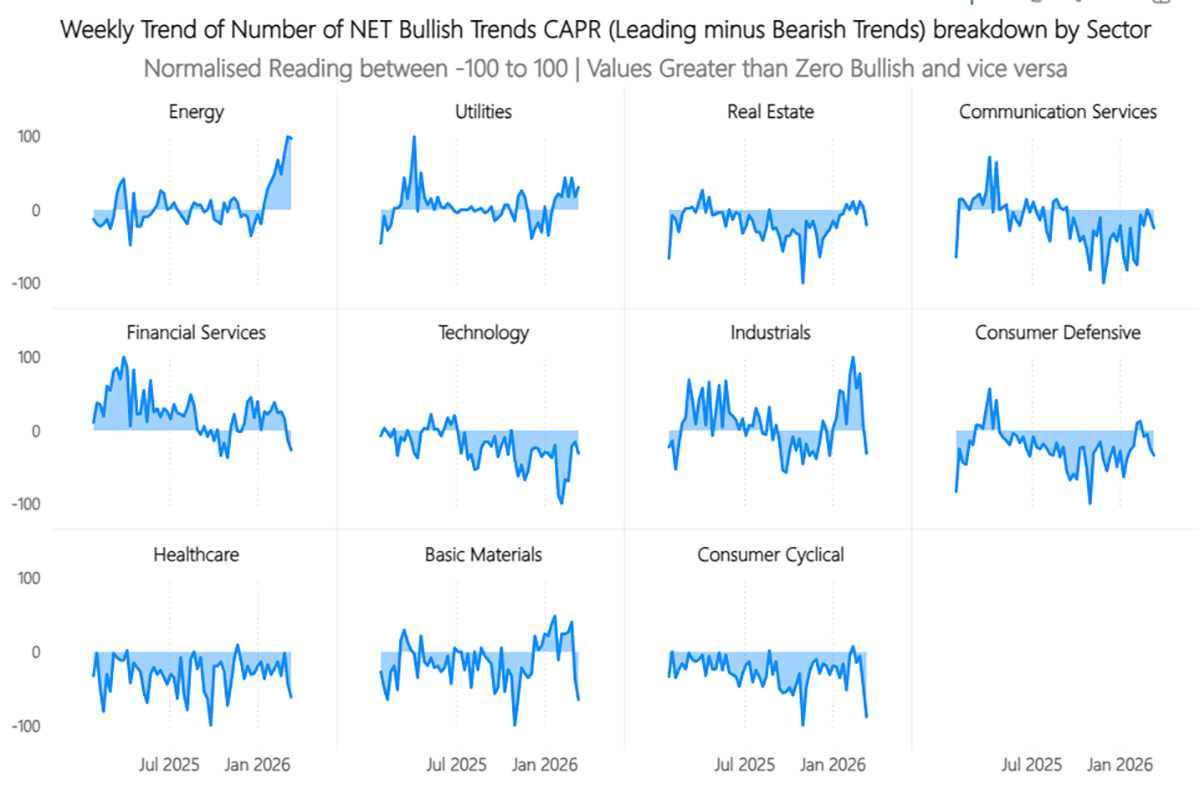
Sector Trends in CAPR
Energy failed to make a CAPR high last week, with utilities in the lead. Other sectors are slipping, especially those highlighted.
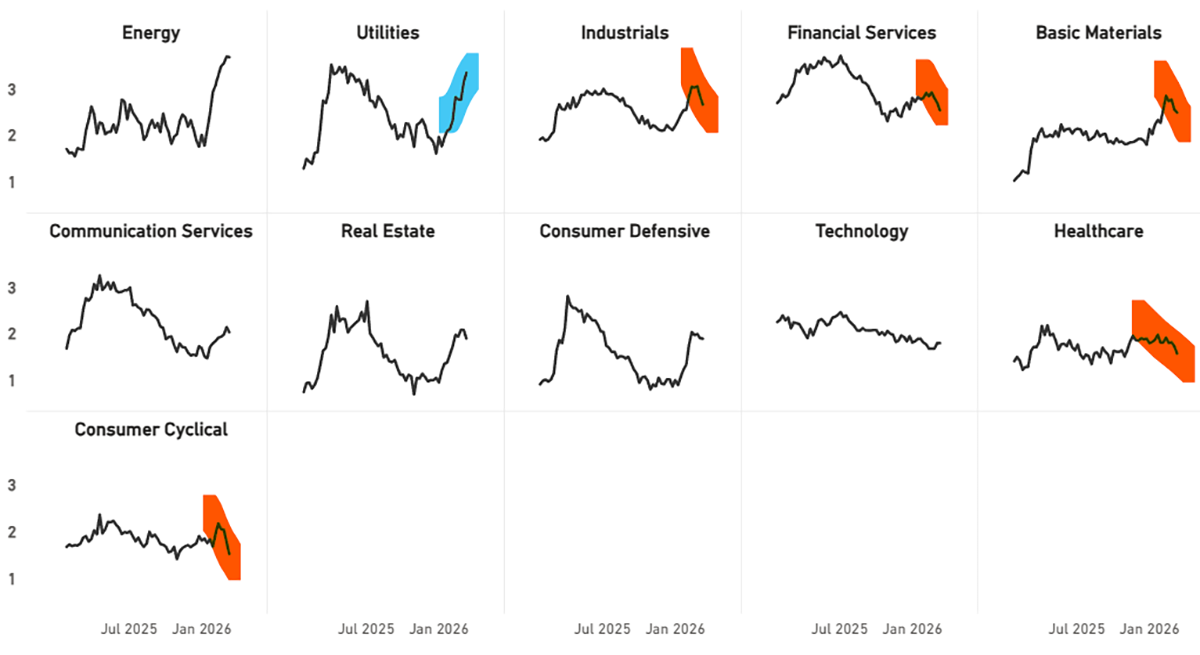
Sector Trend Classifications in CAPR
Energy and Utilities saw new trends last week; Basic Materials, Consumer Cyclicals, and Healthcare took a hit. Financial Services are weakening, especially Investment Advisory… one to watch.
Net Winners
We have added a new table, which shows the net changes in the market leadership in CAPR terms. Energy and Utilities have improved, with a higher percentage of stocks in that sector in the Leading Trend group. Consumer Cyclicals, Communication Services, Technology, and Real Estate have slipped.

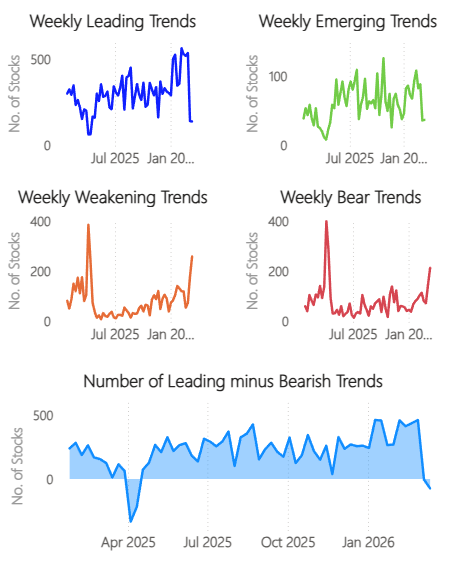
Trend Type
Unsurprisingly, there has been a collapse in new highs and a surge in new lows.
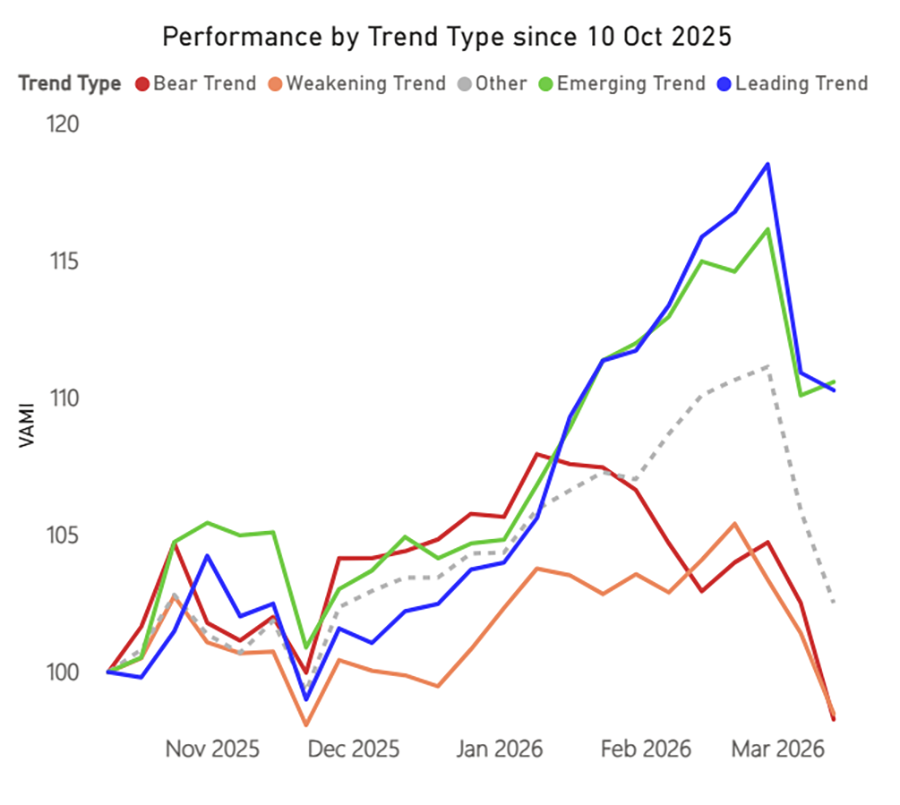
Trend Type Performance
Starting last October, the trends by strength are grouped in the order you might expect to see. This is still very much a momentum market with the winners outperforming the losers.
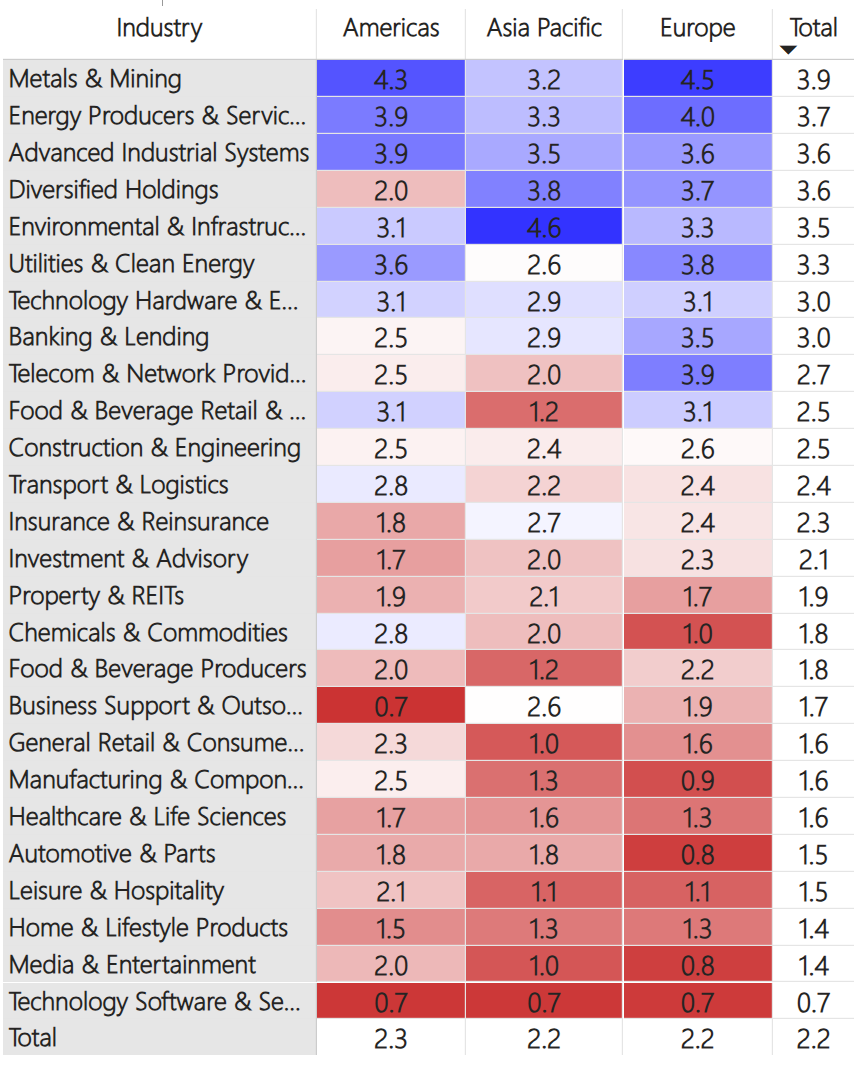
Regions and Industries Average CAPR Score
Many trends that had strong starts to 2026 came into the crisis overbought as a result, and have pulled back sharply. Home & Lifestyle products, Construction & Engineering, and Manufacturing & Components stand out in this regard, but it’s also true of Chemicals, Food & Beverage Producers, REITs, and Transport. Even Metals and Mining have pulled back.
On the other hand, Utilities and Clean Energy have continued their strong run, along with Energy Producers. It’s also notable that Food & Beverage Retailers have strengthened during the last fortnight, as they are more likely to be able to pass on higher costs than their suppliers, the producers. Investment Companies are struggling once again.
Near the bottom of the table, Automotive, Leisure, and Media stocks are all weakening even further, and Healthcare’s hard-fought gains are fading. Meanwhile, Software has shown resilience for a second week in a row, as digital beats physical in times of war.
User Guide
Refer to our GTI: User Guide for an overview of the key concepts and terminology used in this report. These concepts may take a little bit of getting used to, but they are very powerful once you do.
How to Read the Tables
The Value Composite Score (Value) is measured against the company’s own financial history and not in absolute terms. The columns are Cheap (Chp), Value (Val), Fair Value (FV), Overvalued (OV), and Expensive (Exp). The Growth Composite Score (Growth) is measured by sales, earnings, cash flow, dividends, and book value on a per share basis. The columns are High, Good, Medium (Med), Low, and Negative (Neg).
Leading Trends with New Highs
These stocks are trading at the 30-week CAPR highs with a ByteTrend Score of 5. All charts shown are CAPR rebased to 100.
| Name | Annual Vol 30w | Mkt Cap $Bn | Value | Growth |
| Exxon Mobil Corporation | 19 | 651 | OV | Neg |
| Micron Technology, Inc. | 58 | 480 | Exp | Low |
| PetroChina Company Limited | 28 | 335 | OV | Good |
| Shell plc | 20 | 251 | OV | Neg |
| Commonwealth Bank of Australia | 26 | 203 | OV | Good |
| TotalEnergies SE | 20 | 176 | OV | Neg |
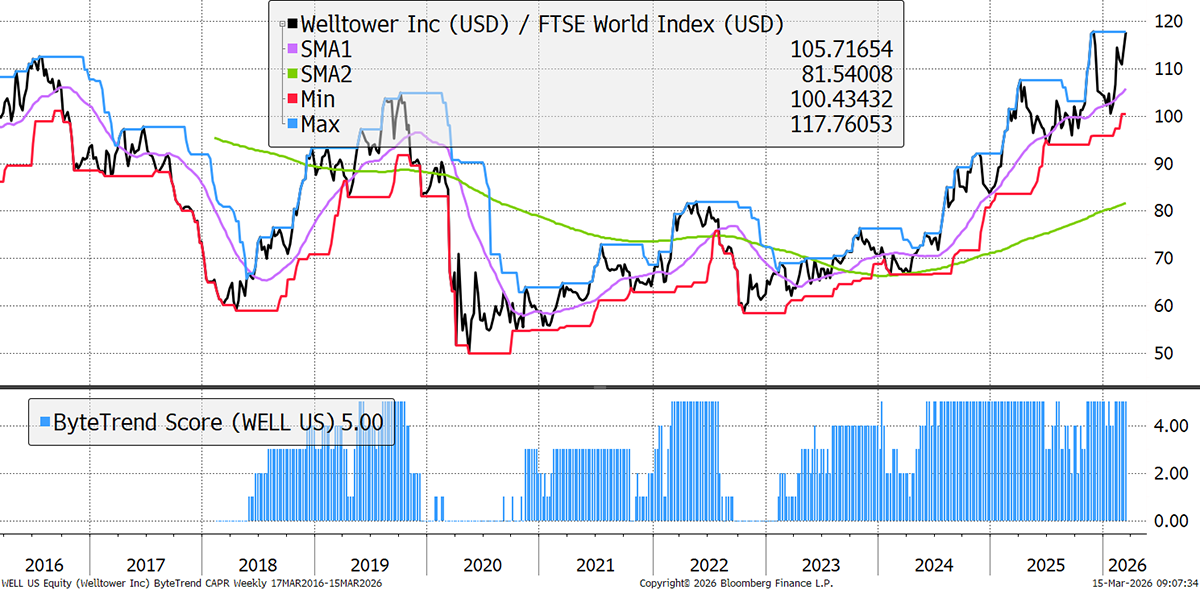
| Welltower Inc. | 24 | 145 | OV | High |
| Chubb Limited | 19 | 129 | FV | Good |
| China Shenhua Energy Company Limited | 23 | 123 | Exp | Low |
| Mitsubishi Corporation | 28 | 121 | Exp | Good |
| Petróleo Brasileiro S.A. - Petrobras | 30 | 119 | OV | Neg |
| HCA Healthcare, Inc. | 20 | 119 | OV | Good |
| McKesson Corporation | 30 | 116 | OV | High |
| Delta Electronics, Inc. | 45 | 112 | Exp | Good |
| CME Group Inc. | 19 | 112 | OV | Good |
| Canadian Natural Resources Limited | 25 | 101 | OV | Med |
| Vertiv Holdings Co | 53 | 99 | Exp | High |
| Westpac Banking Corporation | 16 | 98 | OV | Good |
| Western Digital Corporation | 59 | 92 | Exp | Good |
| The Williams Companies, Inc. | 23 | 90 | Exp | Neg |
| BAE Systems plc | 37 | 89 | Exp | Med |
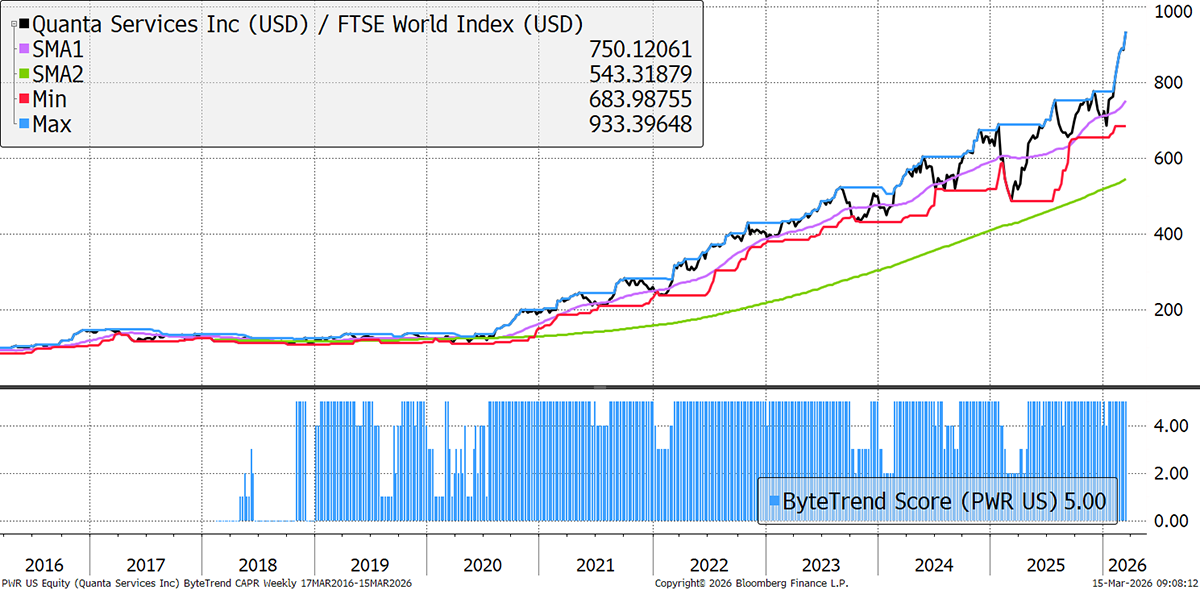
| Quanta Services, Inc. | 26 | 84 | Exp | High |
| Eni S.p.A. | 21 | 75 | OV | Neg |
| Kinder Morgan, Inc. | 19 | 74 | OV | Low |
| Suncor Energy Inc. | 21 | 71 | OV | Neg |
| Valero Energy Corporation | 35 | 70 | OV | Neg |
| Phillips 66 | 31 | 69 | OV | Neg |
| Marathon Petroleum Corporation | 36 | 68 | OV | Neg |
| The Travelers Companies, Inc. | 20 | 67 | FV | Good |
| L3Harris Technologies, Inc. | 20 | 67 | OV | Med |
| Singapore Telecommunications Limited | 19 | 64 | OV | High |
| Imperial Oil Limited | 33 | 60 | OV | Neg |
| E.on Se | 21 | 60 | OV | High |
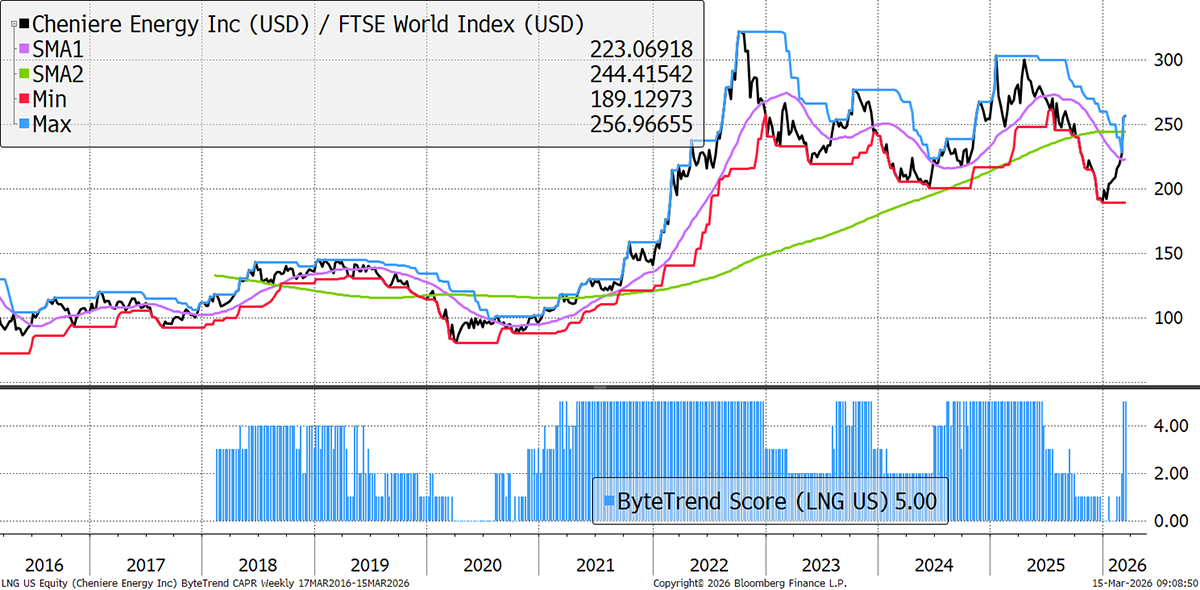
| Cheniere Energy, Inc. | 25 | 54 | FV | High |
| Targa Resources Corp. | 28 | 52 | Exp | Good |
| Hanwha Aerospace Co., Ltd. | 66 | 51 | Exp | High |
| Cardinal Health, Inc. | 30 | 51 | OV | Low |
| Sumitomo Electric Industries, Ltd. | 48 | 51 | Exp | High |
| China Hongqiao Group Limited | 37 | 50 | Exp | Med |
Welltower
Welltower is a healthcare REIT with a heavy skew to housing for seniors. It is currently in a strong growth phase driven by acquisitions and operational recovery, and 2025 showed re-acceleration with revenue up to the mid‑30s. Demographics are supportive, and it has minimal risk from AI or the Middle East conflict.
Quanta
Quanta is a leading speciality contractor focused on grid modernisation, renewables, and data‑centre/AI infrastructure, compounding at a high growth rate with a record backlog. In 2025, their revenue grew by 20% to $28.5bn. AI is an opportunity and not a threat, and the Iran War may accelerate the adoption of fossil fuel alternatives, but as a result, it already trades on rich valuation multiples.
Cheniere Energy
Cheniere is the dominant US Liquefied Natural Gas (LNG) exporter and a key beneficiary of the oil crisis that continues to develop. They already saw strong sales and earnings growth in 2025, and the last fortnight is expected to boost that momentum. Gas-fired power generation is also a beneficiary of the AI rollout if data centres continue to drive power demand growth.
New Leading Trends
These stocks are trading at the 30-week CAPR highs with a ByteTrend Score of 5, except they are new trends this week, having previously had a score below 5. All charts shown are CAPR rebased to 100.
| Name | Annual Vol 30w | Mkt Cap $Bn | Value | Growth |
| Costco Wholesale Corporation | 21 | 447 | OV | Good |
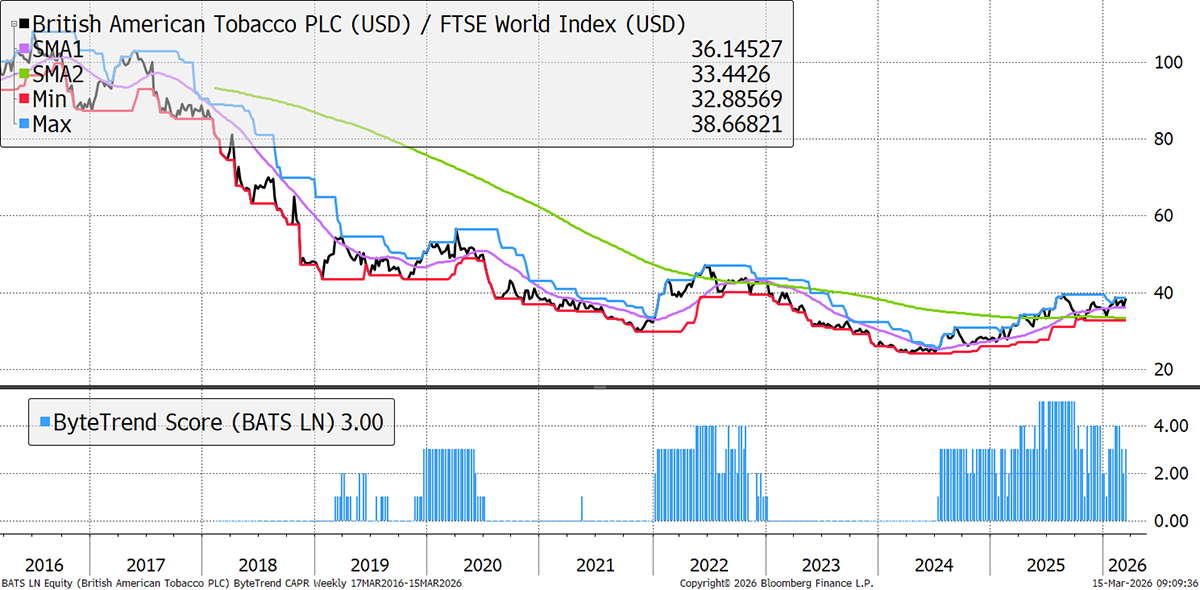
| British American Tobacco p.l.c. | 25 | 129 | OV | Neg |
| Altria Group, Inc. | 24 | 114 | FV | Med |
| BP p.l.c. | 23 | 109 | OV | Neg |
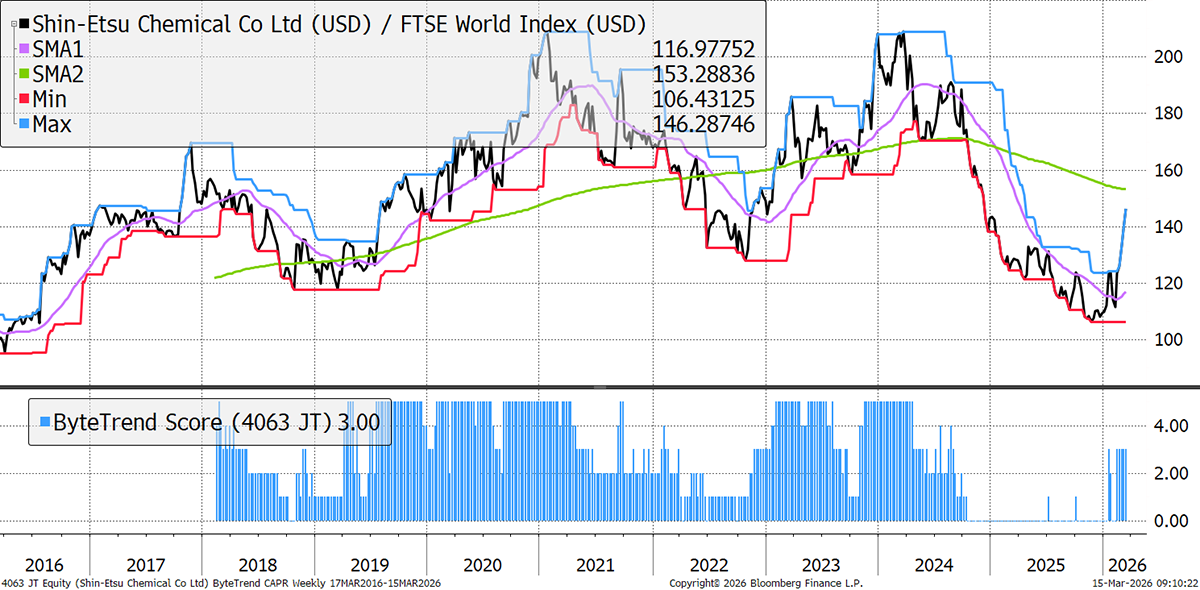
| Shin-Etsu Chemical Co., Ltd. | 30 | 77 | OV | Med |
| RWE AG | 25 | 47 | OV | Good |
British American Tobacco
BATS, the global tobacco group, is in slow‑growth, high‑cash-flow mode. However, its smoke-free range is growing quite well, and its incredibly steady demand makes it a valuable safe haven during crises like the current one.
Shin-Etsu Chemicals
Shin-Etsu, based in Japan, is a leading global silicon‑wafer, fertiliser and speciality chemical producer. Both businesses are cyclical, and chemicals in particular have been weak until the start of this year.
Emerging Trends
These stocks are trading at the 30-week CAPR highs with a ByteTrend Score of less than 5. They don’t have to be in an uptrend, just emerging. All charts shown are CAPR rebased to 100.
| Name | Annual Vol 30w | Mkt Cap $Bn | Value | Growth |
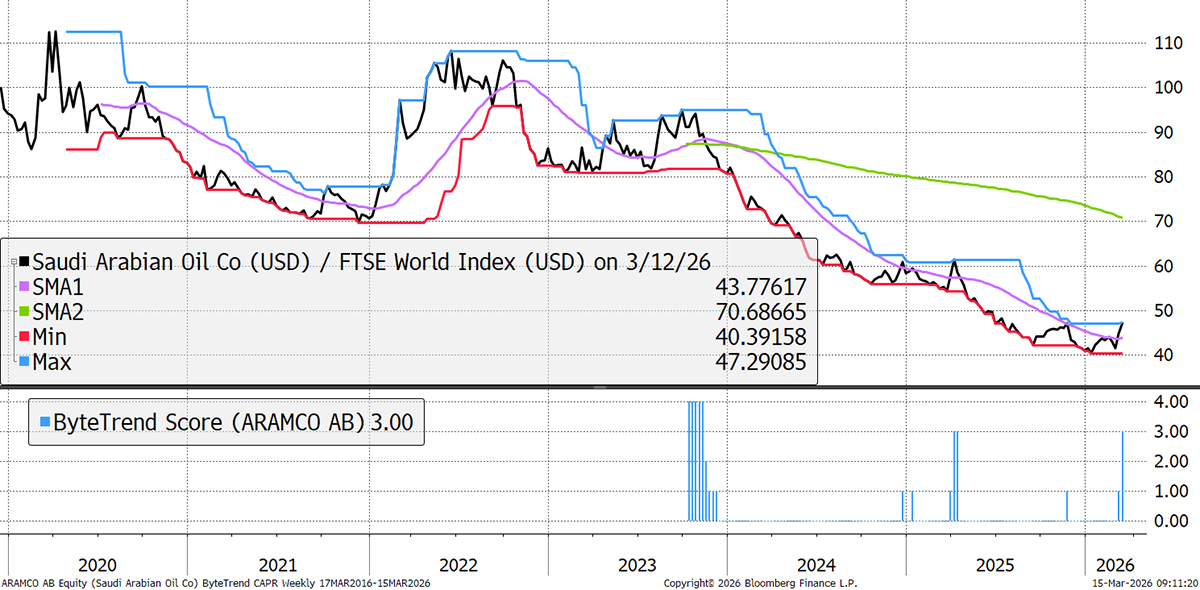
| Saudi Arabian Oil Company | 16 | 1731 | FV | Neg |
| Johnson & Johnson | 19 | 582 | OV | Good |
| Chevron Corporation | 18 | 394 | OV | Neg |
| The Coca-Cola Company | 16 | 333 | OV | Low |
| McDonald's Corporation | 13 | 233 | FV | Med |
| Linde plc | 20 | 229 | OV | Med |
| Verizon Communications Inc. | 24 | 217 | FV | Low |
| NextEra Energy, Inc. | 21 | 193 | FV | Good |
| Pfizer Inc. | 28 | 151 | Val | Med |
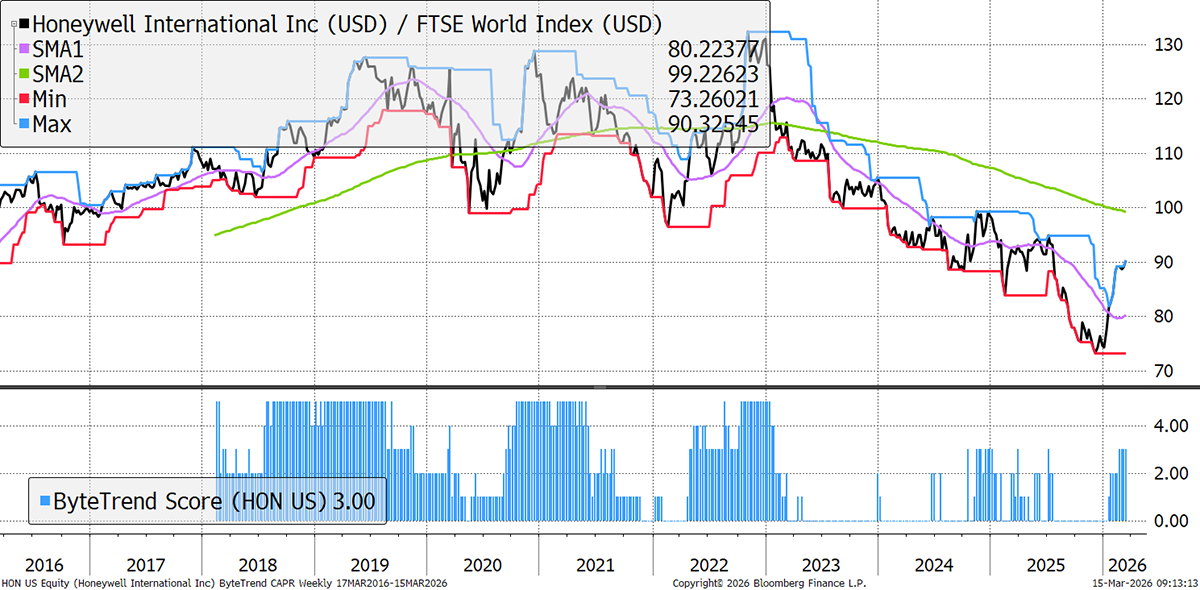
| Honeywell International Inc. | 22 | 149 | OV | Med |
| ConocoPhillips | 26 | 149 | OV | Neg |
| Bristol-Myers Squibb Company | 25 | 120 | Val | Med |
| Enbridge Inc. | 16 | 118 | OV | Good |
| Starbucks Corporation | 31 | 113 | OV | Neg |
| Duke Energy Corporation | 15 | 104 | FV | Good |
| Equinix, Inc. | 24 | 95 | FV | Good |
| National Grid plc | 16 | 90 | OV | Good |
| Equinor ASA | 27 | 87 | OV | Neg |
| Glencore plc | 30 | 80 | Exp | Neg |
| Alimentation Couche-Tard Inc. | 29 | 78 | FV | Med |
| EOG Resources, Inc. | 23 | 72 | FV | Neg |
| American Electric Power Company, Inc. | 19 | 72 | FV | Med |
| TC Energy Corporation | 18 | 66 | OV | High |
| Sempra | 23 | 62 | OV | Low |
| Digital Realty Trust, Inc. | 24 | 62 | FV | High |
| Realty Income Corporation | 15 | 60 | FV | Med |
| Occidental Petroleum Corporation | 28 | 57 | OV | Neg |
| Takeda Pharmaceutical Company Limited | 20 | 56 | OV | Neg |
| Dominion Energy, Inc. | 20 | 56 | FV | Good |
| ONEOK, Inc. | 23 | 54 | FV | Med |
| Corteva, Inc. | 21 | 53 | OV | High |
| Diamondback Energy, Inc. | 25 | 52 | FV | Neg |
| Xcel Energy Inc. | 21 | 51 | FV | Med |
| Exelon Corporation | 20 | 51 | OV | Med |
Saudi Arabian Oil Company
Saudi Aramco, which floated to much fanfare, has underperformed ever since. It is a major oil laggard, which is directly threatened by conflict in the Middle East, reducing its ability to benefit fully from the oil price spike right away. If the attacks on Gulf neighbours slow, Aramco would be in a better position.
Honeywell
Honeywell, the diversified industrial/technology group, reported strong results and a growing backlog, with free cash flow jumping 50% in its most recent quarter. Growth is particularly strong in its building automation segment, as well as aerospace and defence.
Weakening
These stocks are trading at the 30-week CAPR lows with a ByteTrend Score above 0. They are weakening trends but not yet downtrends. All charts shown are CAPR rebased to 100.
| Name | Annual Vol 30w | Mkt Cap $Bn | Value | Growth |
| JPMorgan Chase & Co. | 22 | 764 | FV | Good |
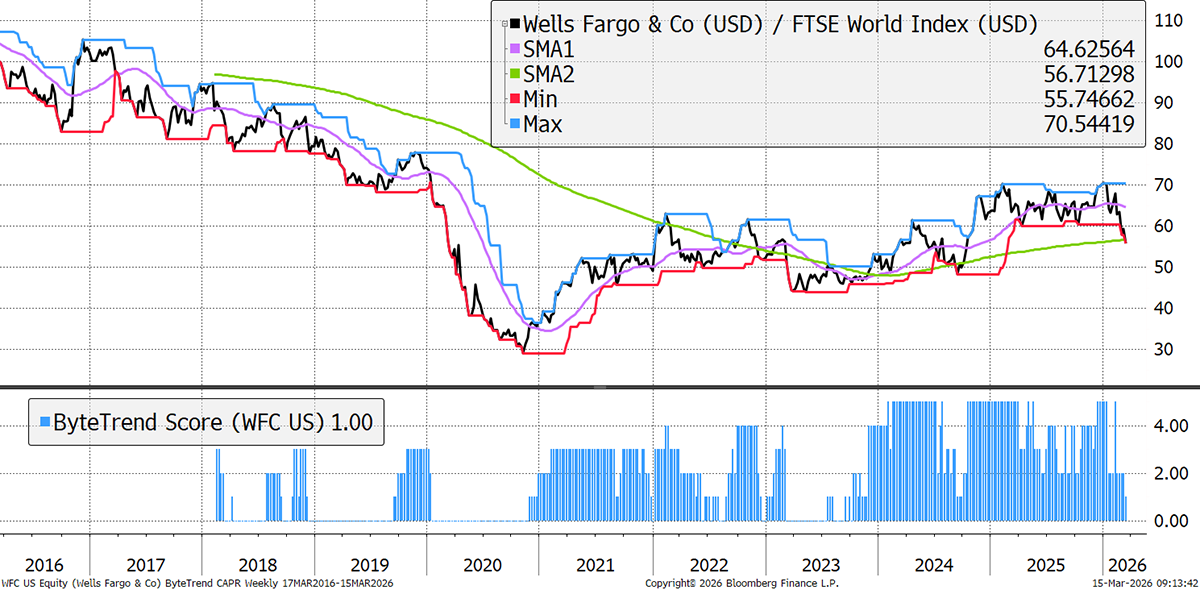
| Wells Fargo & Company | 30 | 233 | FV | Good |
| Hermès International | 25 | 225 | FV | Good |
| SAP SE | 24 | 223 | FV | High |
| Siemens AG | 23 | 198 | OV | Good |
| Airbus SE | 22 | 152 | FV | Good |
| BlackRock, Inc. | 24 | 144 | FV | Med |
| SoftBank Group Corp. | 63 | 128 | OV | Med |
| UBS Group AG | 25 | 114 | OV | High |
| Capital One Financial Corporation | 28 | 112 | OV | Low |
| Bharti Airtel Limited | 18 | 111 | Exp | High |
| EssilorLuxottica S.A. | 31 | 109 | FV | Med |
| Boston Scientific Corporation | 35 | 103 | FV | High |
| Intesa Sanpaolo S.p.A. | 23 | 103 | OV | High |
| MercadoLibre, Inc. | 39 | 85 | Chp | High |
| TransDigm Group Incorporated | 24 | 69 | OV | High |
| Nu Holdings Ltd. | 35 | 67 | FV | High |
| CRH plc | 29 | 67 | OV | Med |
| Carvana Co. | 61 | 65 | FV | Good |
| TE Connectivity Ltd. | 29 | 59 | OV | Good |
| Deutsche Bank AG | 30 | 56 | OV | High |
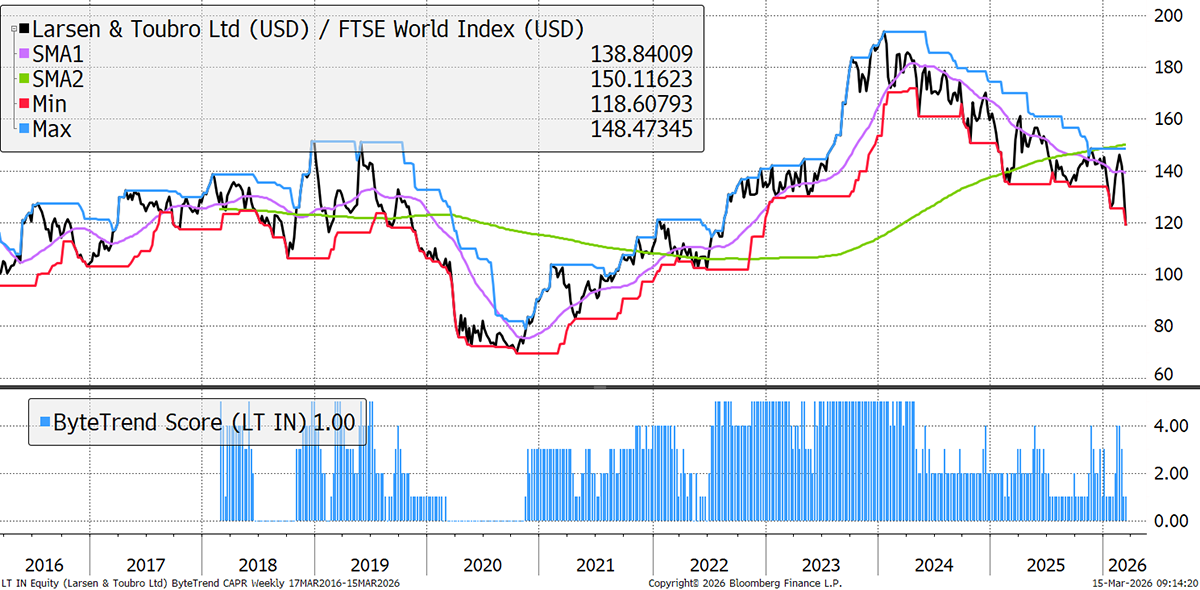
| Larsen & Toubro Limited | 27 | 51 | OV | Med |
Wells Fargo
US banking has taken a hit in recent weeks, and Wells Fargo is no exception. Its Q4 results in January were fine but not outstanding, and after a strong run, there has been some profit-taking. At least the fake accounts scandal, involving SEC and DOJ litigation, is now over.
Larsen & Toubro
Larsen & Toubro is India’s leading engineering and construction conglomerate. Broader index weakness has recently been compounded by a disappointing earnings report and broader concerns around its execution. Uncertainty created by the Iran war won’t help its customers’ spending plans, which will impact them directly as 75% of their current order book is from the Middle East.
Bear Trends
These stocks are trading at the 30-week CAPR lows with a ByteTrend Score of 0. They are in a downtrend. All charts shown are CAPR rebased to 100.
| Name | Annual Vol 30w | Mkt Cap $Bn | Value | Growth |
| Bank of America Corporation | 24 | 341 | FV | Good |
| LVMH Moët Hennessy | 31 | 270 | Val | Low |
| L'Oréal S.A. | 24 | 216 | FV | Med |
| The Walt Disney Company | 17 | 176 | Val | High |
| Thermo Fisher Scientific Inc. | 34 | 173 | FV | Med |
| QUALCOMM Incorporated | 32 | 139 | Val | Med |
| HDFC Bank Limited | 15 | 136 | Val | High |
| Danaher Corporation | 33 | 132 | FV | Neg |
| Stryker Corporation | 22 | 129 | FV | Good |
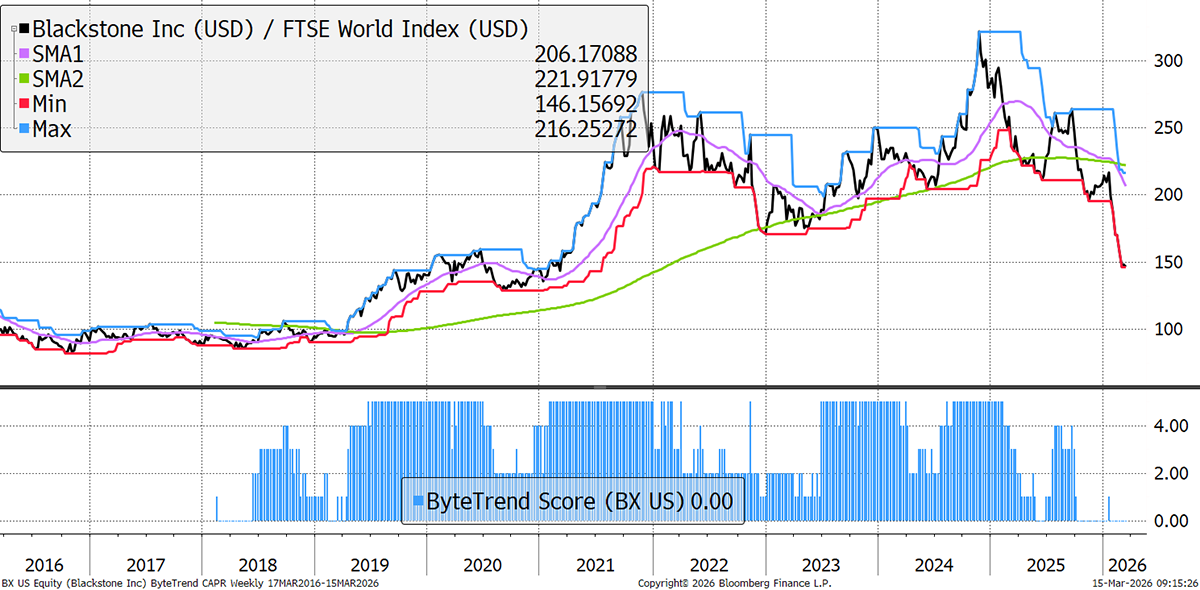
| Blackstone Inc. | 30 | 128 | FV | Good |
| Accenture plc | 30 | 122 | Val | Med |
| Medtronic plc | 20 | 112 | FV | Low |
| Sanofi | 26 | 106 | Val | Low |
| ICICI Bank Limited | 17 | 97 | FV | High |
| Christian Dior SE | 30 | 95 | Val | Neg |
| Tata Consultancy Services Limited | 23 | 94 | Val | Med |
| NIKE, Inc. | 34 | 80 | Val | Neg |
| Brookfield Asset Management Ltd. | 21 | 70 | High | |
| Nongfu Spring Co., Ltd. | 26 | 62 | Val | Med |
| Bajaj Finance Limited | 27 | 57 | ||
| Hindustan Unilever Limited | 18 | 55 | FV | Med |
| Infosys Limited | 27 | 55 | FV | Good |
| Merck KGaA | 34 | 54 | Val | Neg |
| Volkswagen AG | 28 | 52 | Val | Neg |
| Zoetis Inc. | 30 | 51 | Val | Good |
| Sea Limited | 39 | 51 | Chp | High |
| PT Barito Renewables Energy Tbk | 41 | 50 | Val | Med |
| Siemens Healthineers AG | 25 | 50 | Val | Med |
Blackstone
Private credit worries are growing, and headlines are multiplying as valuations and interconnections in the sector come under increasing scrutiny. It has a high exposure to the Gulf region, including data centres, which have entered Iran’s crosshairs. The challenges are mounting, and no one is 100% sure what’s inside the black box that is private credit.
Danaher
Danaher is one of the great companies, founded in 1984 by brothers Steven and Mitchell Rales. They turned a former REIT into a global life sciences and technology leader, pursuing acquisitions and continuous improvement. As a result, it spent much of the last few years at record valuation multiples, while returns on capital aren’t quite what they were in the pre-2010 era.

GTI 200 Spreadsheet
We are pleased to share the GTI 200 spreadsheet. Download the spreadsheet below to view the CAPR and local currency scores, and more, for the world’s largest 200 stocks. Have a look at the different groups and the main list “All stocks”. The Insights tab is interesting, and don’t forget to expand the columns by clicking on the “+” at the top of the page if you want to see more trend data.
Outlook
The World Index is falling, and the signs of stress are clear. No doubt there will be some bullish announcements from the White House, but the reality is that global trade is bunged up and will take time to clear. In the meantime, there is no shortage of things that could go wrong. Don’t ignore digital.
Thanks for reading GTI.


