


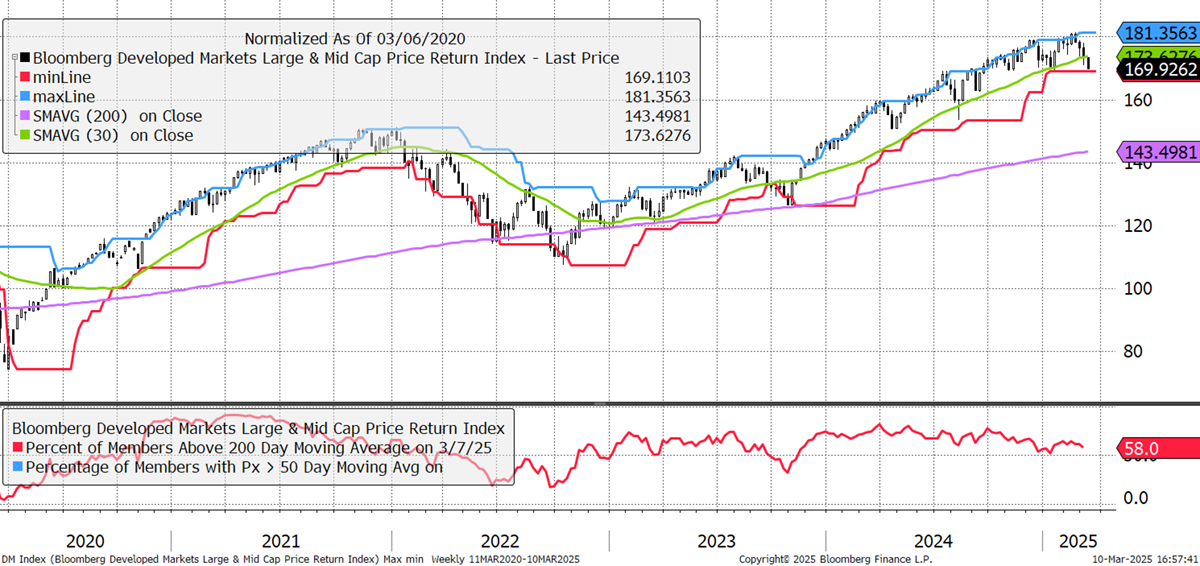
A few stocks have done spectacularly well this year, mainly in Europe. Breadth is down to 58%, which means strong trends are getting rarer, and many stocks have deteriorated in recent weeks. The developed markets index is challenging the 20-week low from what was a very overbought position.
World Index – Developed Markets
Sometimes, there’s a big difference between price and price relative, and this week is a good example. The divergence in performance between the EuroStoxx (+15%) and the S&P 500 (-4%) has been staggering this year, with a 19% difference in USD.
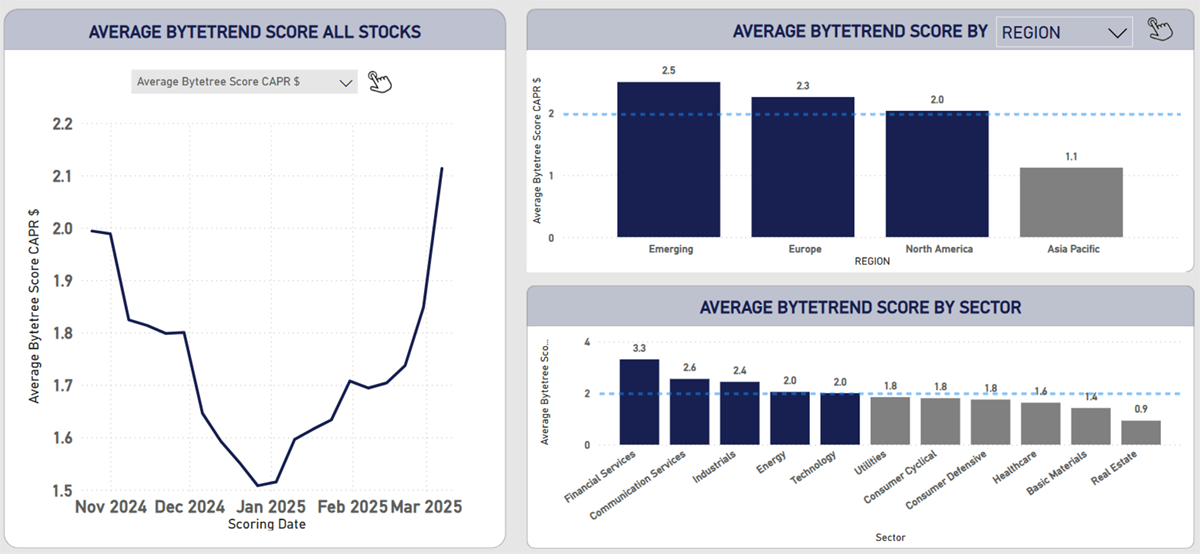
First, I show the price relative, or ByteTree’s Currency-Adjusted Price Relative (CAPR), which shows the emerging markets (Turkey in this test run) are doing well. But most importantly, Europe has overtaken the USA. The strongest sectors are finance, telecoms, which featured heavily last week, and industrials. Real estate remains weak.
Currency-Adjusted Price Relative
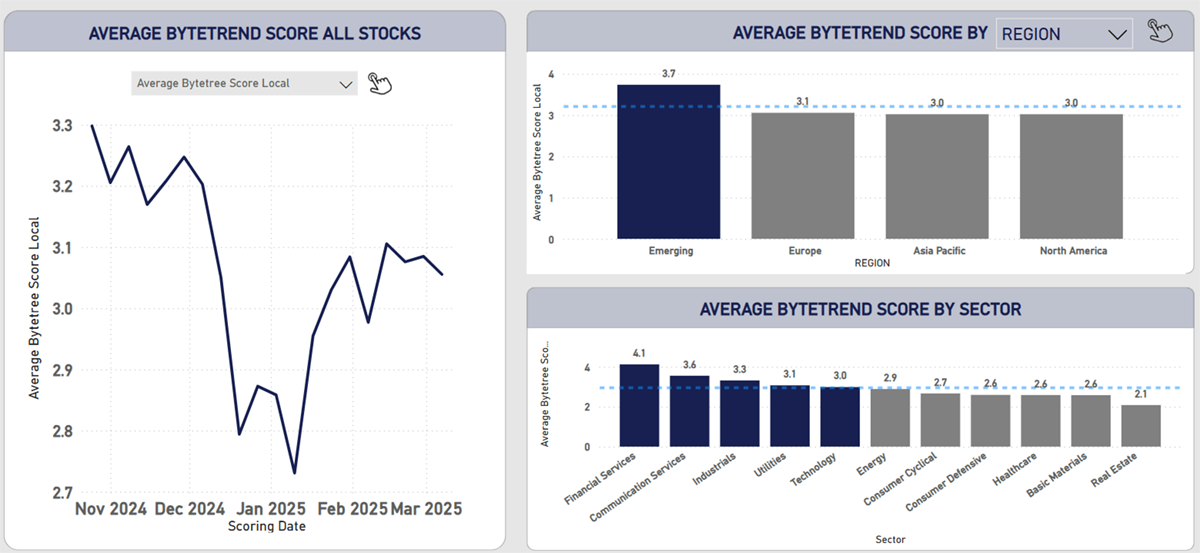
Change from CAPR to price, and what was bullish now looks bearish. There are fewer trends out there, and stock pickers need to be more selective and think more about risk than return.
Price
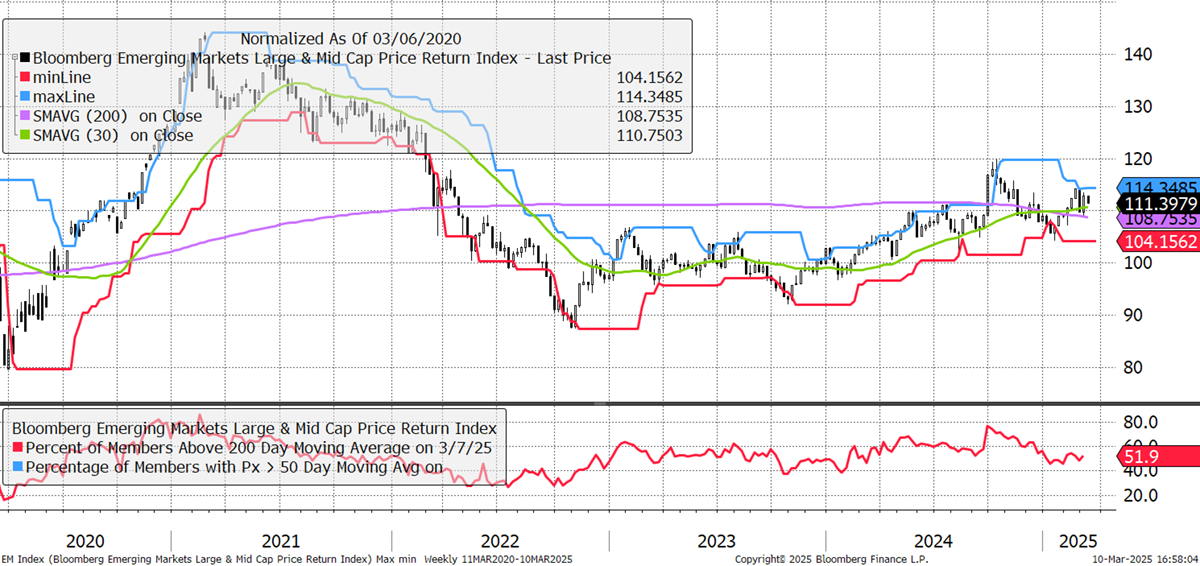
Emerging markets are in a completely different position. Whereas the DM index is up 70% over 5 years, the EM index is up just 11%. Breadth is rising, albeit slowly, and it looks like a bull market in the making. A significant change is upon us.
World Index – Emerging Markets
This issue covers the top 200 stocks in the developed markets. We have analysed the trends, and now we discuss the highlights.
New Trends
Criteria
- % Dev from 30W High CAPR = 0%
- ByteTrend Local currency = 5
- ByteTrend CAPR = 5
- Cumulative Highs in 12W sort low to high
These stocks are trading at four-year highs in both price and CAPR. They do not need to be trading at all-time highs. Unlike the next list, Strong Trends with New Highs, new trends are in their first week with the same criteria. All charts shown are CAPR rebased to 100.


