About GTI
The Global Trends Investor (GTI) reports are designed with professionals and advanced private investors in mind. Many of the concepts have been developed in-house and are not widely used in the market.
The goal of the design and layout of the reports was usefulness first and speed second. Little time or space is wasted on explanations – we want to bring you the trends, as they are, as efficiently as possible. As such, we have put together this User Guide to help you get up to speed.
The report is published on Mondays, informing you of the latest trends for 200 global stocks using the data from Friday’s market close. GTI maps out the world’s leading and lagging stocks with the goal of triggering stock ideas to research and flagging shifting trends at the sector/geography level. You’ll know if Asian banks are rising in unison, or US software companies have been underperforming the world index, and which companies are doing well and which are not. It’s all about the stocks, but when you see groups moving together or coming up week after week, that’s valuable context, too.
The service revolves around a single factor: momentum.
Momentum investing is a repeatable process which removes emotion from decision-making. It is a systematic approach, and the signals are based on hard facts rather than opinions. That is, what stocks are actually doing, not what people think they should do.
The beauty of momentum investing is its simplicity and the logic that underpins it. My analogy is that as a spectator of the London Marathon, you watch 50,000 people rush by. Instead, if you could watch from a helicopter travelling at the average speed, most runners would appear to be standing still. The winners would be moving forward, and the losers backwards. This is how a momentum investor views the global stockmarket, where the focus is on the winners. This has nothing to do with whether the market is rising or falling but which stocks are leading and lagging the pack.
The key concept is CAPR – Currency Adjusted Price Relative. This is a system of charting where the stock or asset is shown relative to the world index. There are two points here. The first is adjusting for currency so that any stock price trend from around the world is first converted into US dollars. Secondly, it is measured relative to the world index, which is also priced in dollars. That means CAPR has no units and is a ratio. That means it applies to global investors equally.
Please note: all charts shown are CAPR rebased to 100.
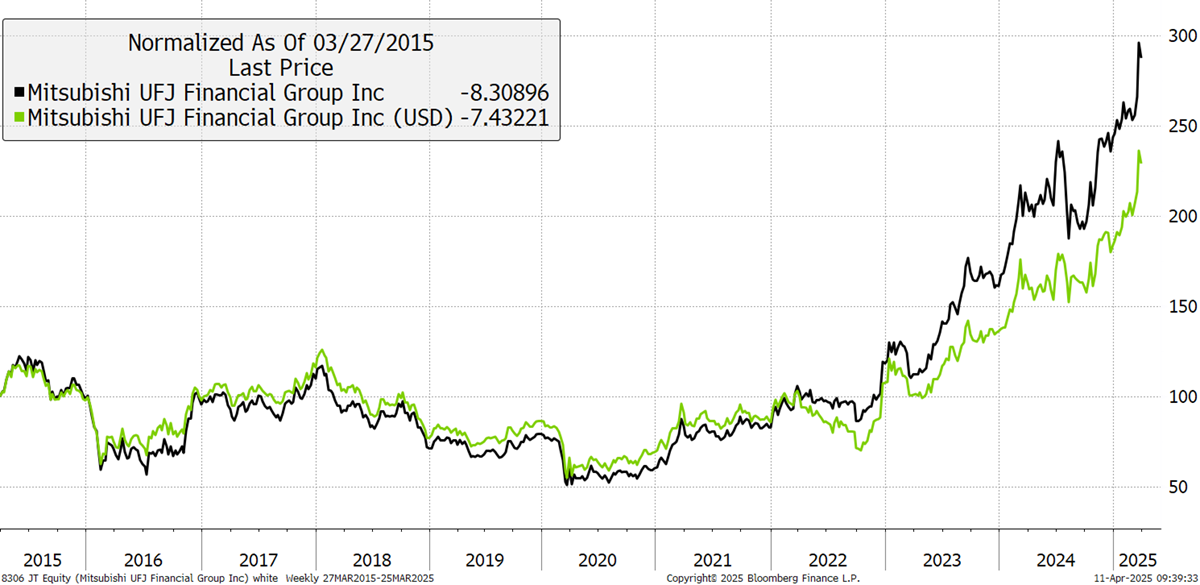
In this example, I show Mitsubishi UFJ (8306 Japan) in yen (black) and in US dollars (green). The difference is the change in the dollar-yen over the period.
Example: Mitsubishi UFJ Conversion to US Dollars
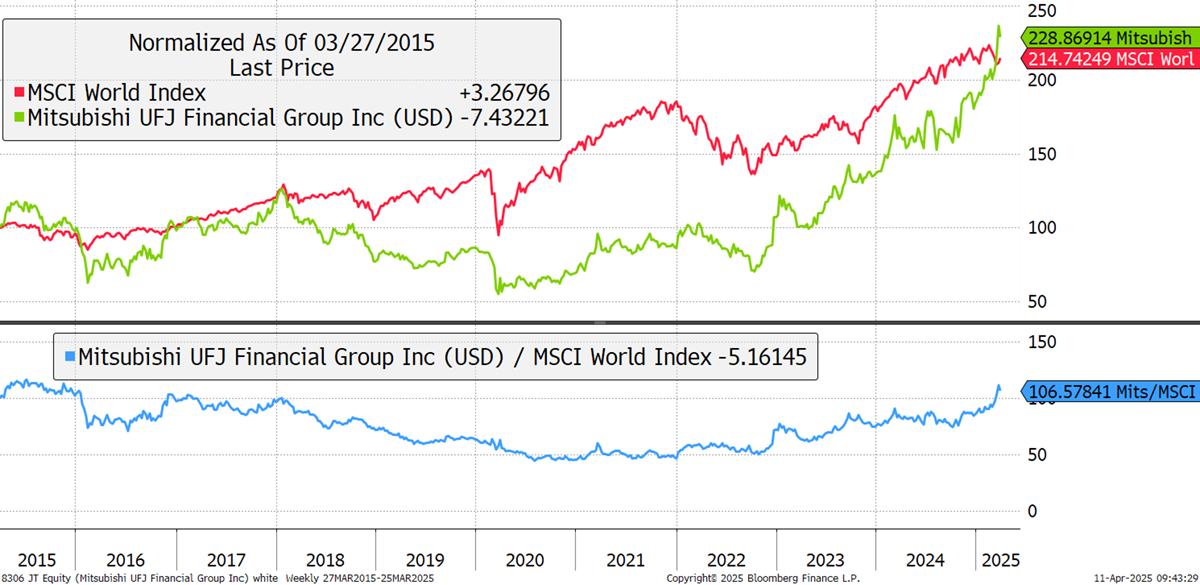
Now, in the chart below, take the share price in USD (green) and compare it to the World Stockmarket index (red). The lower line (blue) is the CAPR, which is the difference between the two lines, or more accurately, the share price in USD divided by the world index in USD. The CAPR line (blue) for Mitsubishi UFJ shows that it lagged the world index from 2015 to 2020 and started to outperform afterwards. The current CAPR level is 106.6. It started at 100 in 2015, which means Mitsubishi UFJ has beaten the world index by 6.6% since 2015 in dollar terms. Our charts are rebased to 100 at the start, so the final value shows the level of performance relative to the market. In this case, Mitsubishi UFJ has beaten the market by 6.6% over 10 years.
Example: Mitsubishi UFJ CAPR
It is a useful skill to be able to identify the stocks that are beating the world Index, but not everyone can do so confidently, which is why I created ByteTrend. It is a simple expression of trends using numbers. That is, for a strong chart that is beating the world index, ByteTrend labels it as a 5, and a weak chart that is lagging as a 0.
ByteTrend and the CAPR Framework
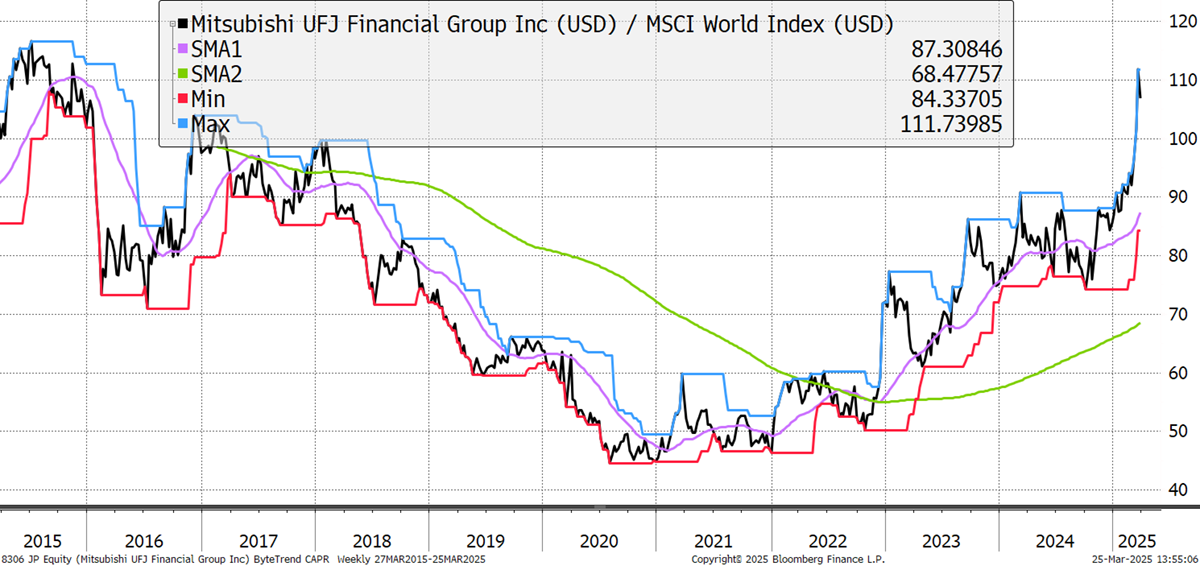
ByteTrend provides an unbiased measure of trends with the aim of identifying strong and weak trends. To do this, I have added a 200-week moving average (green) and a 30-week moving average (purple). I have also added 20-week max (blue) and min (red) lines. In the chart below, the price (CAPR) is following the max, with the min line showing the lowest price point over the previous 20 weeks. The moving averages measure the long- and medium-term trend, and the max/min lines measure the short-term. This is a bullish chart because it is rising, and that can be measured very simply.
Example: Mitsubishi UFJ CAPR and ByteTrend Framework
ByteTrend scores a point if:
- The price is above the long-term moving average (200-week).
- The price is above the short-term moving average (30-week).
- The long-term moving average is rising.
- The short-term moving average is rising.
- The price last touched max on the 20-week max/min lines.
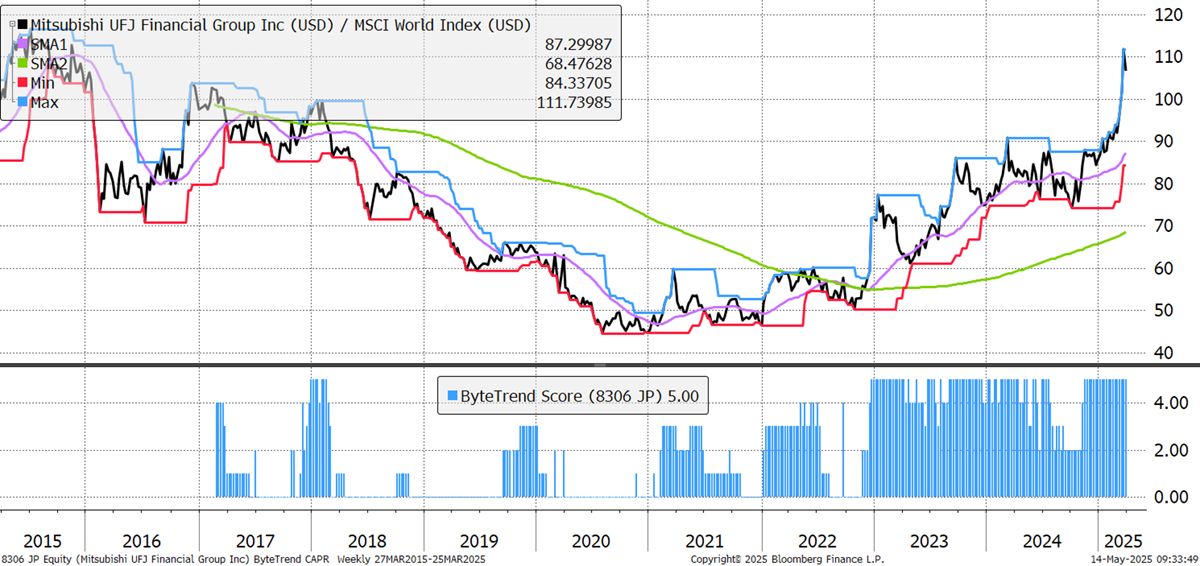
Back to Mitsubishi UFJ, the price is above both moving averages, the moving averages are upward-sloping, and the last max/min touch was a max. This chart has a ByteTrend score of 5. The history of the score is on the lower chart (below).
Example: Mitsubishi UFJ CAPR and ByteTrend Score
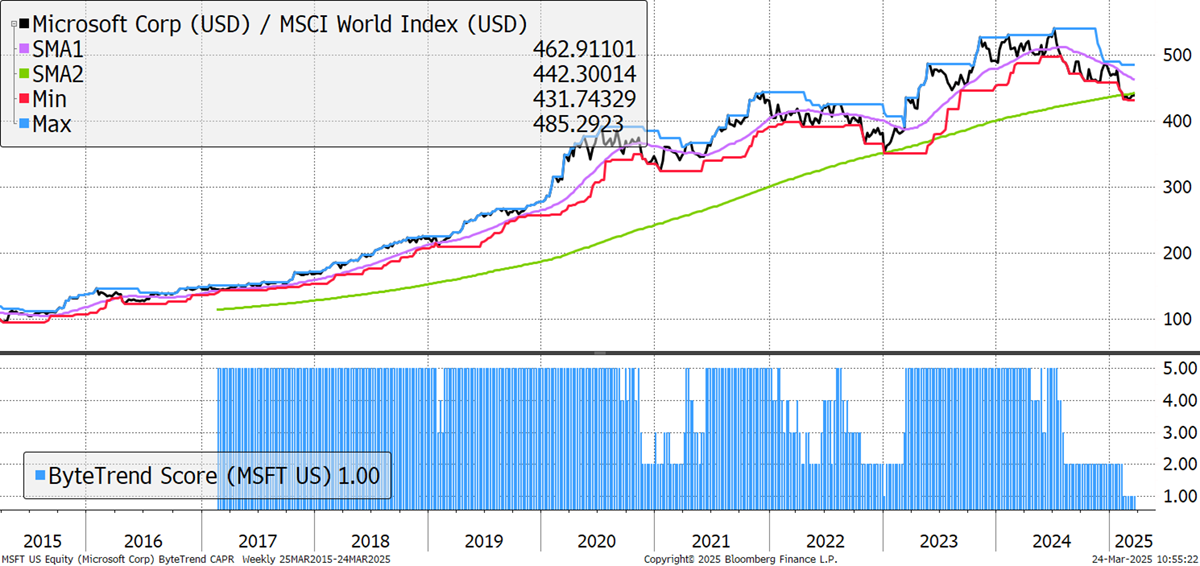
In the next example, I show Microsoft in CAPR. This time, the price is below both moving averages, the 30-week moving average is falling, and the 200-week is rising. The last touch of the max/min lines was a min. This makes the ByteTrend score 1.
Example: Microsoft CAPR and ByteTrend Score
The basis for momentum investing is that strong trends can do well for sustained periods, although that is not always the case. But by seeking out strength as opposed to weakness, your chances of finding success are much higher. That is the thinking and functionality behind the research. I would point out that value investors can ignore trends and focus on low prices in the knowledge they understand the company’s true value. Momentum investing does not conflict with that idea, and thoughtful momentum investors should not ignore fundamental analysis. In any event, Global Trends Investor helps to explain what is driving markets.
Types of Trends
The GTI report is split into four types of trends: Leading and Emerging, Weakening and Bear. I will take you through each one below.
Leading Trends with New Highs
Criteria:
- CAPR is at a 30-week high (% Dev from 30W High CAPR = 0)
- ByteTrend CAPR Score = 5
These stocks are trading at the 30-week CAPR highs, meaning they are exactly at their highest level in CAPR for 30 weeks. They also have a ByteTrend Score of 5, which is a sign of a strong trend relative to the world index, as detailed above.
Emerging Trends
Criteria:
- CAPR is at a 30-week high (% Dev from 30W High CAPR = 0)
- ByteTrend CAPR Score < 5
These stocks are trading at the 30-week CAPR highs with a ByteTrend Score of less than 5. They are not scoring 5 on CAPR, so they are not fully bullish trends but may be heading in that direction. Hence, they are emerging trends.
Weakening Trends
Criteria:
- CAPR is at a 30-week low (% Dev from 30W Low CAPR = 0)
- ByteTrend CAPR Score > 0
These are stocks which are breaking down. They are trading at their 30-week lows in CAPR but have a ByteTrend score above 0 in CAPR, so they aren’t fully bearish trends yet. They are weakening trends.
Bear Trends
Criteria:
- CAPR is at a 30-week low (% Dev from 30W Low CAPR = 0)
- ByteTrend CAPR Score = 0
These are stocks in a continuing downtrend, trading at 30-week lows in CAPR terms, with a ByteTrend score of 0 in CAPR. They are in a downtrend. Weakening trends move here when their ByteTrend score hits 0.
How to Read the Tables
Next, we have the tables, which we have very carefully curated to provide the most useful information in the least amount of space. Here’s an example from testing in March 2025. These are bear trends as the CAPR Score is zero. The deviation column shows they are all trading below the 200-week moving average.
| Ticker | FX | Name | CAPR | Dev | Vol | Cap | Sector | Industry |
|---|---|---|---|---|---|---|---|---|
| 2222.SR | SAR | Saudi Arabian Oil Company | 0 | -17 | 11 | 1,658 | Enrg | O&G Int |
| PEP | USD | PepsiCo, Inc. | 0 | -14 | 20 | 199 | ConDis | Soft Drinks |
| ADBE | USD | Adobe Inc. | 0 | -20 | 34 | 168 | Tech | Software Infra |
| DHR | USD | Danaher Corporation | 0 | -12 | 25 | 151 | Hlth | Med Diag |
| CMCSA | USD | Comcast Corporation | 0 | -14 | 25 | 139 | Comms | Telecoms |
| UPS | USD | United Parcel Service, Inc. | 0 | -32 | 26 | 98.3 | Ind | Logistics |
| CSL.AX | AUD | CSL Limited | 0 | -10 | 16 | 77.1 | Hlth | Biotech |
We show the:
- Ticker
- FX - Currency
- Name - Company name
- CAPR - Currency Adjusted Price Relative score
- Dev - Deviation from the 200-week Moving Average (-ve means the stock is below it, +ve means above)
- Vol - 360-day volatility
- Cap - Market capitalisation in USD billions
- Sector
- Industry
Products
The GTI: Top 200 report highlights interesting situations with brief commentary. It is useful for stock ideas, but also a quick guide to understanding what is driving the global stockmarket.
The full GTI universe of over 2,000 stocks covers both developed and emerging markets and goes beyond the biggest names to identify the lesser-known companies that are breaking up or down or trending strongly below the radar. GTI: Premium is a spreadsheet with no commentary that covers the entire 2,000-stock universe. It is a must-have for advanced investors.
Summary
That concludes the Global Trends Investor User Guide.
If you still have questions or suggestions for how we could make things clearer, more useful, or more efficient, please contact us at gti@bytetree.com.
As always, I thank you for being a ByteTree client.
Many thanks,
Charlie Morris
Founder and CIO, ByteTree