
Gold Breaks $5,000


Issue 50;
- Gold surges
- India slumps
- Watch out for the Yen
In financial markets, money behaves like water, as it will always find somewhere to go, and fill the cracks. That describes relative performance - what is working and what is not. The amount of water in the system describes market performance – are stocks rising or falling?
Global Trends is a deep dive into global equities. The aim of this analysis is to better understand which countries, sectors, industries, and stocks are driving market returns. Not only does it help investors identify opportunities, but it also highlights the risks. We try to condense as much important information as possible, focusing on what really matters each week.
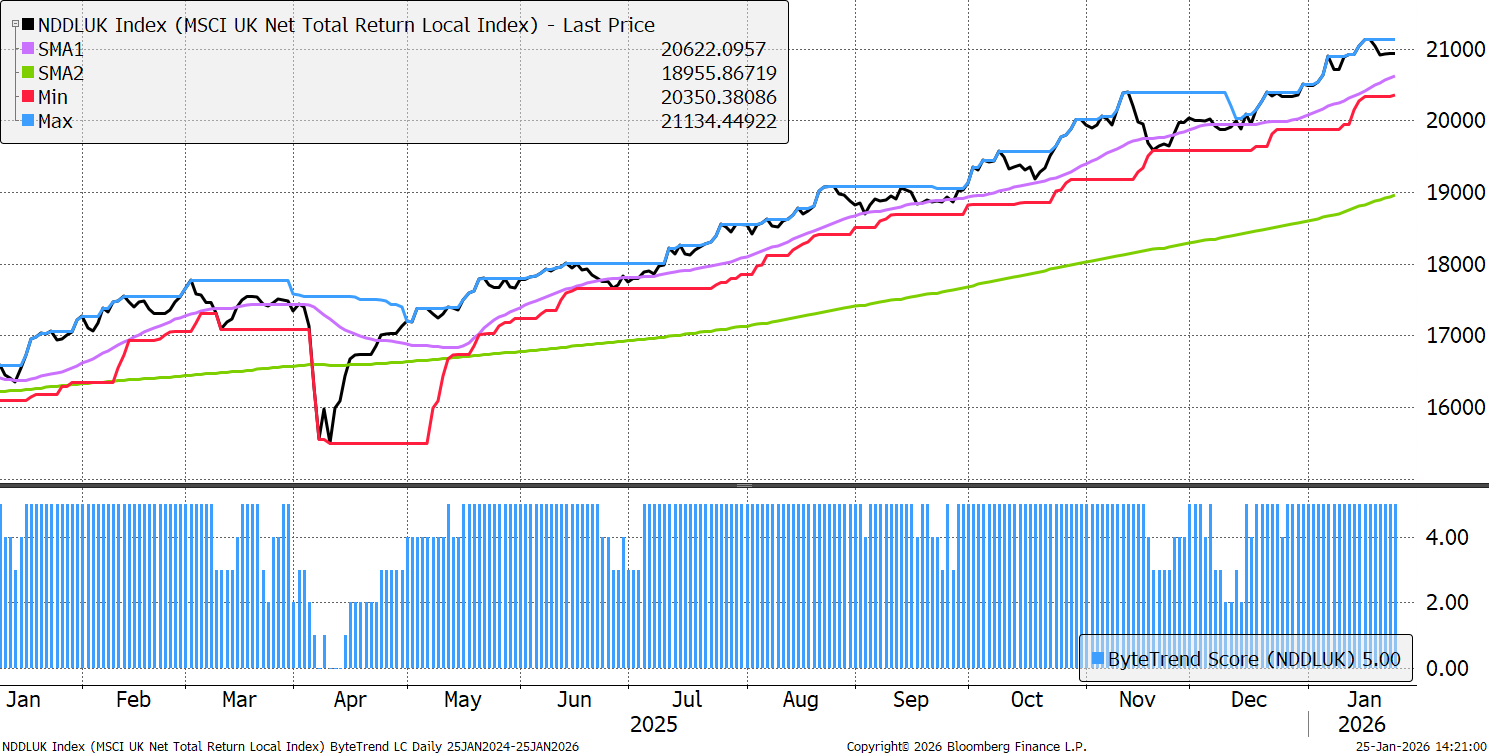
The World Index retains a ByteTrend Score of 5 and looks healthy. It is remarkable how stable this rally has been, although we can thank a weak dollar for that
World Index – Developed Markets – Daily
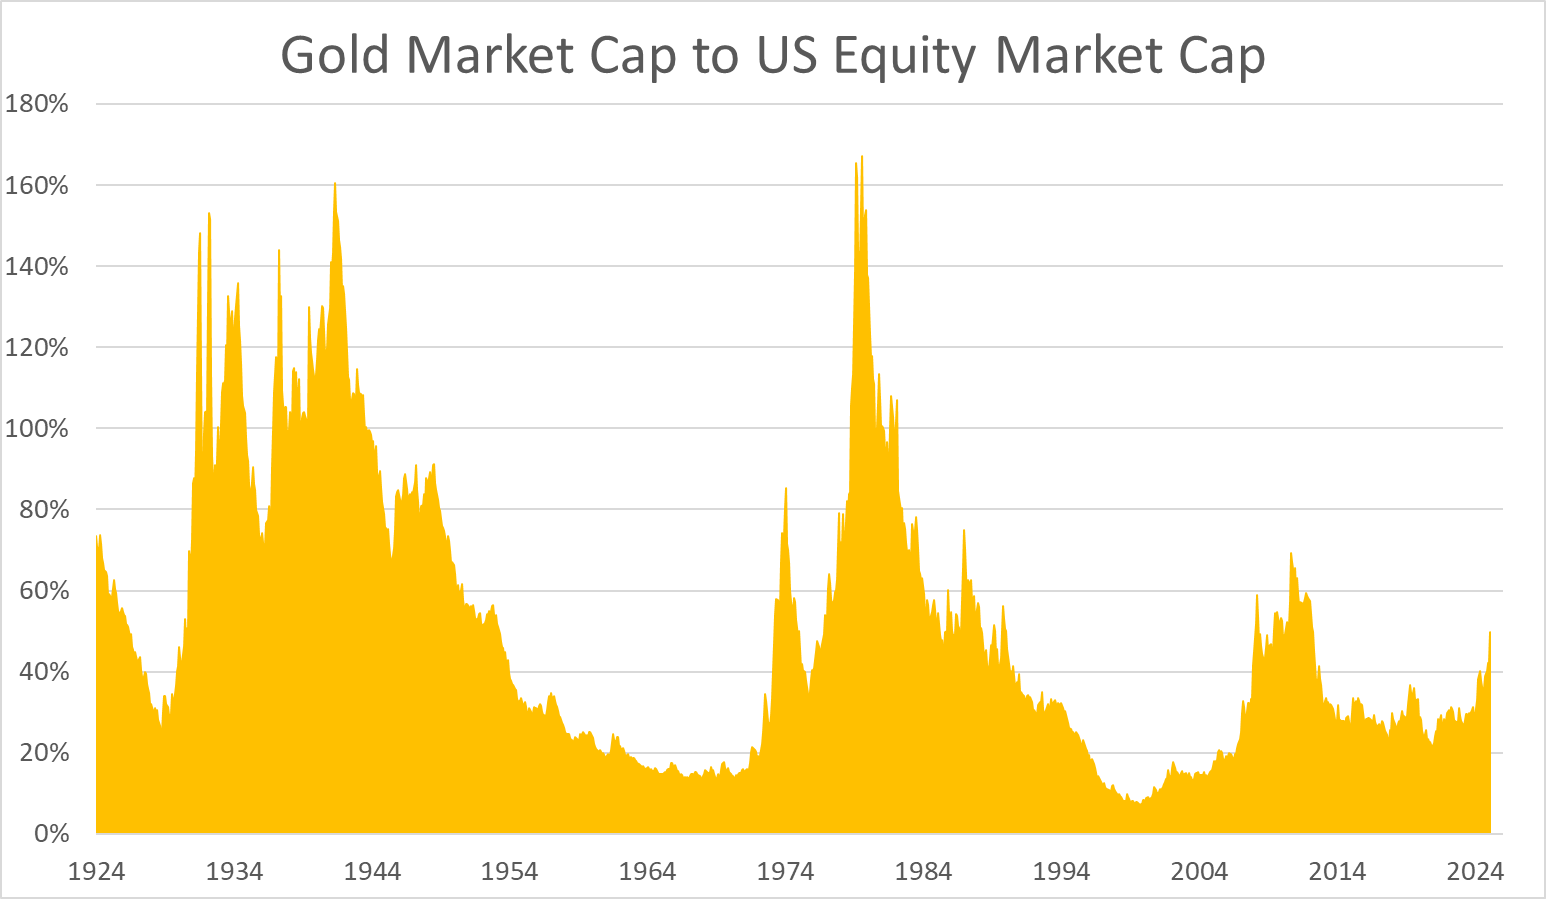
Gold Surge
Gold has broken above $5,000 per ounce, which is remarkable. In front of gold is silver, which at $110 per ounce, is priced 10% higher in Shanghai than in London. Chinese demand is insatiable. The Shanghai-London gold spread is much narrower, but still, demand is high. The worlds’ $36 trillion of gold is now worth 50% of the US stockmarket. Remarkably, that’s not that high. More on gold in my next issue of Atlas Pulse.
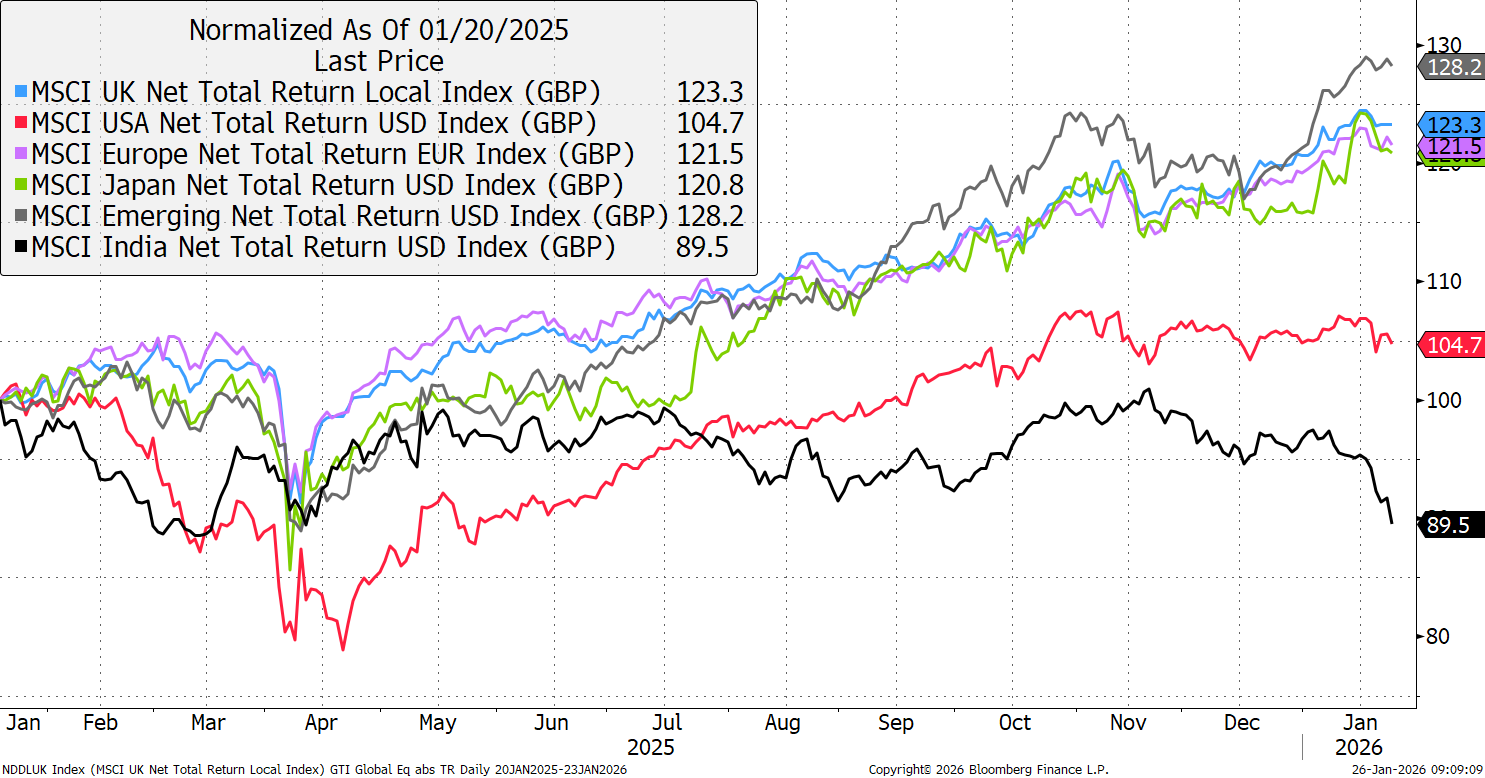
Global Equities
Emerging markets are still in the lead since inauguration day, except for one. The Indian stockmarket is down 10.5%, which is 38.7% behind EM. The currency has been the weakest among major EM nations over the past year. The price of gold in Rupees (not shown) must be the greatest bull market of all time.
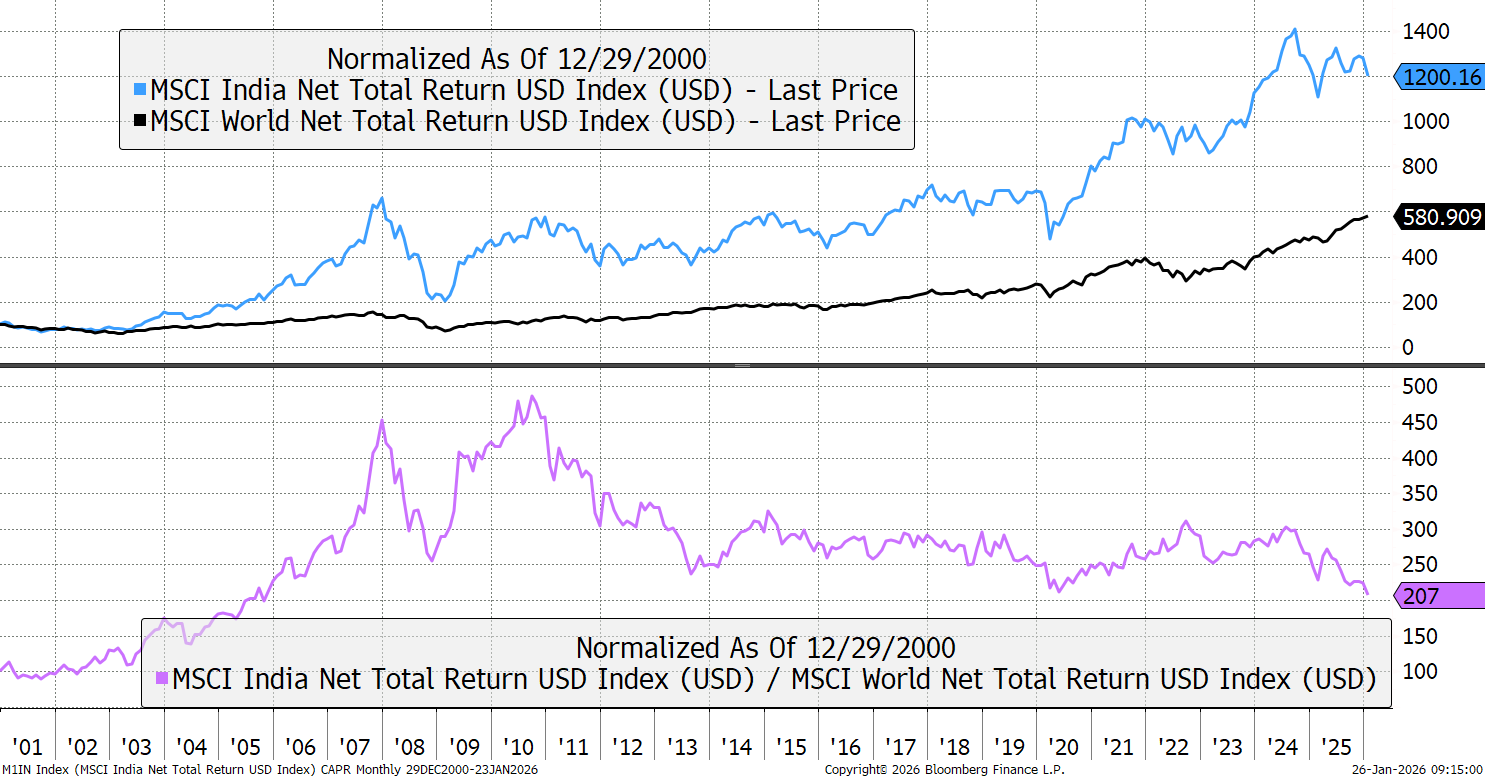
India Relative to The World
Indian stocks have outperformed the world by 2x since 2000. The CAPR peak occurred in 2010 and has been declining again since 2022, just as China started to stabilise. It could be that investors have tactically switched to China and Latin America, out of India, but that wouldn’t impact the Rupee to the extent it has. The Indian economy is growing, and the economic indicators seem healthy. It could just be that this richly valued market is giving up ground. Or maybe something will come out of the woodwork in due course.
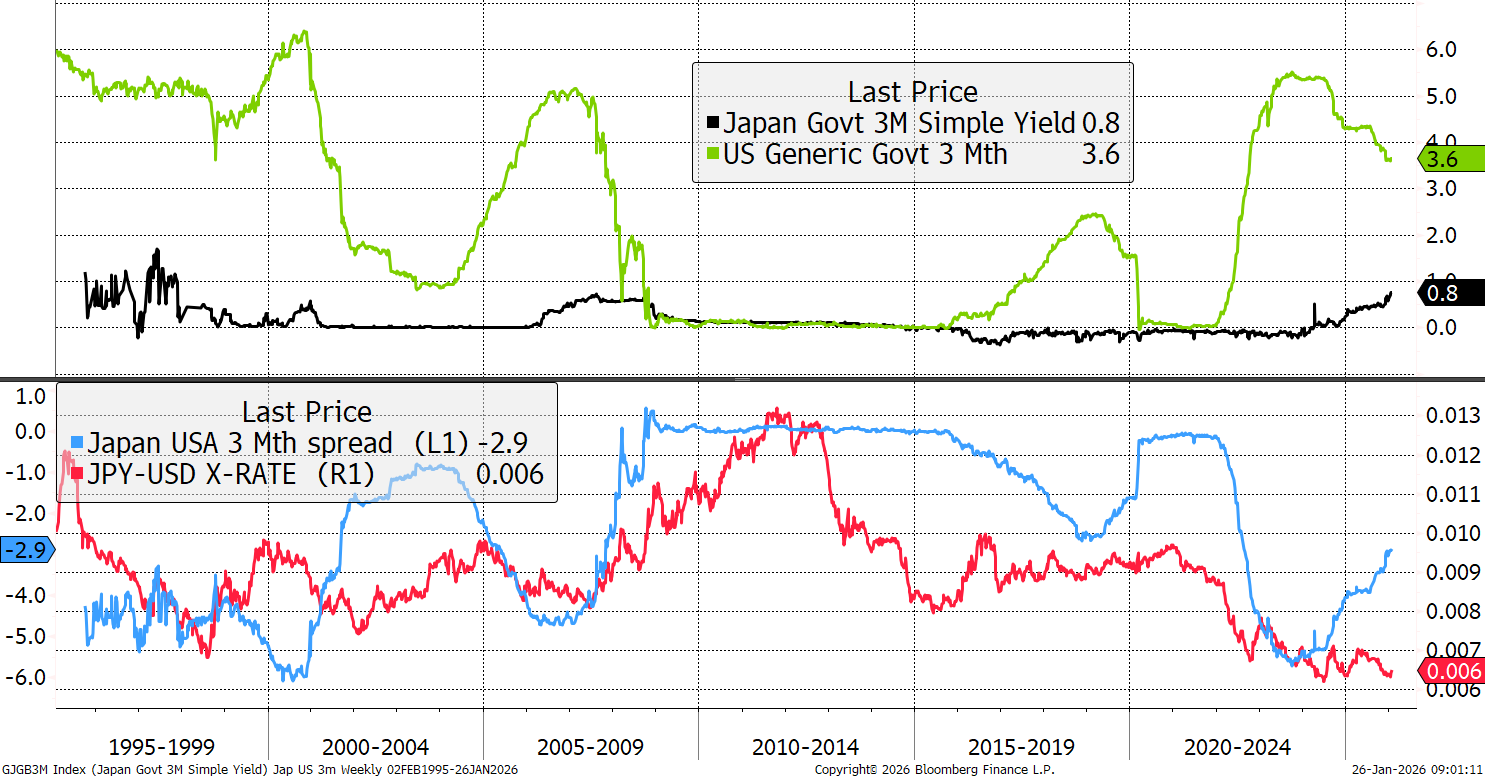
The Yen
You’d need a magnifying glass to see the yen move (red), but the currency is massively undervalued, and the long yields are converging with the rest of the world. If Japanese money, of which there is plenty, starts to return home to take advantage of higher yields, the thought is that the yen surges. Yet the long bond hasn’t driven the currency nearly as much as short-term rates. They are also rising, but at a slower pace. Yen rallies are reliably damaging to equity bull markets around the world, and this is an important chart. More on this in tomorrow’s Multi-Asset Investor.
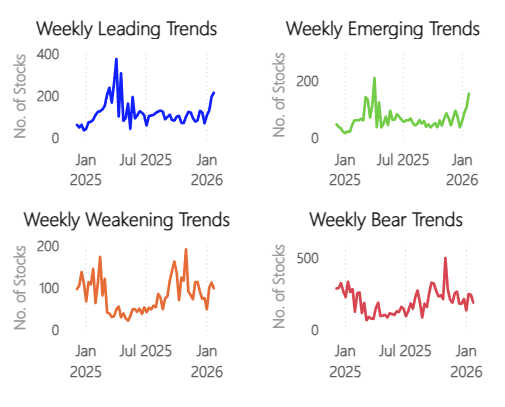
Surge in Bullish Trends - CAPR
Once again, there has been a surge in the number of stocks in CAPR terms. In terms of alpha, this has as much to do with the exciting new themes as it does with the slump in US large caps. The boom in emerging trends is notable.
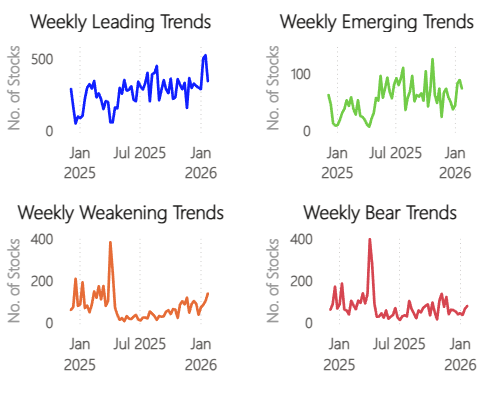
Surge in Bullish Trends – Local Currency
Yet in local price terms, that same bullish trend is less evident in price. Yet it shows up on the bear side with a rise in weakening trends. In many cases, these are made up of the former winners, which are now cooling off.
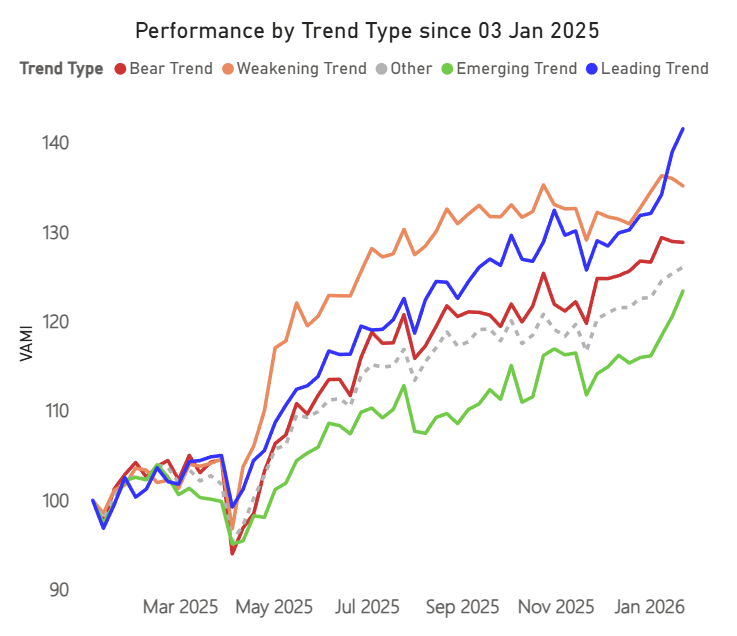
Performance by Trend Type
The weakening trends have stalled for months and have even been beaten by the most oversold bear trends. In contrast, leading and emerging trends are riding high. This analysis by trend type will make so much more sense when we can improve the history.
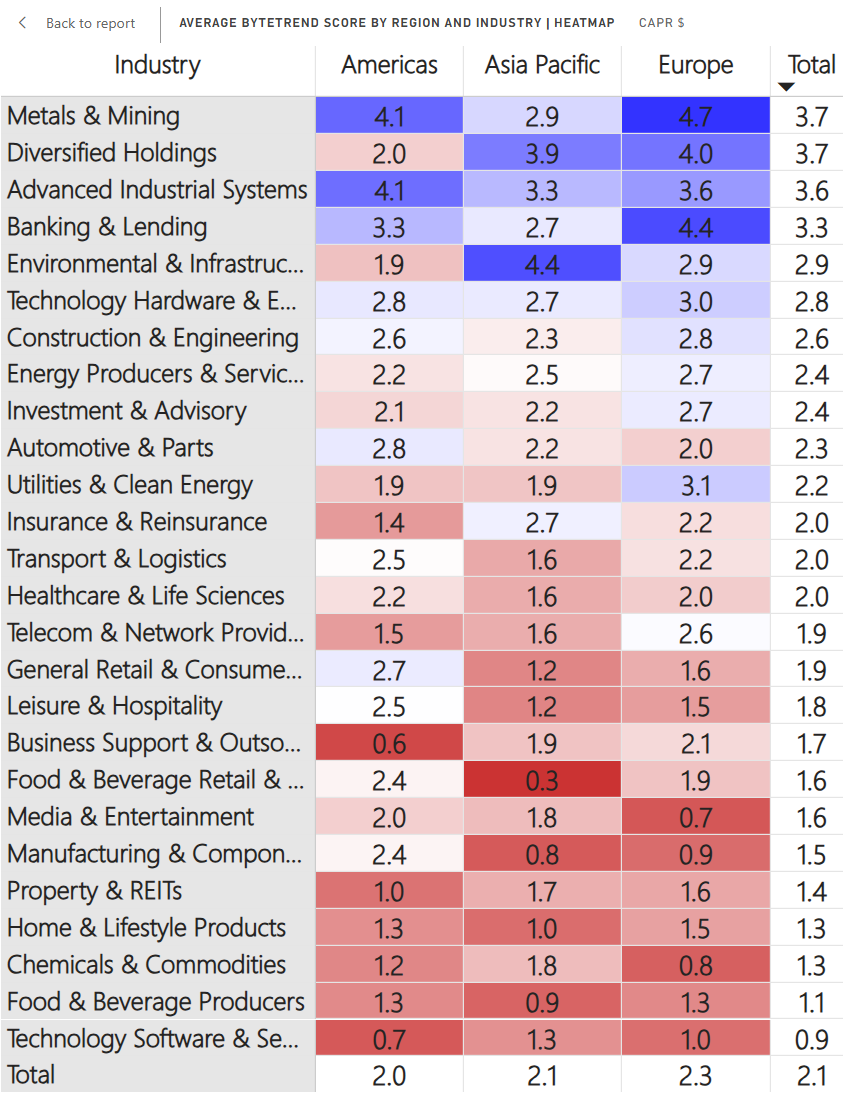
Regions and Industries Average CAPR Score
The top seven industries remained unchanged, but the action was lower down. Utilities rose, along with European healthcare. Energy producers rose materially, reaching 8th spot on the list, and rising in each region. The oil service companies are strong and seem to be front-running the oil price.
At the bottom of the table, manufacturing and components rose sharply last week led by the Americas. In Europe, they remain weaker, nut have improved since last week. Telecoms rose, led by the Americas. In Europe, the likes of Vodafone and Airtel Africa are strong.
Remember to refer to our GTI: User Guide for an overview of the key concepts and terminology used in this report. These concepts may take a little bit of getting used to, but are very powerful once you do.
The Value Composite Score (Value) is measured against the company’s own financial history and not in absolute terms. The columns are Cheap (Chp), Value (Val), Fair Value (FV), Overvalued (OV), and Expensive (Exp). The Growth Composite Score (Growth) is measured by sales, earnings cash flow, dividends, and book value on a per share basis. The columns are High, Good, Medium (Med), Low, and Negative (Neg).
Leading Trends with New Highs
These stocks are trading at the 30-week CAPR highs with a ByteTrend Score of 5. All charts shown are CAPR rebased to 100.
| Name | 360 Day Vol | Mkt Cap $Bn | Value | Growth |
|---|---|---|---|---|
| Alphabet Inc. | 27 | 3957 | OV | Good |
| TSMC | 22 | 1462 | OV | High |
| Samsung Electronics Co., Ltd. | 34 | 703 | Exp | Med |
| ASML Holding N.V. | 40 | 541 | OV | Med |
| Micron Technology, Inc. | 58 | 450 | Exp | Low |
| SK hynix Inc. | 54 | 366 | Exp | High |
| HSBC Holdings plc | 22 | 288 | OV | High |
| Novartis AG | 20 | 285 | FV | Med |
| Siemens AG | 24 | 236 | OV | Good |
| Banco Santander, S.A. | 24 | 182 | OV | High |
| Gilead Sciences, Inc. | 23 | 169 | OV | Neg |
| UBS Group AG | 21 | 151 | OV | Good |
| Southern Copper Corporation | 37 | 151 | Exp | Low |
| Analog Devices, Inc. | 33 | 150 | OV | Med |
| Siemens Energy AG | 34 | 143 | Exp | High |
| BBVA | 25 | 142 | Exp | High |
| Zijin Mining Group | 38 | 138 | Exp | High |
| Sumitomo Mitsui Financial | 27 | 137 | OV | High |
| Newmont Corporation | 37 | 136 | OV | Neg |
| Interactive Brokers Group, Inc. | 30 | 134 | OV | High |
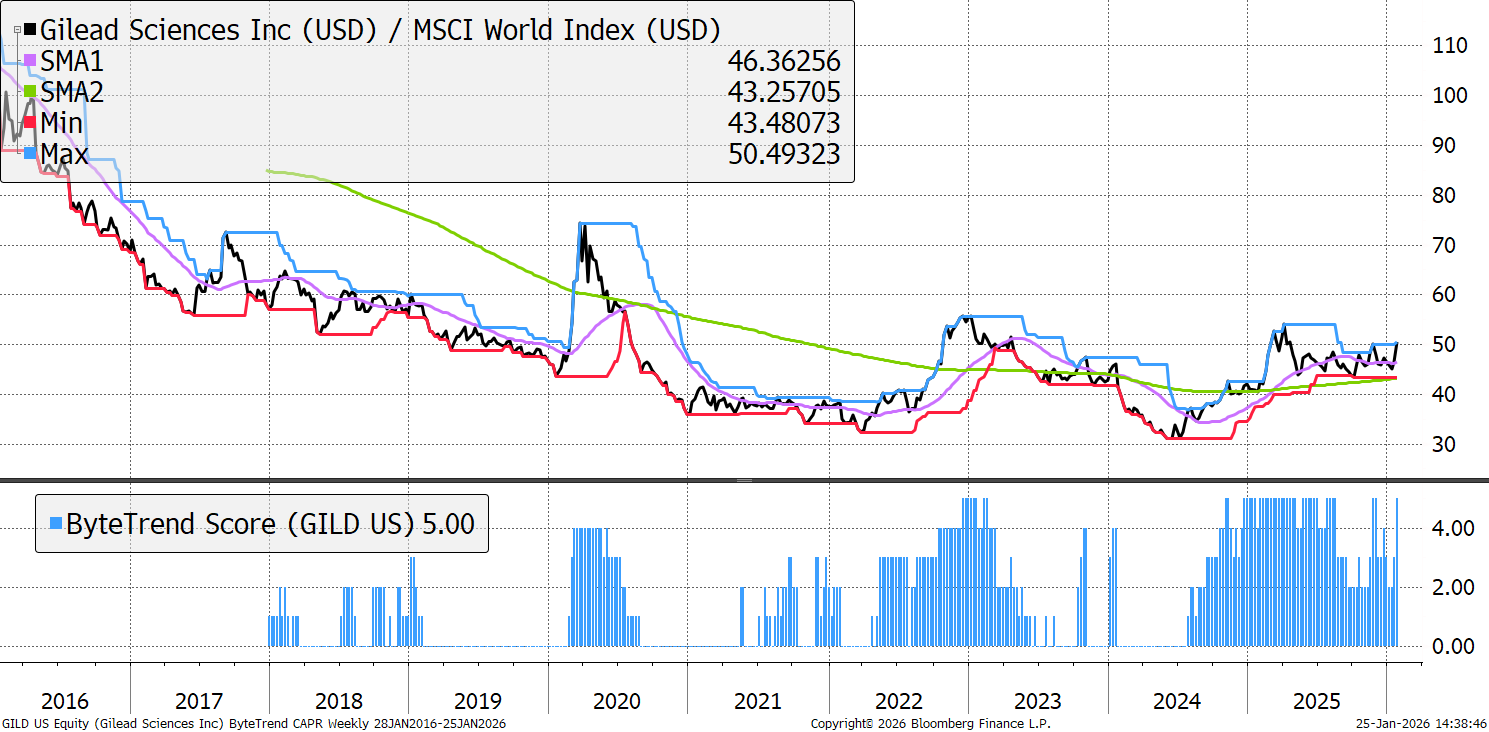
Gilead Sciences
Healthcare has been returning to strength for some time, and Gilead is joining the action. It is a biopharma company best known for its market-leading anti-viral HIV drugs. The key is whether growth in its oncology, cell therapy and long-acting HIV businesses can offset the slowing growth as its traditional HIV business matures.
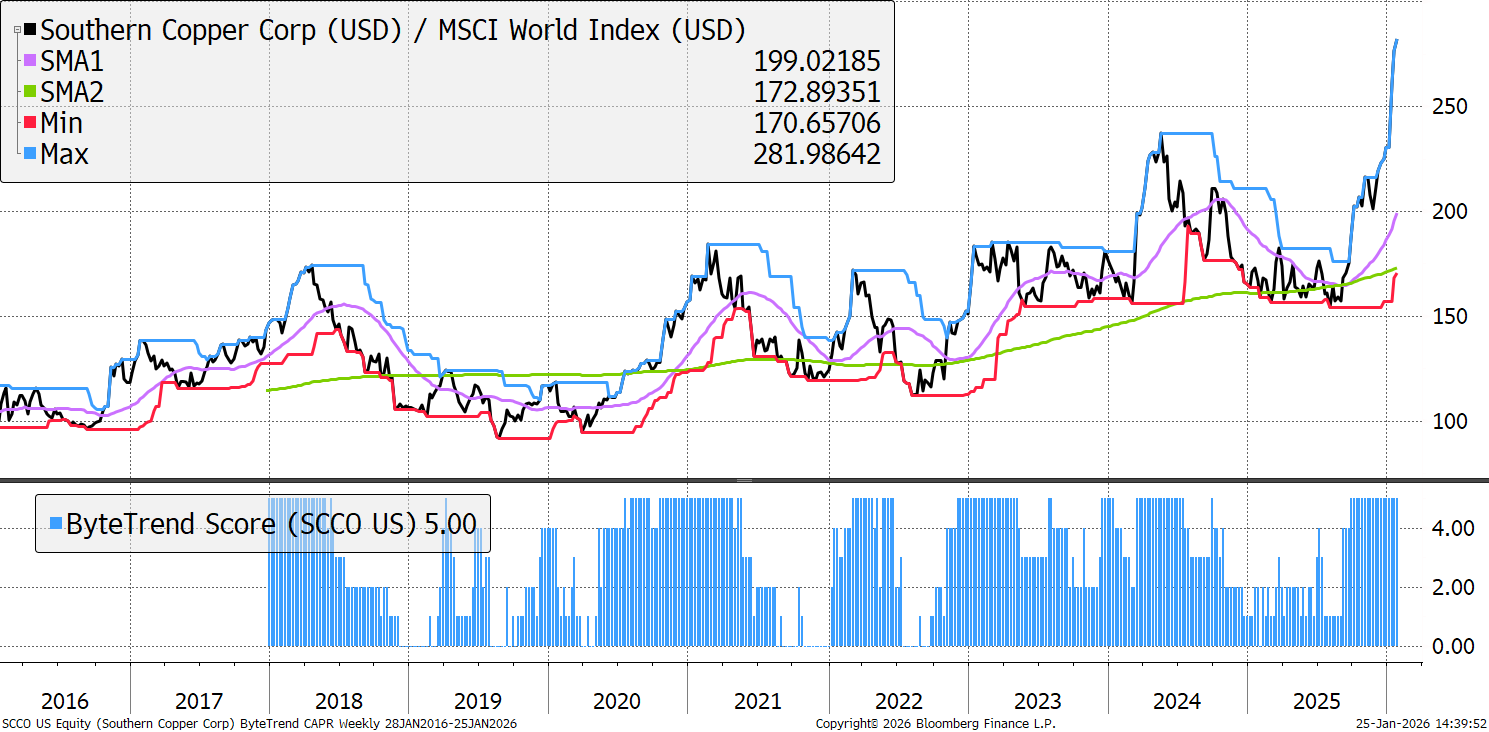
Southern Copper Corp
AI has added a new source of demand on top of electrification, as grids everywhere are craving investment. Copper mining is constricted for now, and the price has started to follow precious metals higher. Southern Copper is controlled by Grupo Mexico and dominates the Mexico-Peru region. Peter Thiel says,
“We’re consuming 30m tonnes of copper a year. Only 4m tonnes of which is recycled. That means to maintain 3% GDP growth, with no electrification, we have to mine the same amount of copper in the next 18 years as we mined in the last 10,000 years, combined. This is without any new electrification, without data centres, without solar and wind and the greening of the world economy. You people have no idea whatsoever what we’re facing.”
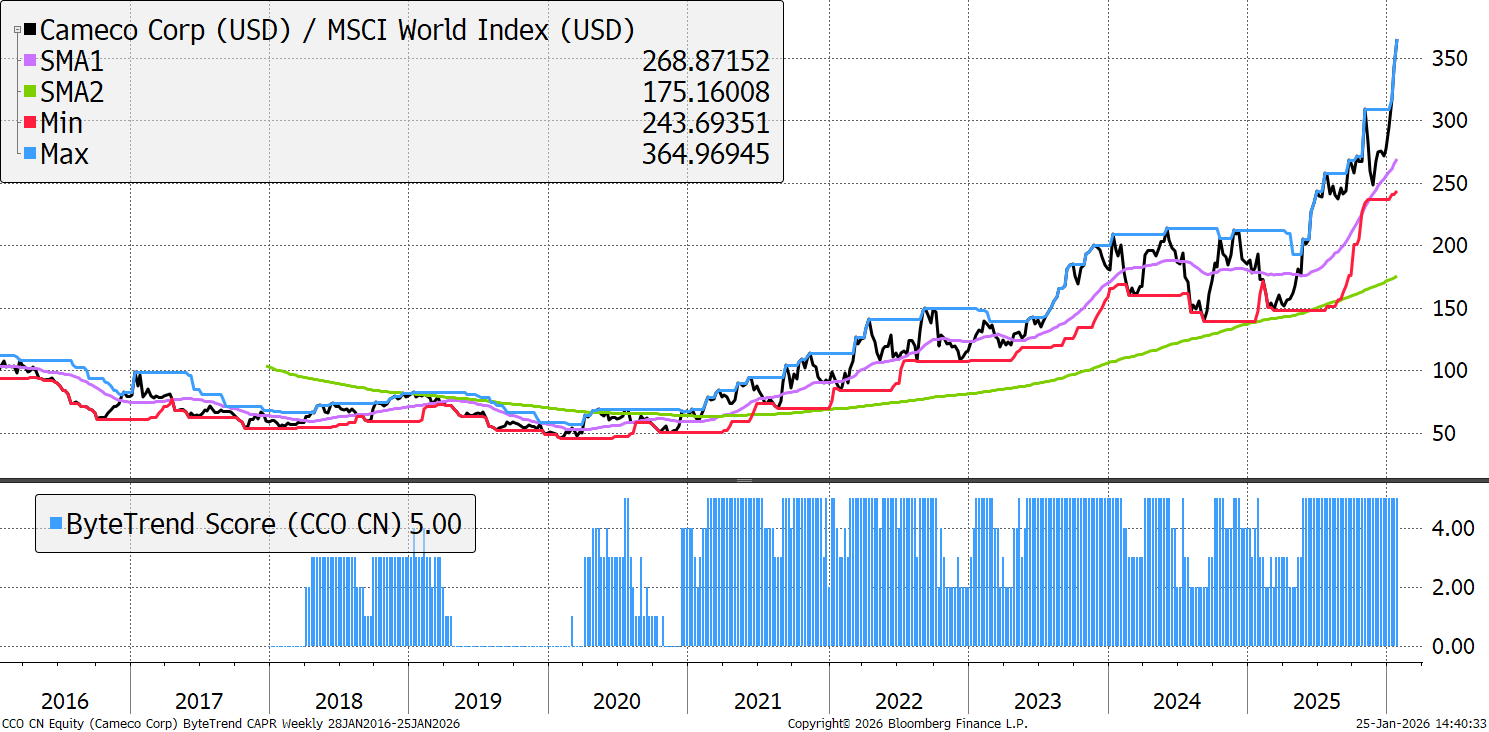
Cameco Corp
The five-year bull market in nuclear stocks continues. Cameco's strength ties into the broader nuclear renaissance narrative, with the stock acting as a leveraged bet on uranium prices and nuclear adoption. It is seen as a core holding for those bullish on clean baseload power.
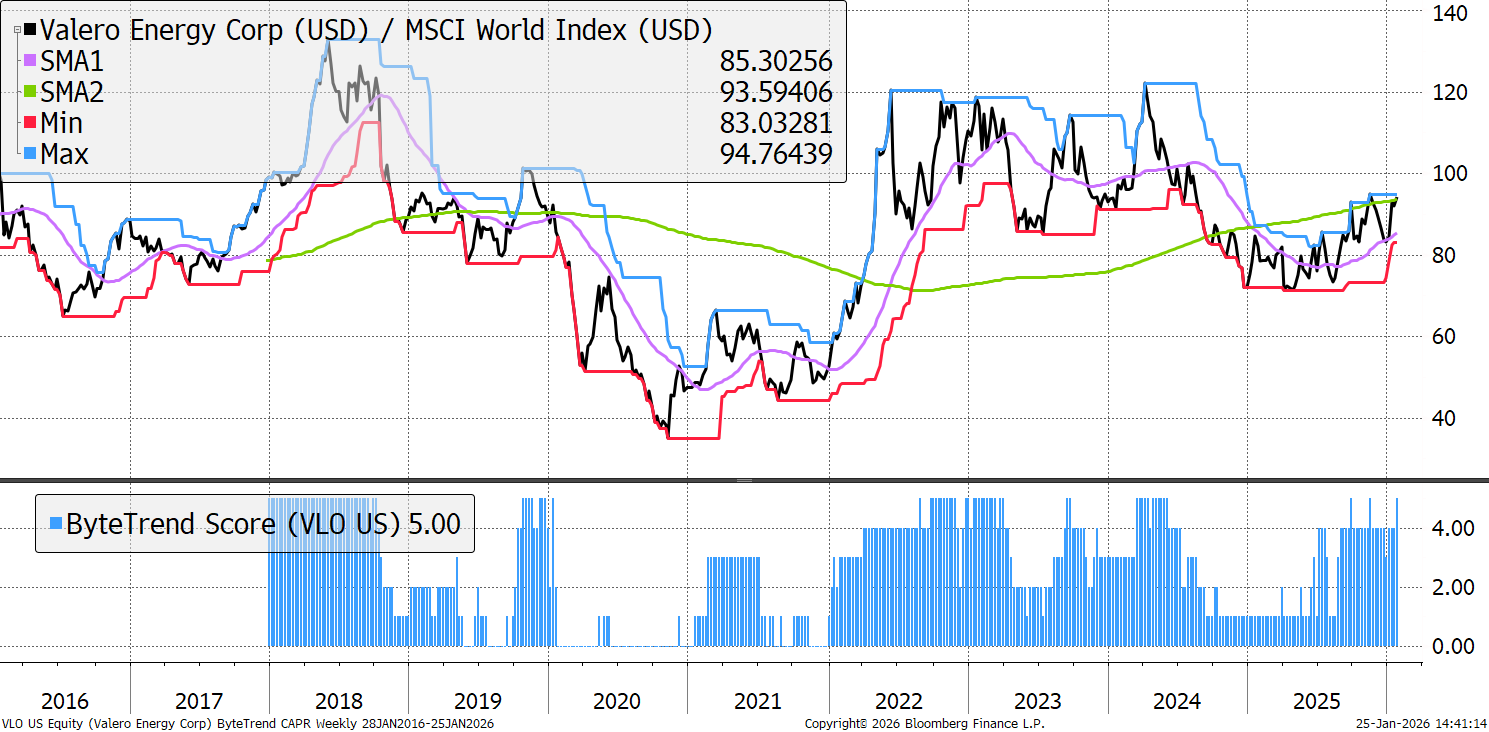
Valero Energy
Brent crude is now above its 200-day moving average with a ByteTrend Score of 5 on the daily chart. VLO has above-average exposure to discounted Venezuelan oil, through its complex refineries, which are optimised for processing heavy and sour crudes into gasoline, diesel, jet fuel, and other products. It has grown its dividend 16% per year since 2012.
New Leading Trends
These stocks are trading at the 30-week CAPR highs with a ByteTrend Score of 5, except they are new trends this week, having previously has a score below 5. All charts shown are CAPR rebased to 100.


