
Hard Assets Lead Soft


Issue 53;
- Major rotation in a high breadth market.
- Performance divergence widens.
- The old economy takes over from the new.
Global Trends is a deep dive into global equities. The aim of this analysis is to better understand which countries, sectors, industries, and stocks are driving market returns. Not only does it help investors identify opportunities, but it also highlights the risks. We try to condense as much important information as possible, focusing on what really matters each week. Embrace this as a weekly discipline, and you’ll soon have a much better understanding of global financial markets.
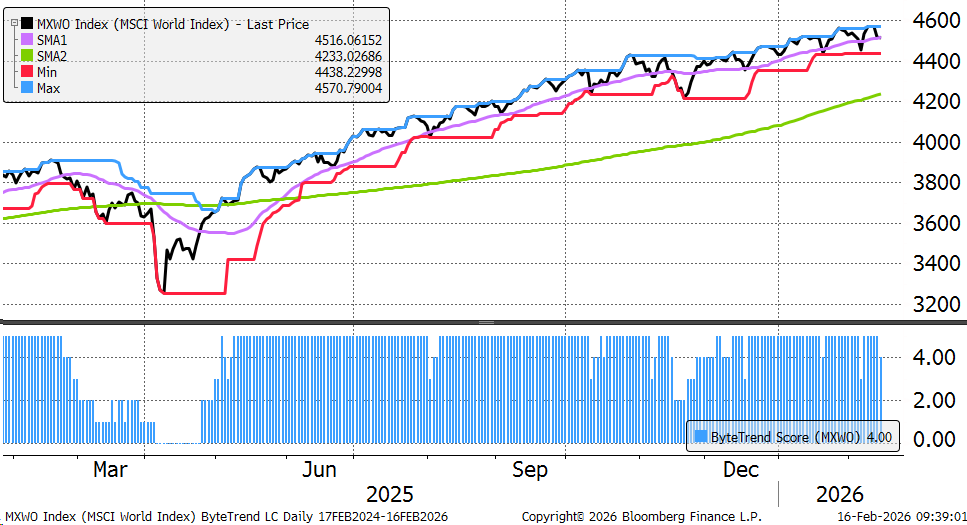
The World Index drops to a ByteTrend Score of 4 in USD, as price meets the 30-week moving average. This hides the extraordinary number of new trends coming through. Against that is the derating in many high market cap companies. Investors need to prepare for a major market shake-up.
World Index – Developed Markets – Daily
Global Equity Breadth
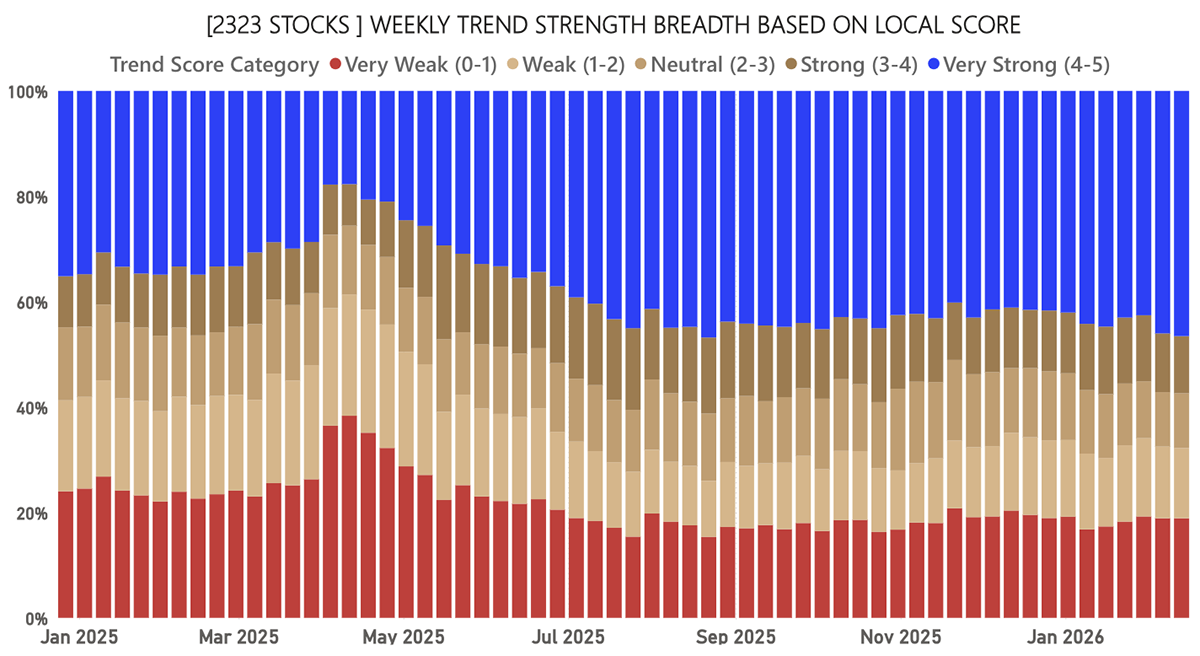
Global breadth improves as strength finds its way into many new countries and sectors. Nearly 50% of stocks are in uptrends, which is high. Bear trends are not yet rising, which is a sign of market health. Stay bullish for now.
Local Breadth
CAPR breadth increases as new market-beating trends emerge as leaders. They are no longer held back by the previously strong leadership in mega-caps.
CAPR Breadth
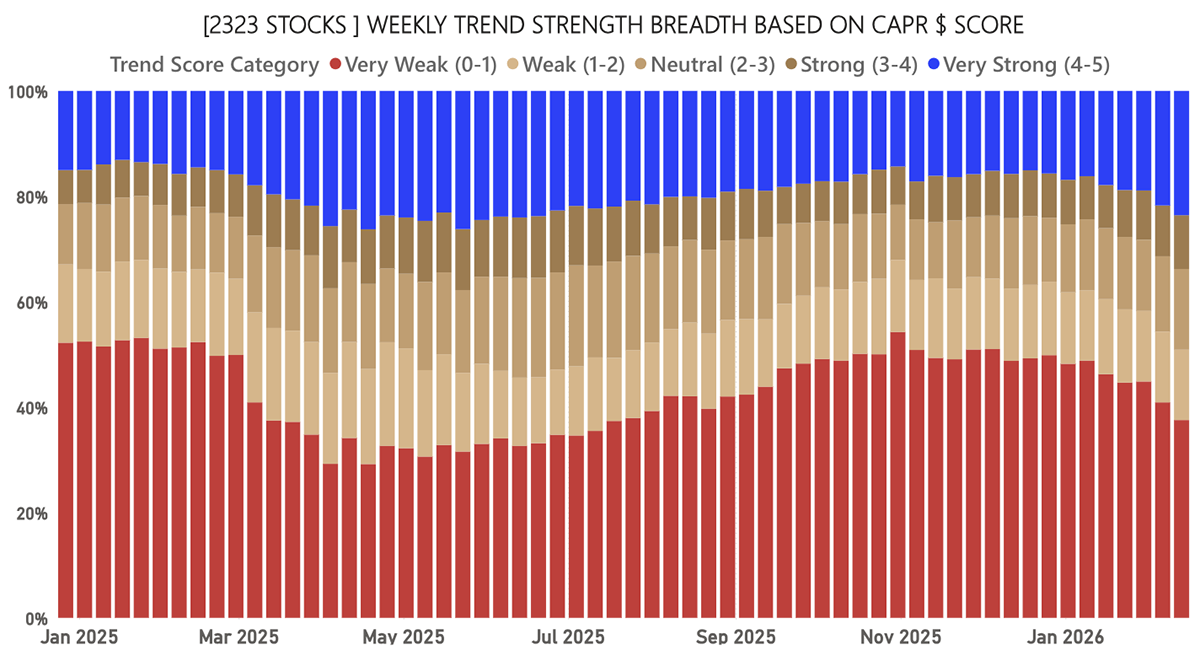
Trend Type CAPR
The weakening and bear stocks are capturing the headlines, as software will be eaten by AI. Exaggerated, no doubt, but not to be ignored. The real story is the explosion in bull and emerging trends. Investors need to be in front of this rotation. A portfolio worthy of the last ten years is not the one to own for the next ten.
Volatility – Volatile Stocks Give Way
While hardly headline-grabbing stuff, the few low-volatility stocks, which are typically defensive companies, have started to pick up. Medium volatility stocks, which are many, are where the money is being made. Notably, the most volatile stocks are no longer in the lead. This marks a major change in the structure of this bull market.
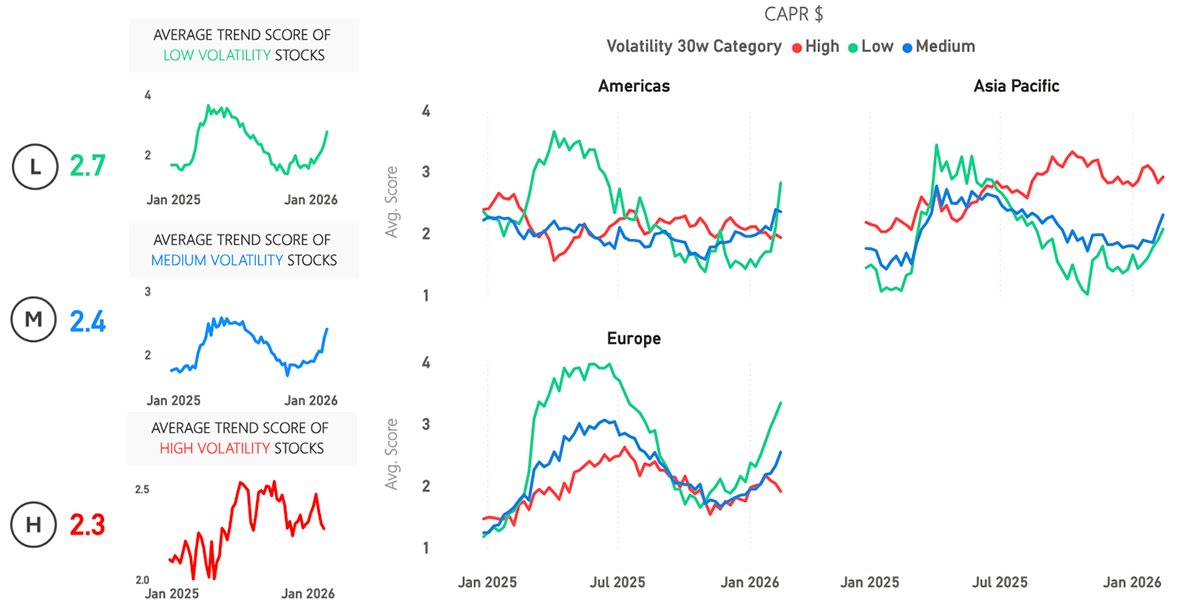
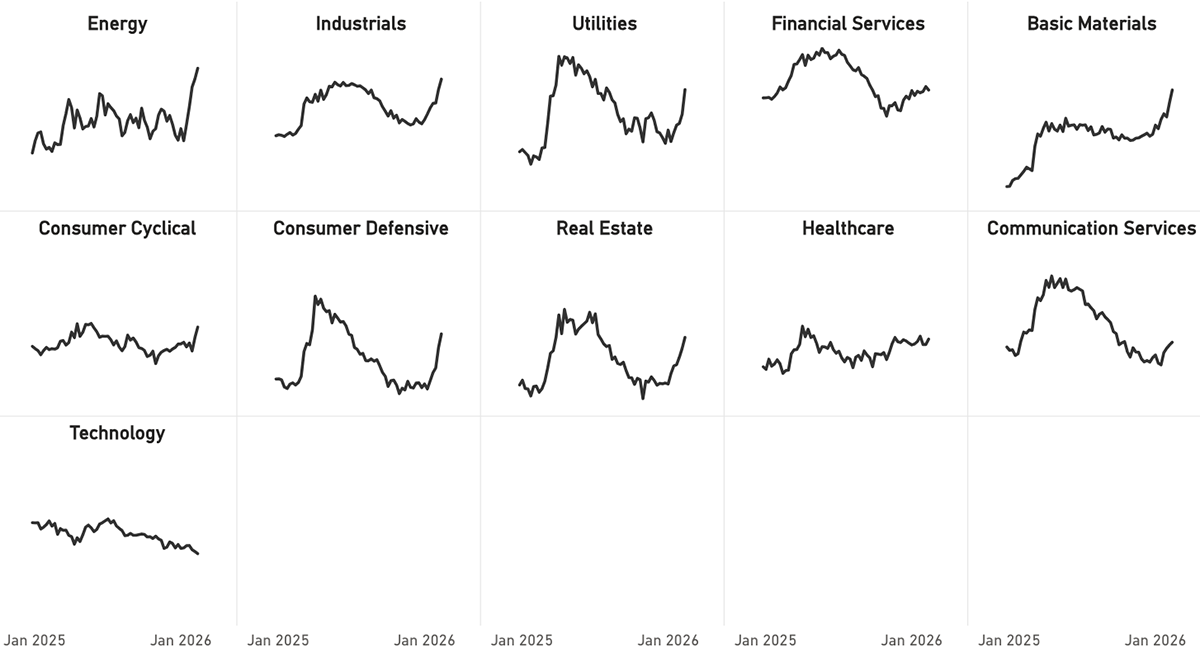
Sector Trends in CAPR
Financial services have started to cool off following a strong couple of years. The other message is to own pretty much everything except for technology.
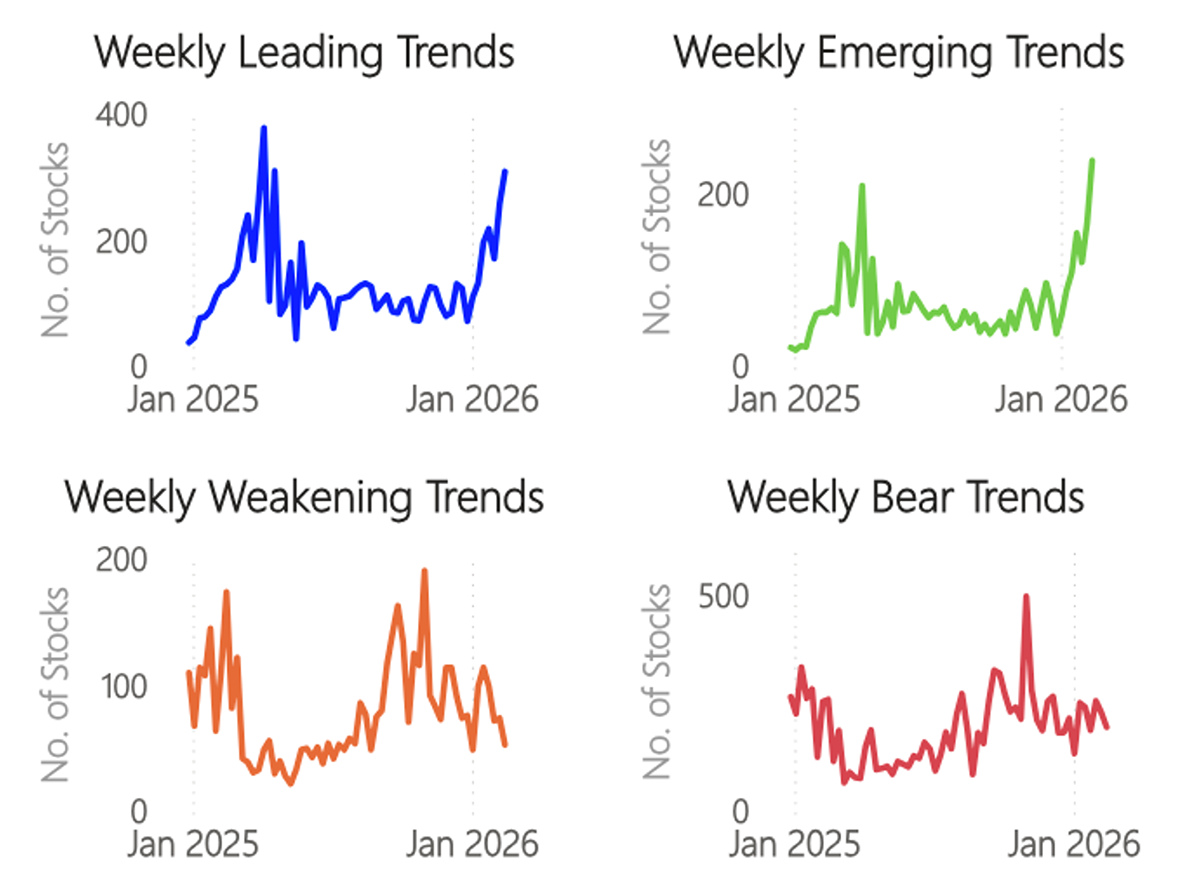
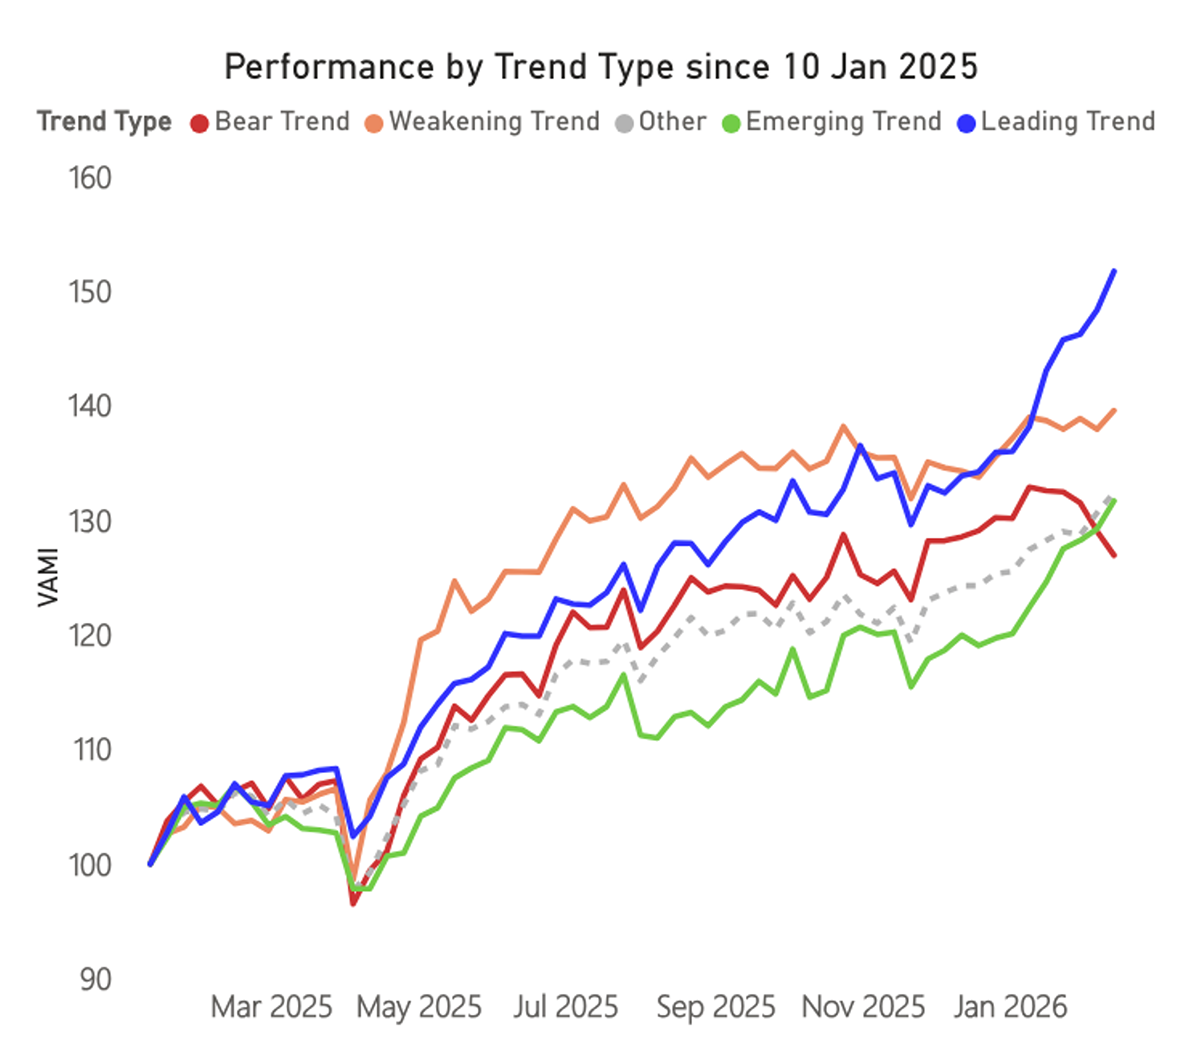
Performance by Trend Type
The dispersion between the winners and the losers is now huge. The emerging trends are perking up as well, trying to catch up with the winners.
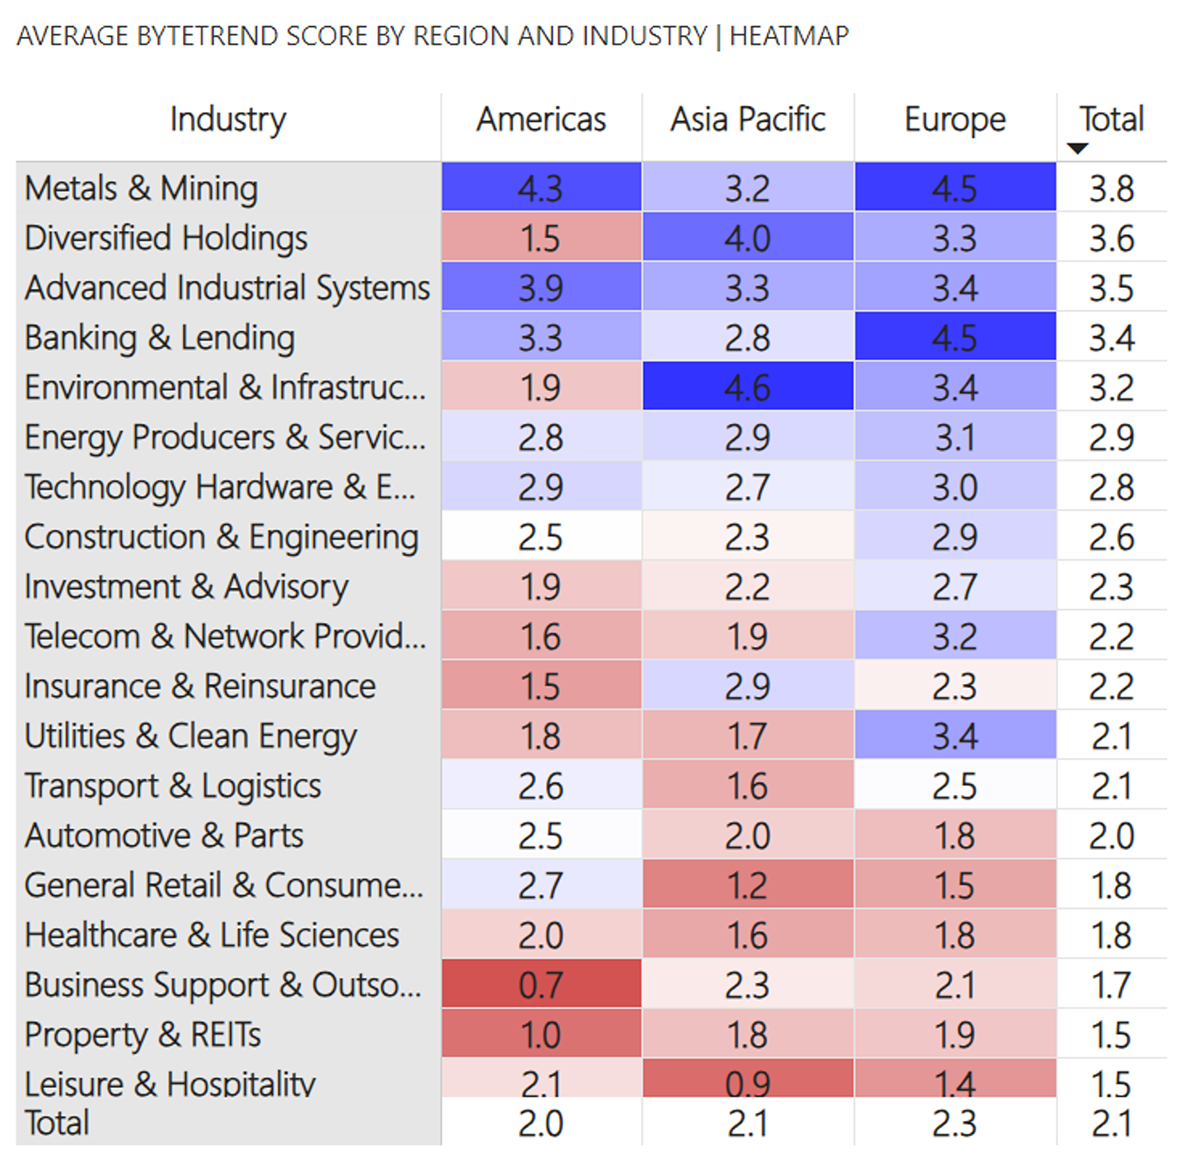
Regions and Industries Average CAPR Score
Environmental and Infrastructure stocks have moved up into third place. Construction, Engineering, Chemicals, and Manufacturing stocks all continue to strengthen notably, as do Energy Producers and, perhaps surprisingly, Technology Hardware stocks.
Chemical companies in the Americas are especially strong since the start of 2026, and Food & Beverage stocks are another major winner this year. Telecoms, another defensive sector, have continued their surge from the last few weeks, and finally, Home & Lifestyle products are also suddenly on the move higher.
The Banking and Lending industry in Europe has weakened for the first time since October, but remains the second-strongest trend there. Media and Entertainment stocks, led by Netflix, continue to weaken, now second-lowest on the table, only ahead of Software stocks.
User Guide
Refer to our GTI: User Guide for an overview of the key concepts and terminology used in this report. These concepts may take a little bit of getting used to, but they are very powerful once you do.
How to Read the Tables
The Value Composite Score (Value) is measured against the company’s own financial history and not in absolute terms. The columns are Cheap (Chp), Value (Val), Fair Value (FV), Overvalued (OV), and Expensive (Exp). The Growth Composite Score (Growth) is measured by sales, earnings, cash flow, dividends, and book value on a per share basis. The columns are High, Good, Medium (Med), Low, and Negative (Neg).
Leading Trends with New Highs
These stocks are trading at the 30-week CAPR highs with a ByteTrend Score of 5. All charts shown are CAPR rebased to 100.
| Name | Annual Vol 30w | Mkt Cap $Bn | Value | Growth |
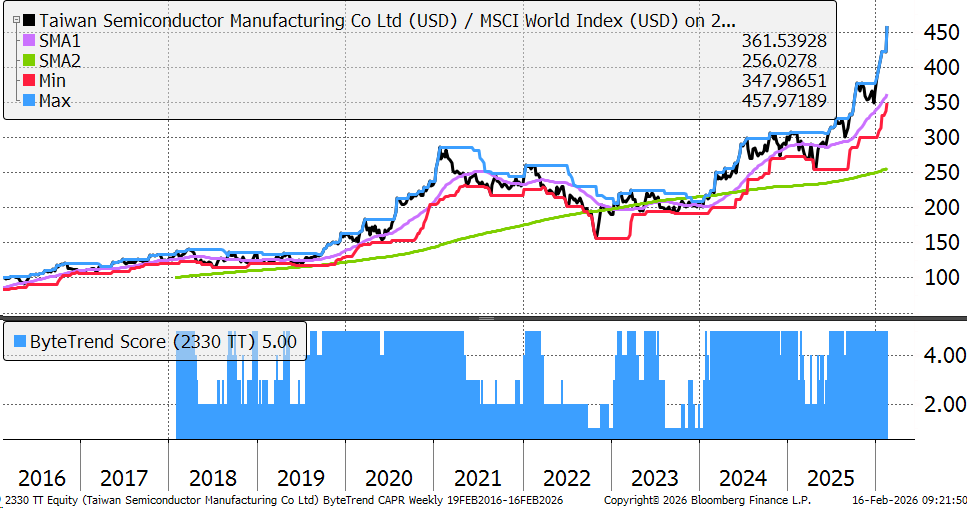
| Taiwan Semiconductor Manufacturing Company Limited | 23 | 1582 | OV | High |
| Walmart Inc. | 23 | 1067 | Exp | Med |
| Samsung Electronics Co., Ltd. | 36 | 839 | Exp | Good |
| Exxon Mobil Corporation | 19 | 626 | OV | Neg |
| Micron Technology, Inc. | 56 | 463 | Exp | Low |
| Caterpillar Inc. | 31 | 363 | Exp | Good |
| Toyota Motor Corporation | 27 | 322 | OV | High |
| AstraZeneca PLC | 28 | 320 | FV | Good |
| Novartis AG | 19 | 311 | OV | Good |
| Lam Research Corporation | 44 | 294 | Exp | Good |
| Applied Materials, Inc. | 41 | 282 | Exp | Med |
| Mitsubishi UFJ Financial Group, Inc. | 31 | 223 | Exp | High |
| GE Vernova Inc. | 36 | 218 | OV | Med |
| Industria de Diseño Textil, S.A. | 29 | 211 | OV | Good |
| Gilead Sciences, Inc. | 24 | 192 | OV | High |
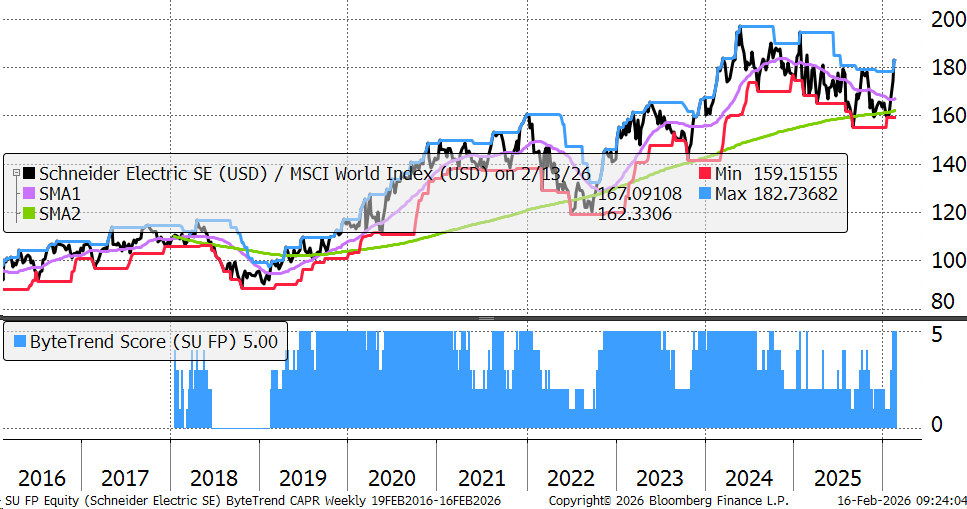
| Schneider Electric S.E. | 26 | 176 | Exp | Good |
| ABB Ltd | 22 | 166 | OV | High |
| Analog Devices, Inc. | 33 | 165 | OV | Med |
| Siemens Energy AG | 34 | 165 | Exp | High |
| Safran S.A. | 20 | 165 | OV | High |
| TotalEnergies SE | 19 | 164 | OV | Neg |
| Southern Copper Corporation | 34 | 164 | Exp | Good |
| Iberdrola, S.A. | 13 | 161 | OV | Good |
| Rio Tinto Group | 18 | 159 | OV | Neg |
| Sumitomo Mitsui Financial Group, Inc. | 28 | 152 | Exp | High |
| Lockheed Martin Corporation | 27 | 151 | OV | Med |
| Rolls-Royce Holdings plc | 26 | 144 | Exp | Good |
| Zijin Mining Group Company Limited | 39 | 141 | Exp | High |
| Fast Retailing Co., Ltd. | 33 | 139 | OV | Good |
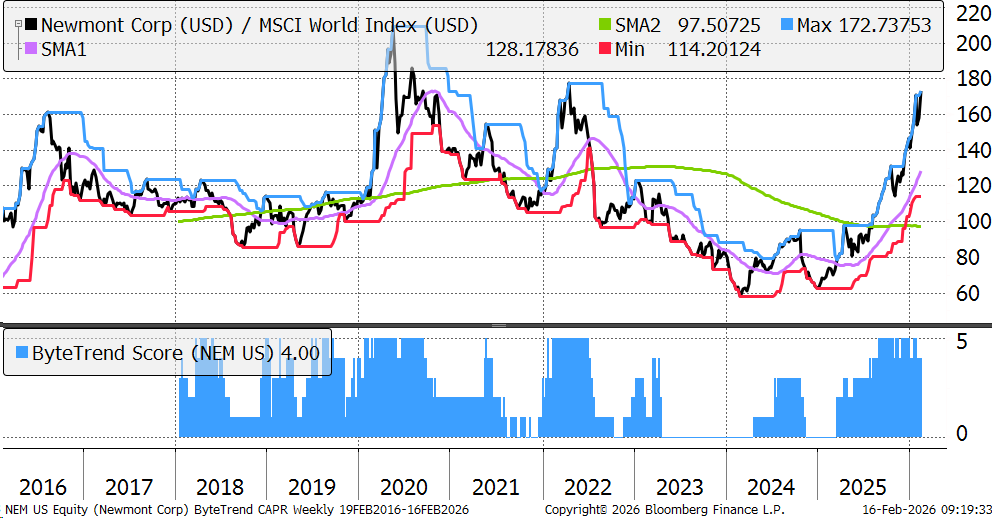
| Newmont Corporation | 40 | 137 | OV | Neg |
| Advantest Corporation | 72 | 129 | Exp | High |
| Parker-Hannifin Corporation | 20 | 126 | Exp | Good |
| Tokyo Electron Limited | 51 | 126 | Exp | Good |
| Mizuho Financial Group, Inc. | 32 | 124 | Exp | High |
| Investor AB (publ) | 16 | 123 | FV | Good |
| Mitsubishi Corporation | 27 | 123 | Exp | Good |
| State Bank of India | 21 | 122 | OV | High |
| Investor AB (publ) | 17 | 121 | FV | Good |
| HCA Healthcare, Inc. | 25 | 121 | OV | Good |
| Corning Incorporated | 38 | 114 | Exp | Good |
| Mitsubishi Heavy Industries, Ltd. | 39 | 111 | Exp | High |
| Agnico Eagle Mines Limited | 39 | 109 | OV | High |
| Mitsui & Co., Ltd. | 25 | 106 | Exp | Med |
| Atlas Copco AB | 23 | 105 | OV | Neg |
| Delta Electronics, Inc. | 43 | 104 | Exp | High |
| ITOCHU Corporation | 24 | 102 | Exp | Med |
| Itaú Unibanco Holding S.A. | 19 | 101 | OV | High |
| Howmet Aerospace Inc. | 29 | 101 | Exp | High |
| Chugai Pharmaceutical Co., Ltd. | 39 | 100 | OV | Good |
| Northrop Grumman Corporation | 23 | 100 | OV | Good |
| National Australia Bank Limited | 19 | 100 | OV | Good |
Newmont (NEM)
NEM has lagged the gold miners until recently. A sustained high gold price, despite the correction, has seen the majors catch up with the pack. NEM reports on Thursday, which will be a big day for the sector. A high gold price combined with low energy prices has the potential to surprise the market.
Taiwan Semiconductor (TSMC)
TSM continues to benefit from the AI capex boom. It now trades on 13x sales, which compares with a long-term average of 5x. This late-cycle favours hardware over software, which is something markets have rarely priced in past cycles. The semis have never had it so good.
New Leading Trends
These stocks are trading at the 30-week CAPR highs with a ByteTrend Score of 5, except they are new trends this week, having previously had a score below 5. All charts shown are CAPR rebased to 100.
| Name | Annual Vol 30w | Mkt Cap $Bn | Value | Growth |
| AstraZeneca PLC | 28 | 320 | FV | Good |
| Schneider Electric S.E. | 26 | 176 | Exp | Good |
| Safran S.A. | 20 | 165 | OV | High |
| TotalEnergies SE | 19 | 164 | OV | Neg |
| Rio Tinto Group | 18 | 159 | OV | Neg |
| Lockheed Martin Corporation | 27 | 151 | OV | Med |
| Mitsubishi Heavy Industries, Ltd. | 39 | 111 | Exp | High |
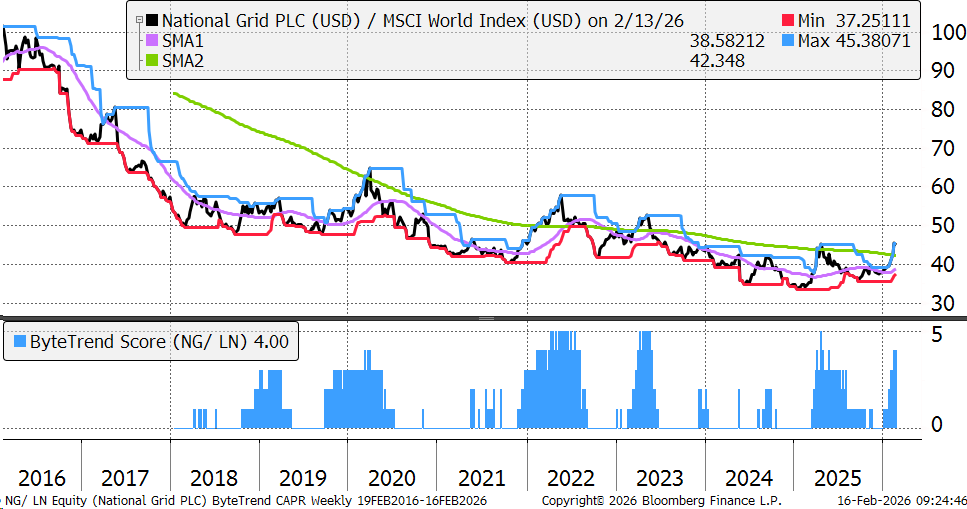
| National Grid plc | 14 | 93 | OV | Good |
| Canadian Natural Resources Limited | 24 | 85 | OV | Med |
| Infineon Technologies AG | 40 | 67 | OV | Neg |
| E.on Se | 17 | 58 | OV | High |
| WEG S.A. | 33 | 43 | FV | High |
| Tesco PLC | 24 | 42 | OV | Med |
| Koninklijke Ahold Delhaize N.V. | 24 | 42 | FV | Med |
Of the new Leading trends, the top 16 are all non-US.
Schneider Electric (SE)
SE sits at the heart of digital infrastructure, automation, data centres, and energy management. It is a good example of an old-economy company, which finds itself in a strong position for the 21st century. Their EcoStruxure Foxboro Software Defined Automation (SDA) tool is the first open-source tool of its kind for industrial automation. Impressive.
National Grid (NG)
NG is the major beneficiary of the £30bn UK grid upgrade to modernise the transmission and link in offshore renewables. In the USA, it benefitted from higher demand in the recent cold snap. Electrification is a major investment theme regardless of net-zero goals.
Emerging Trends
These stocks are trading at the 30-week CAPR highs with a ByteTrend Score of less than 5. They don’t have to be in an uptrend, just emerging. All charts shown are CAPR rebased to 100.
| Name | Annual Vol 30w | Mkt Cap $Bn | Value | Growth |
| Johnson & Johnson | 18 | 587 | OV | Good |
| Roche Holding AG | 29 | 373 | FV | Low |
| Chevron Corporation | 18 | 367 | OV | Neg |
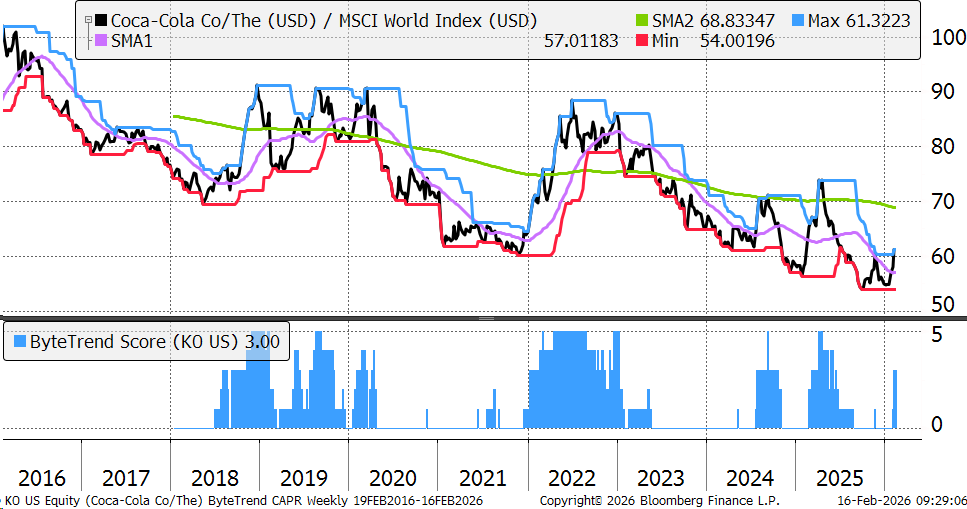
| The Coca-Cola Company | 14 | 338 | OV | Low |
| Merck & Co., Inc. | 33 | 303 | FV | High |
| Philip Morris International Inc. | 30 | 292 | OV | Med |
| Commonwealth Bank of Australia | 28 | 209 | OV | Good |
| Verizon Communications Inc. | 25 | 207 | FV | Med |
| Texas Instruments Incorporated | 36 | 205 | OV | Neg |
| Fomento Económico Mexicano, S.A.B. de C.V. | 22 | 202 | FV | High |
| NextEra Energy, Inc. | 23 | 195 | FV | Good |
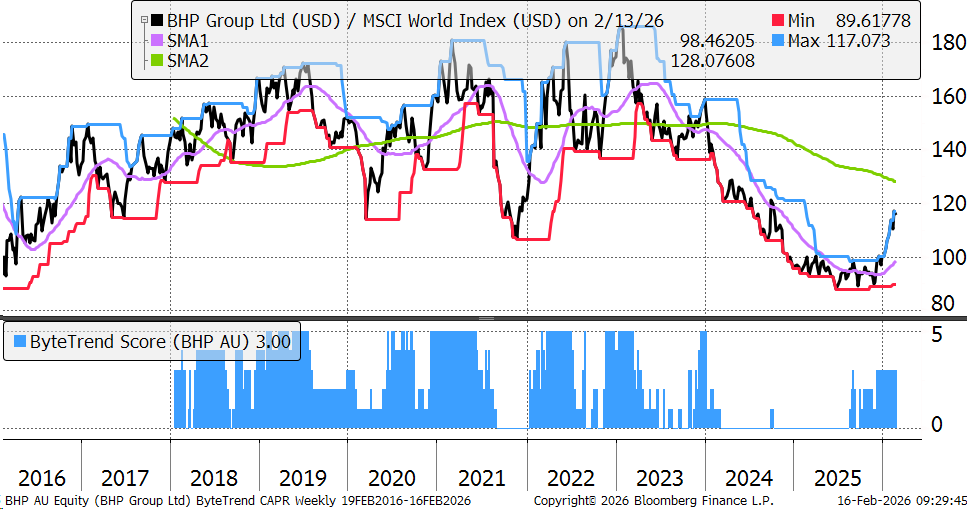
| BHP Group Limited | 23 | 184 | OV | Neg |
| Deere & Company | 24 | 163 | OV | Good |
| Lowe's Companies, Inc. | 26 | 161 | OV | Med |
| Pfizer Inc. | 29 | 157 | Val | Med |
| Anheuser-Busch InBev SA/NV | 30 | 156 | FV | Good |
| Union Pacific Corporation | 19 | 155 | FV | Low |
| Honeywell International Inc. | 23 | 153 | OV | Med |
| ConocoPhillips | 26 | 138 | FV | Neg |
| Prologis, Inc. | 23 | 129 | FV | Med |
| Enbridge Inc. | 16 | 118 | OV | High |
| China Petroleum & Chemical Corporation | 22 | 114 | OV | Neg |
| United Parcel Service, Inc. | 36 | 101 | FV | Neg |
| Bank of Montreal | 14 | 101 | OV | Good |
| The Bank of Nova Scotia | 13 | 94 | FV | Med |
| Equinix, Inc. | 23 | 94 | FV | Good |
| Freeport-McMoRan Inc. | 43 | 90 | Exp | Neg |
| Illinois Tool Works Inc. | 22 | 87 | OV | Med |
| Regeneron Pharmaceuticals, Inc. | 33 | 83 | FV | Med |
| Colgate-Palmolive Company | 18 | 78 | Exp | Good |
| CSX Corporation | 22 | 76 | OV | Neg |
| Canadian Pacific Kansas City Ltd. | 20 | 75 | FV | Neg |
| SLB N.V. | 33 | 75 | FV | Good |
| Vale S.A. | 17 | 71 | OV | Neg |
| Norfolk Southern Corporation | 15 | 71 | OV | Low |
| Equinor ASA | 22 | 70 | FV | Neg |
| American Electric Power Company, Inc. | 19 | 70 | FV | Med |
| TC Energy Corporation | 18 | 66 | OV | High |
| Merck KGaA | 29 | 66 | Val | Neg |
| Canadian National Railway Company | 17 | 66 | FV | Low |
| Becton, Dickinson and Company | 55 | 64 | Val | Med |
| Realty Income Corporation | 15 | 60 | FV | Good |
| Takeda Pharmaceutical Company Limited | 20 | 58 | OV | Neg |
| Alimentation Couche-Tard Inc. | 30 | 58 | FV | Med |
| Dominion Energy, Inc. | 20 | 57 | FV | Neg |
| ONEOK, Inc. | 23 | 54 | FV | Med |
| BASF Se | 27 | 54 | Exp | Neg |
| Bayer AG | 37 | 54 | FV | Neg |
| Target Corporation | 27 | 53 | FV | Neg |
| Anglo American plc | 30 | 52 | Exp | Neg |
| Haleon plc | 18 | 50 | FV | Med |
| Ambev S.A. | 23 | 49 | Val | Good |
| Diamondback Energy, Inc. | 25 | 48 | FV | Med |
| Swisscom AG | 16 | 47 | FV | Neg |
| Legrand S.A. | 25 | 46 | OV | Med |
| DNB Bank ASA | 14 | 46 | FV | High |
| Sysco Corporation | 22 | 43 | FV | Med |
| Microchip Technology Incorporated | 50 | 43 | Exp | Neg |
| Banco Bradesco S.A. | 24 | 42 | FV | Good |
| Dubai Electricity and Water Authority (PJSC) | 14 | 42 | FV | Med |
| Cenovus Energy Inc. | 28 | 41 | OV | High |
| Henkel AG & Co. KGaA | 18 | 41 | Val | Med |
| Pacific Gas & Electric Co. | 27 | 40 | FV | Med |
Coca-Cola (KO)
KO has seen its 200-week CAPR moving average have a positive slope on a few occasions over the past decade, all false starts. With the shift towards defensives, this one may prove to be the real thing. But with a measly free cash flow yield, KO will need to sell some magic to keep up with the market over the long-term.
BHP
BHP is a large, diversified miner specialising in iron ore, copper, coal, nickel, and potash. It exited its energy concerns in 2022 and has lagged the mining sector. It reports tomorrow, which will bring some clarification. The main drag compared to the miners is that coal and iron ore are yet to catch up with copper and precious metals. No doubt that follows later in this commodity super cycle.
Weakening Trends
These stocks are trading at the 30-week CAPR lows with a ByteTrend Score above 0. They are weakening trends but not yet downtrends. All charts shown are CAPR rebased to 100.
| Name | Annual Vol 30w | Mkt Cap $Bn | Value | Growth |
| Tencent Holdings Limited | 27 | 614 | Val | Good |
| Netflix, Inc. | 25 | 326 | Val | High |
| Palantir Technologies Inc. | 56 | 300 | OV | High |
| Uber Technologies, Inc. | 29 | 145 | Val | High |
| PDD Holdings Inc. | 38 | 140 | Chp | High |
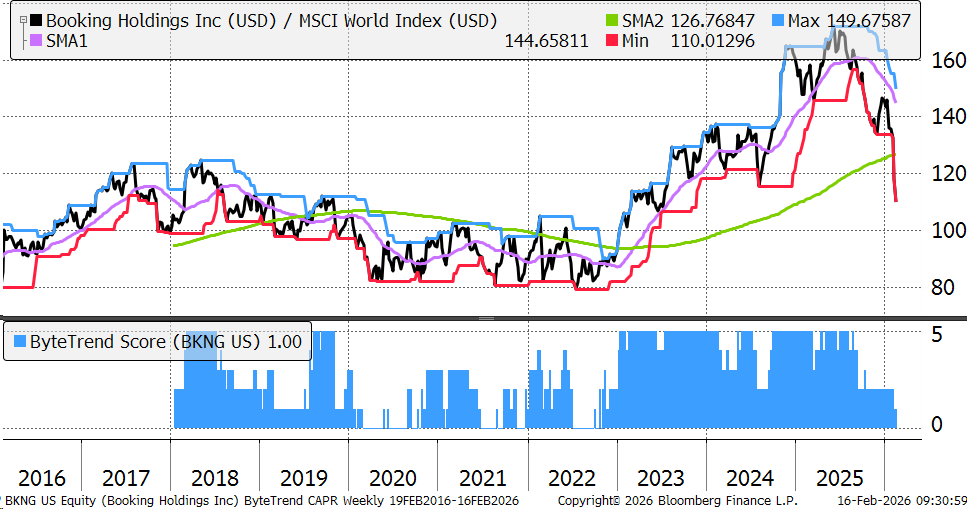
| Booking Holdings Inc. | 27 | 133 | FV | High |
| AppLovin Corporation | 70 | 132 | Exp | High |
| Capital One Financial Corporation | 27 | 132 | OV | Med |
| Boston Scientific Corporation | 34 | 111 | FV | High |
| Prosus N.V. | 28 | 110 | Val | High |
| AXA S.A. | 23 | 93 | OV | Good |
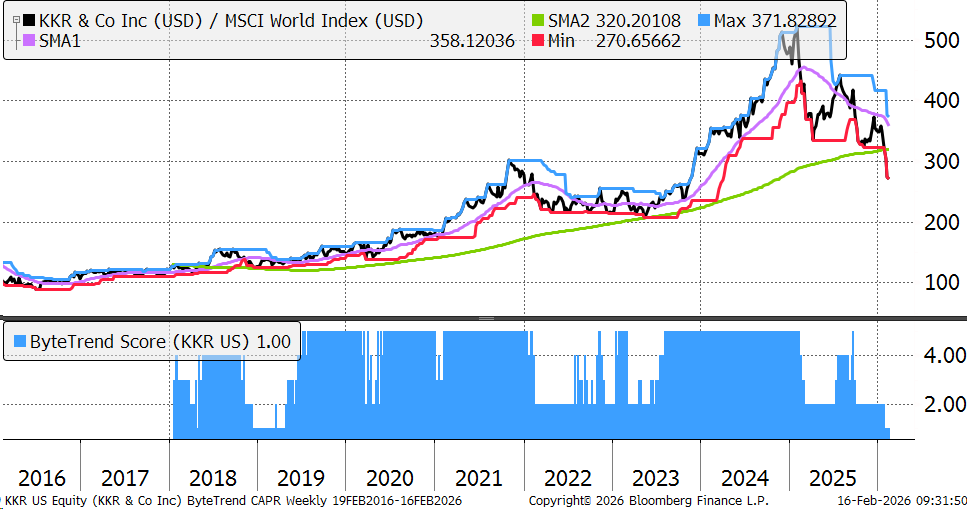
| KKR & Co. Inc. | 33 | 91 | OV | High |
| Apollo Global Management, Inc. | 30 | 73 | OV | High |
| Robinhood Markets, Inc. | 66 | 68 | Exp | High |
| CBRE Group, Inc. | 30 | 42 | OV | Neg |
| Alnylam Pharmaceuticals, Inc. | 43 | 42 | Exp | High |
Booking Holdings (BKNG)
Will AI destroy Booking? Doubtful. What is really happening is the low overdue derating. It still trades on 5x sales, which is high given it now grows at single digits, down from 15% to 20% in the past. All growth stocks eventually become part of the furniture, and this thesis applies to the general derating in high-return stocks in software and internet services.
KKR
Private equity has enjoyed this bull market with high operational leverage on the back of other people’s money. It’s a powerful combination until the market turns down, at which point it works in reverse. Private credit is an area of concern, as is secondaries. IPOs are forecasted to improve in 2026, but it hasn’t happened yet.
Bear Trends
These stocks are trading at the 30-week CAPR lows with a ByteTrend Score of 0. They are in a downtrend. All charts shown are CAPR rebased to 100.
| Name | Annual Vol 30w | Mkt Cap $Bn | Value | Growth |
| Visa Inc. | 18 | 606 | FV | Med |
| Mastercard Incorporated | 20 | 463 | FV | Good |
| The Walt Disney Company | 18 | 187 | FV | High |
| Salesforce, Inc. | 36 | 181 | Chp | High |
| The Charles Schwab Corporation | 20 | 170 | FV | Good |
| HDFC Bank Limited | 14 | 153 | Val | High |
| Accenture plc | 31 | 139 | Val | Med |
| S&P Global Inc. | 30 | 124 | Val | Good |
| Sanofi | 26 | 112 | Val | Neg |
| Intuit Inc. | 39 | 111 | Val | Good |
| Adobe Inc. | 29 | 110 | Chp | Good |
| Tata Consultancy Services Limited | 23 | 107 | FV | Med |
| Automatic Data Processing, Inc. | 21 | 86 | FV | Good |
| Moody's Corporation | 26 | 76 | FV | Med |
| NetEase, Inc. | 31 | 75 | Val | Good |
| Aon plc | 20 | 69 | FV | Med |
| DoorDash, Inc. | 44 | 69 | Val | High |
| Hong Kong Exchanges and Clearing Limited | 20 | 66 | FV | Med |
| Meituan | 37 | 64 | Chp | High |
| PT Barito Renewables Energy Tbk | 36 | 64 | FV | Med |
| Sea Limited | 43 | 63 | Val | Good |
| Infosys Limited | 27 | 61 | FV | Good |
| Hindustan Unilever Limited | 19 | 60 | FV | Med |
| Recruit Holdings Co., Ltd. | 43 | 57 | FV | Good |
| Siemens Healthineers AG | 24 | 54 | Val | Med |
| Arthur J. Gallagher & Co. | 32 | 54 | FV | Good |
| PT Bank Central Asia Tbk | 23 | 53 | Val | Good |
| CSL Limited | 44 | 52 | Val | Good |
| Autodesk, Inc. | 24 | 49 | Val | Good |
| Compass Group PLC | 17 | 48 | FV | Med |
| Nasdaq, Inc. | 25 | 46 | FV | Good |
| Roblox Corporation | 53 | 45 | Val | Med |
| Edwards Lifesciences Corporation | 21 | 45 | FV | Low |
| Coinbase Global, Inc. | 61 | 44 | OV | Neg |
| HCL Technologies Limited | 23 | 43 | OV | Med |
| JD.com, Inc. | 28 | 42 | Chp | Good |
| Waste Connections, Inc. | 16 | 41 | FV | Med |
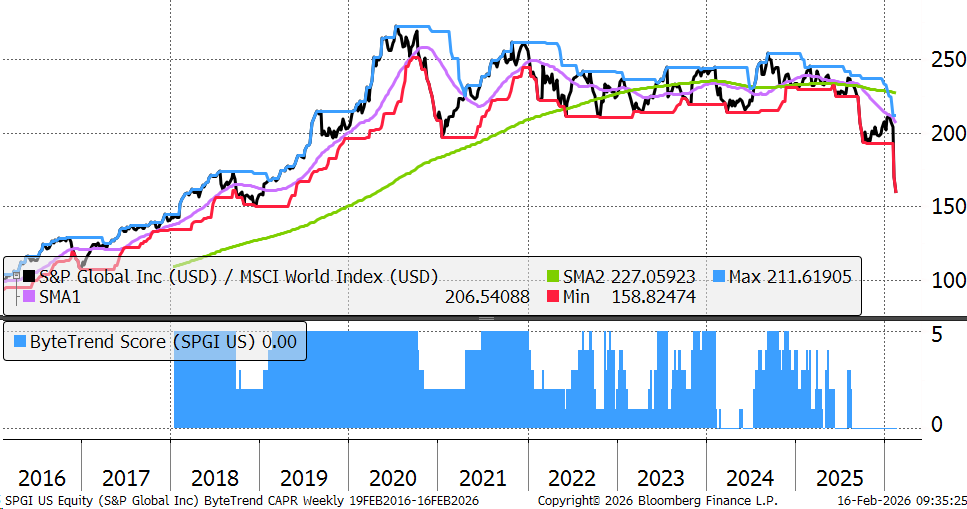
S&P Global (SPGI)
Indices are a great business, but like BKNG above, you can have too much of a good thing. Single-digit growth does not justify a sky-high rating. There are also concerns that AI will eat into its ratings business. PE ratios are not useful measures of value when margins are entering periods of decline.
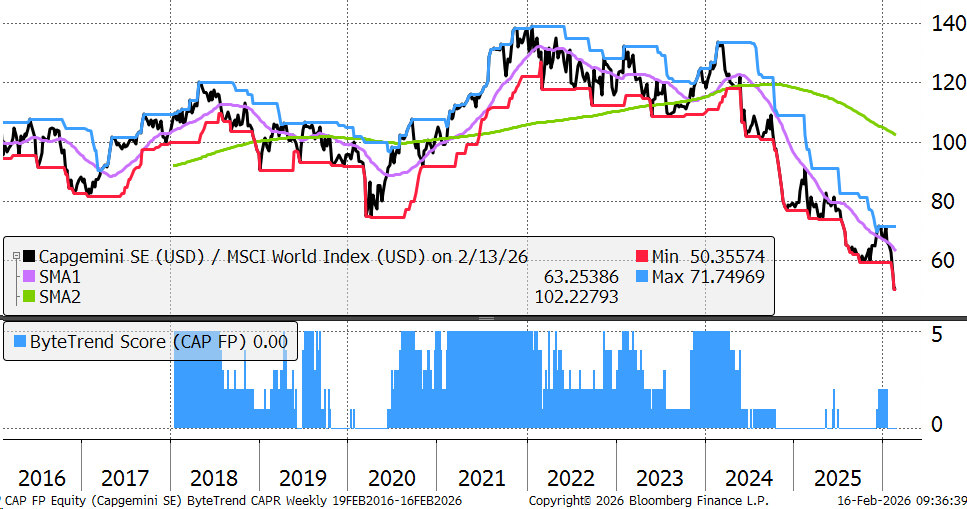
Capgemini (CAP)
CAP is a value-add white-collar business. Their buildings are full of highly educated people advising companies on how to handle the future. The irony is that they are perceived as being under threat from AI. Before we all write off these sorts of companies, they are the ones that understand what is going on better than most. One to keep an eye on when the cycle turns.
GTI 200 Spreadsheet
We are pleased to share the GTI 200 spreadsheet. Download the spreadsheet below to view the CAPR and local currency scores, and more, for the world’s largest 200 stocks. Have a look at the different groups and the main list “All stocks”. The Insights tab is interesting, and don’t forget to expand the columns by clicking on the “+” at the top of the page if you want to see more trend data.
Outlook
GTI has been reporting this rotation since October, and things have come to a head. The divergence is a source of concern for markets because bear markets need leadership, just as bull markets do, and now it has it with technology and services. Sooner or later, the chips will join in. The world, excluding the US and tech stocks, looks healthy.
Thanks for reading GTI.


