


Issue 7;
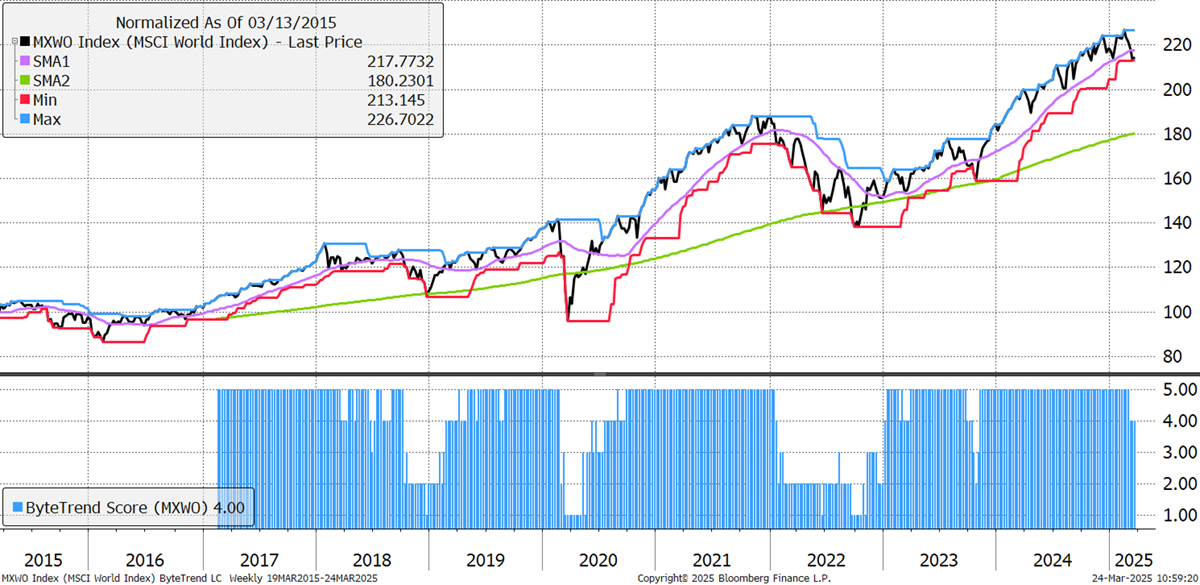
The World drops back from a ByteTrend Score of 5 to a 4 as the index trades below its 30-week moving average. This could be nothing, and it is indeed inevitable after such a strong run, but it has been boosted by a weak dollar. The same chart in EUR would have a ByteTrend score of 3.
World Index – Developed Markets
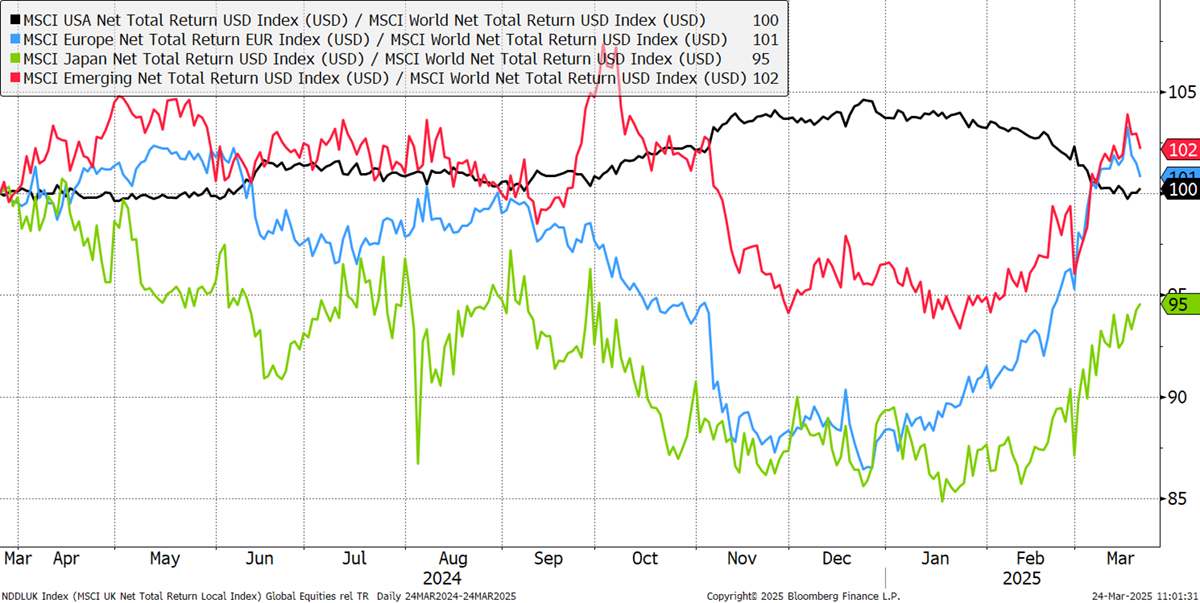
The weakness has come from the USA, but this one-year daily chart highlights a short-term reversal. Europe and EM have turned down, while the US has bounced. The more interesting picture is Japan (green), which has lagged and is now catching up.
Europe, USA, Emerging Markets, Japan CAPR
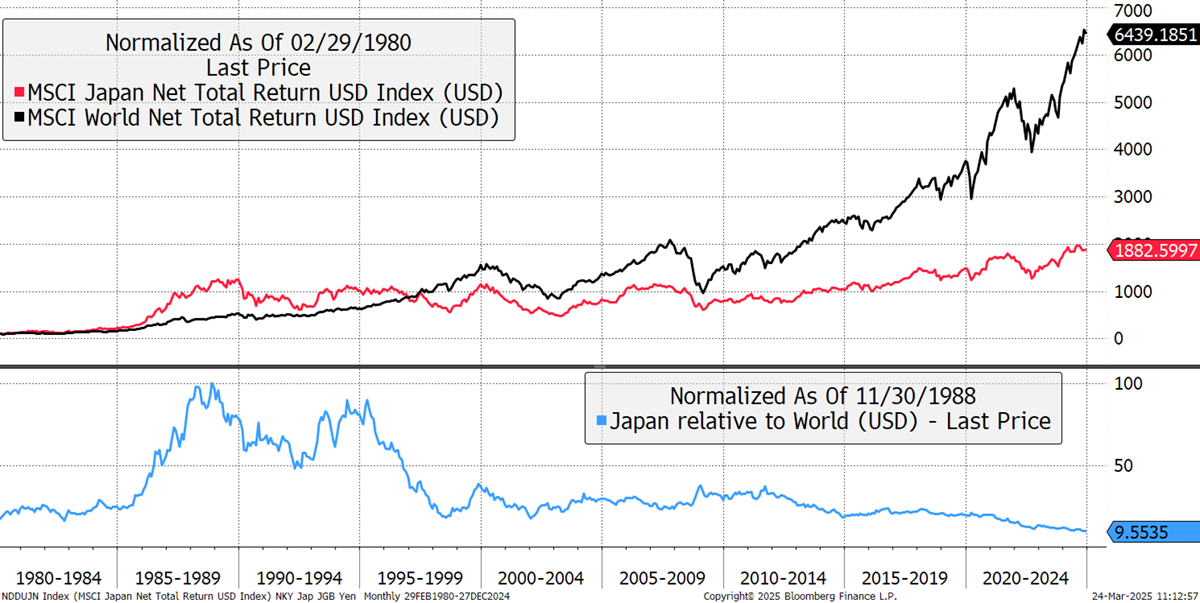
The Japanese stockmarket peaked relative to the world in 1988, as shown against the world index. Since then, it has underperformed by 90.5%, as shown in blue. Could it be that the index bottomed relative to the world on 17 January? It really could.
Japan versus the World since 1980 (Rebased to the 1988 Peak)
Japan is the fourth-largest economy, yet it has only two stocks in the global top 100 and six in the top 200. India has five, and HK/China has 25. It is a short list for Japan, and investors should watch out for new relative highs. This week, Mitsubishi UFJ, Sony and Sumitomo Mitsui showed up in the top 200, which I will highlight later in this update.
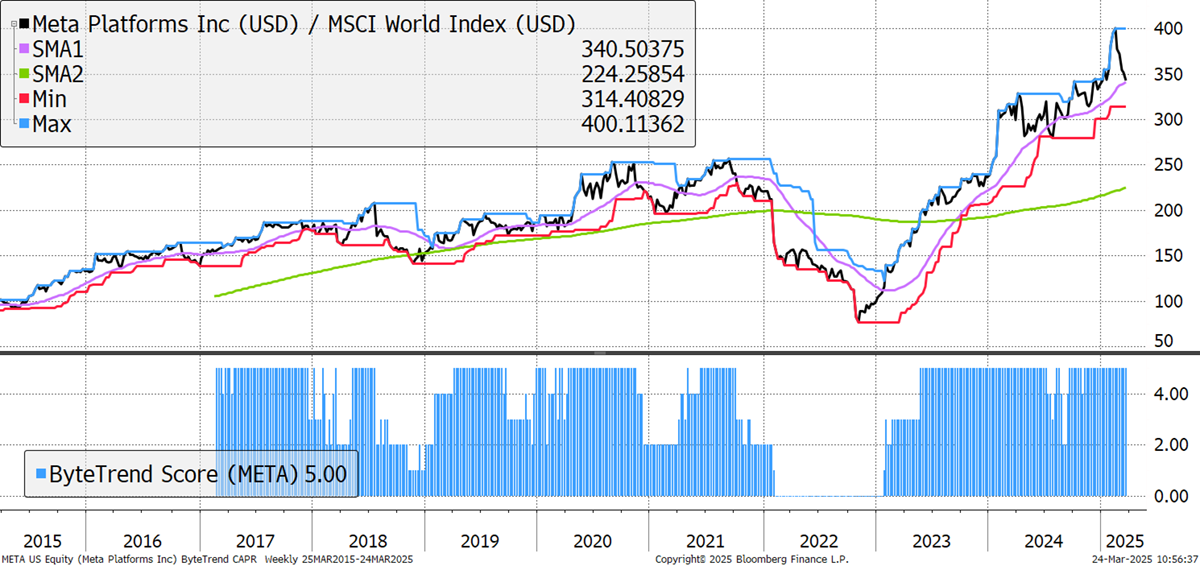
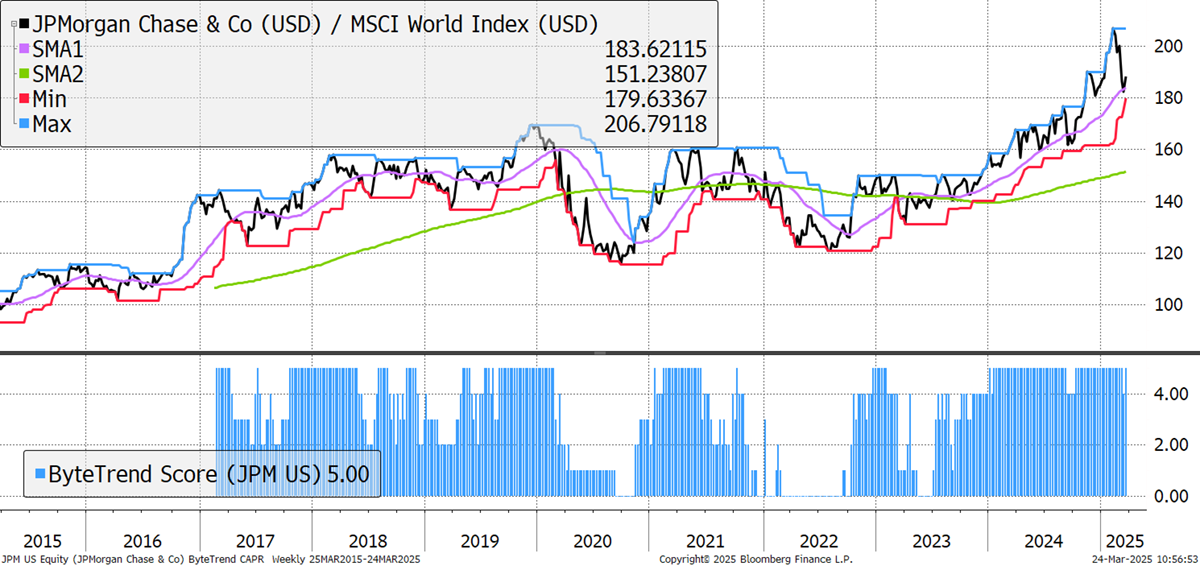
In the USA, there are still some bright stars that hold a ByteTrend score of 5, such as JP Morgan and META, but both have pulled back.
META
JP Morgan
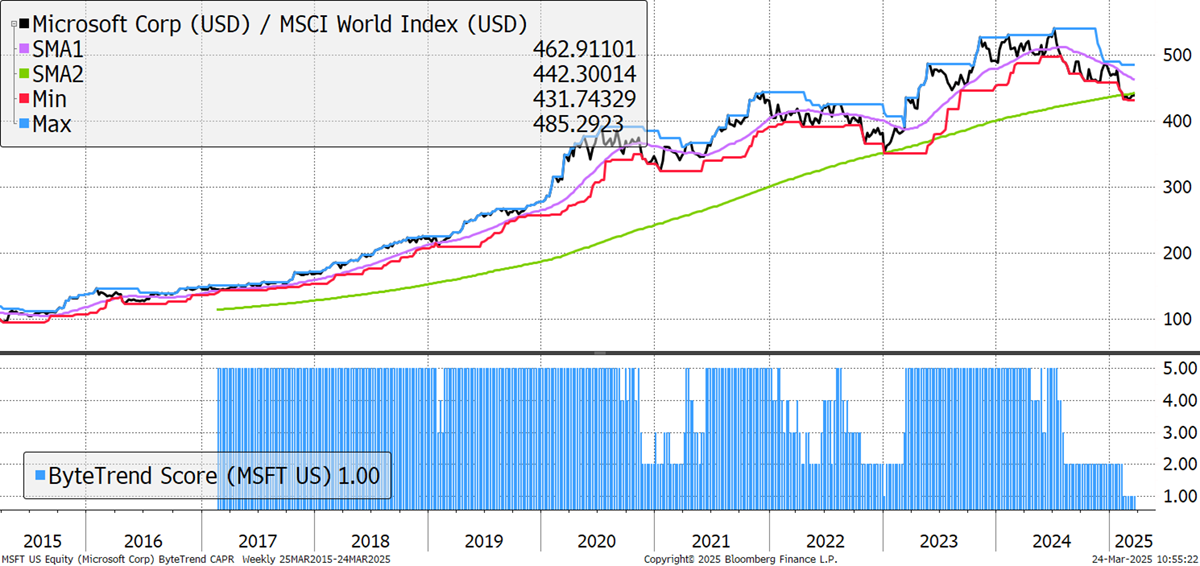
But others have turned down, such as Microsoft, which now holds a ByteTrend score of 1.
Microsoft
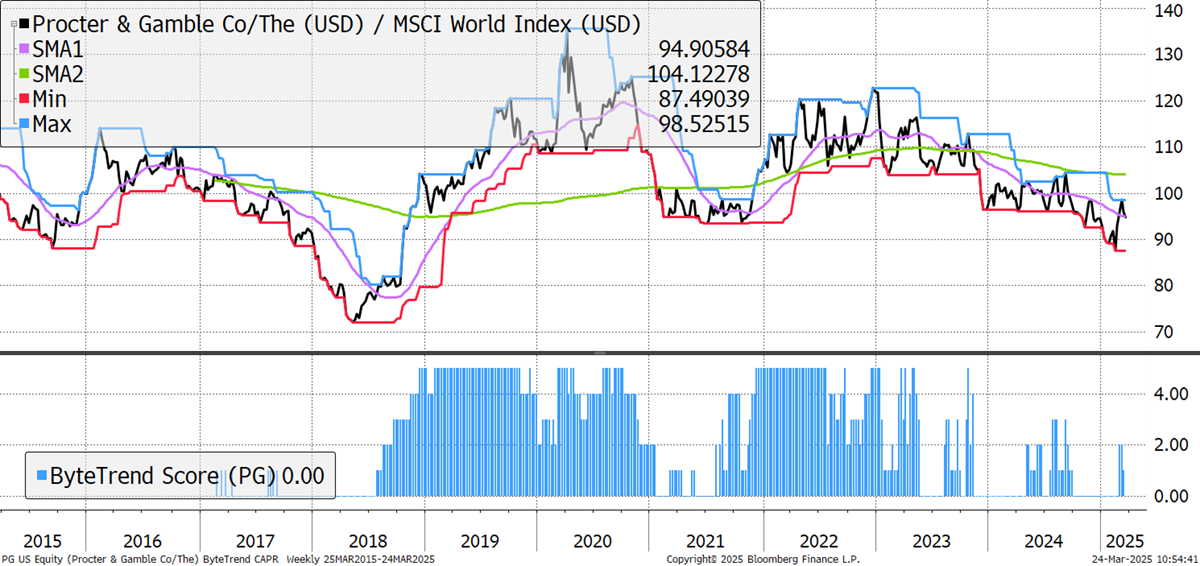
Procter and Gamble has a ByteTrend score of zero.
Procter and Gamble
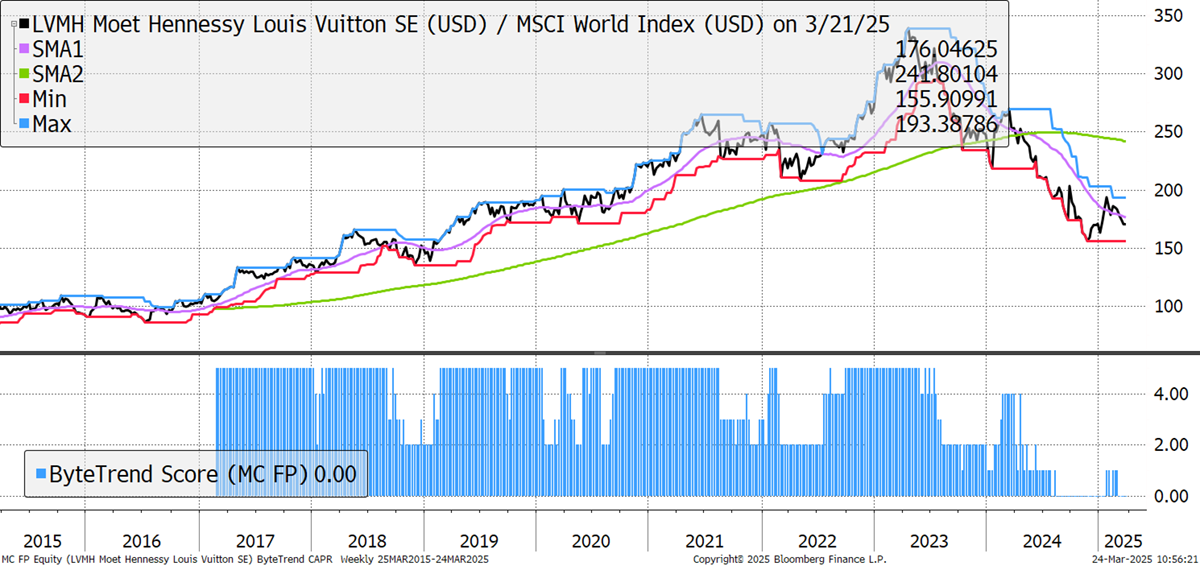
LVMH is another mega-cap on a zero ByteTrend score. It has already lagged the world by 50%, highlighting consumer weakness.
LVMH
In this issue of The Global Trend Investor, we cover the top 200 global stocks from a universe of over 2,000 stocks from both developed and emerging markets. We have analysed the trends and reported the results; these are the highlights.
Glossary of Terms
| LC | Local Currency |
| CAPR | Currency Adjusted Price Relative |
| ATH | All-time High |
| BEST | Premium (discount) to Analysts' Price Forecasts |
| LTG | Long-term Estimated Growth Rate |
| Vol 360 | 360-day Volatility |
| Trend Score 0-5 | ByteTrend Score |
ByteTrend scores a point if:
- The price is above the long-term moving average
- The price is above the short-term moving average
- The long-term moving average is rising
- The short-term moving average is rising
- The price last touched max on the max/min lines
New Trends
Criteria
- % Dev from 30W High CAPR = 0%
- ByteTrend Local currency = 5
- ByteTrend CAPR = 5
- Cumulative Highs in 12W sort low to high
These stocks are trading at four-year highs in both price and CAPR. They do not need to be trading at all-time highs. Unlike the next section, which lists strong trends with new highs, new trends are in their first week with the same criteria. All charts shown are CAPR rebased to 100.


