
Need to Fix the Breadth


Issue 12;
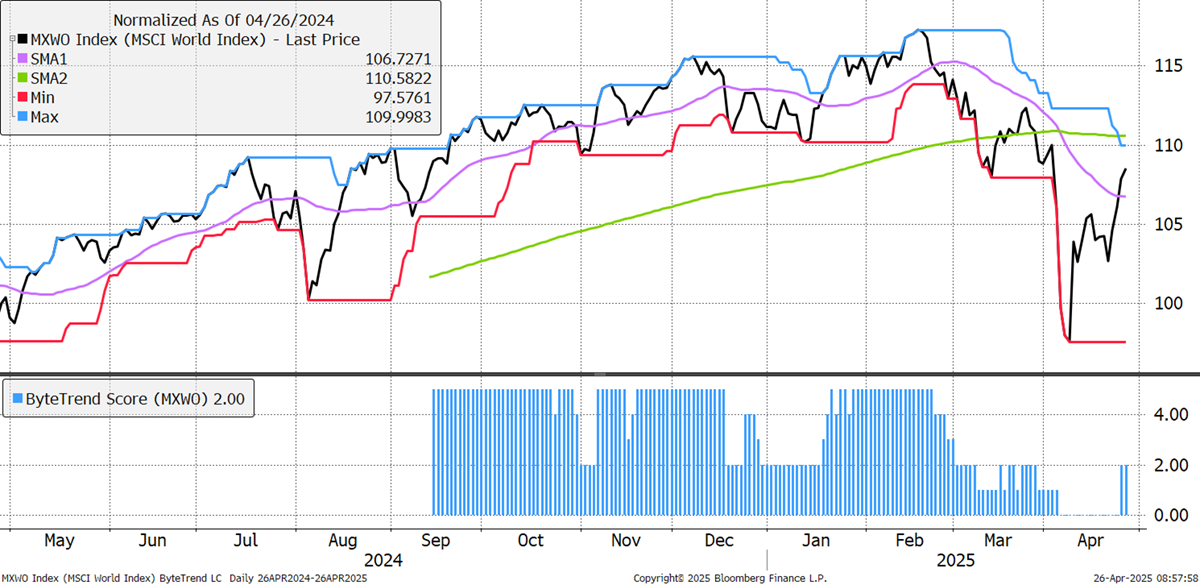
The World Index recovers from a ByeTrend Score of 0 to 3 on the daily chart. It has cut through the 30-day moving average, while the 200-day moving average has turned positive. This is a V-shaped recovery, but resistance lies ahead at 110.
World Index – Developed Markets - Daily
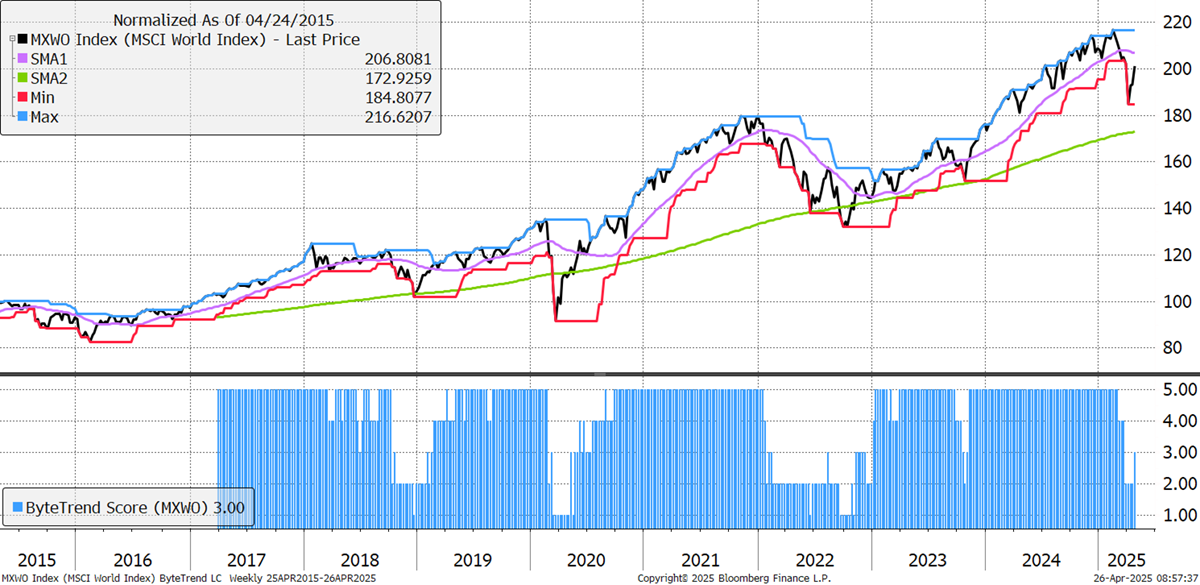
On the weekly chart, the ByteTrend Score has improved to a 3 as the 30-week moving average has stabilised. Despite the carnage in recent weeks, things look healthy, but it is important to reiterate that the dollar has fallen by 10% this year, which flatters the situation.
World Index – Developed Markets - Weekly
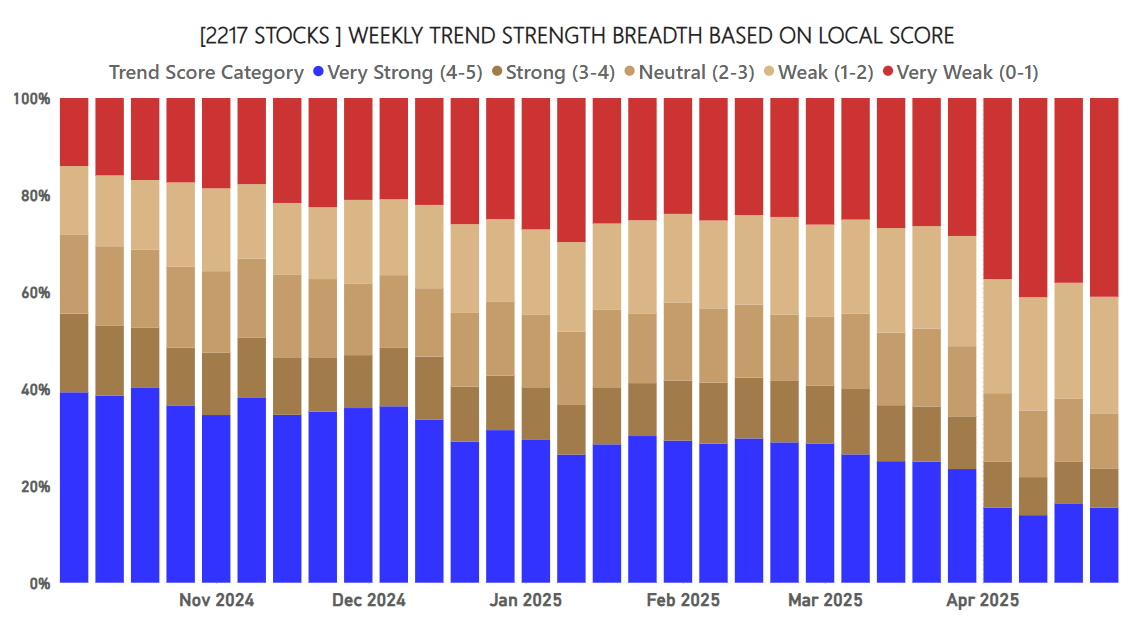
That is illustrated by the deterioration in market breadth. Using local currency across our 2,000+ stock universe, there are fewer stocks with ByteTrend Scores of 5 (blue) and many more with scores of 0 (red).
ByteTrend: Weekly Trend Strength
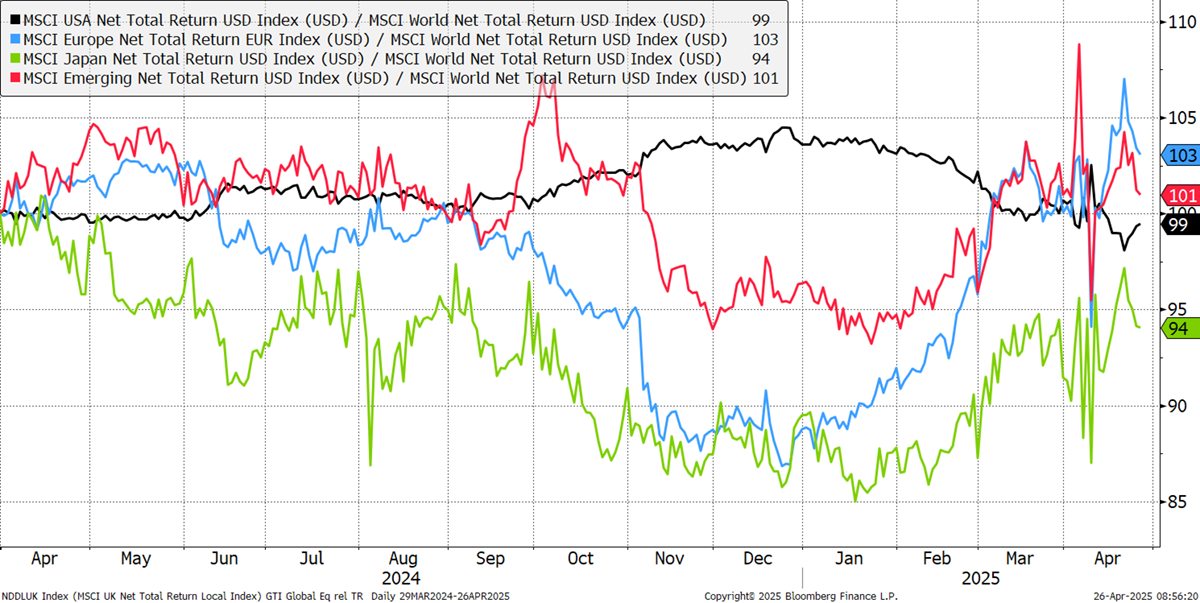
The regional CAPR chart shows a recovery in the US (black) compared to the rest of the world. The US is two-thirds of the index and remains dominant. So far, this looks like a bounce within a downtrend in 2025,
Europe, USA, Emerging Markets, Japan CAPR
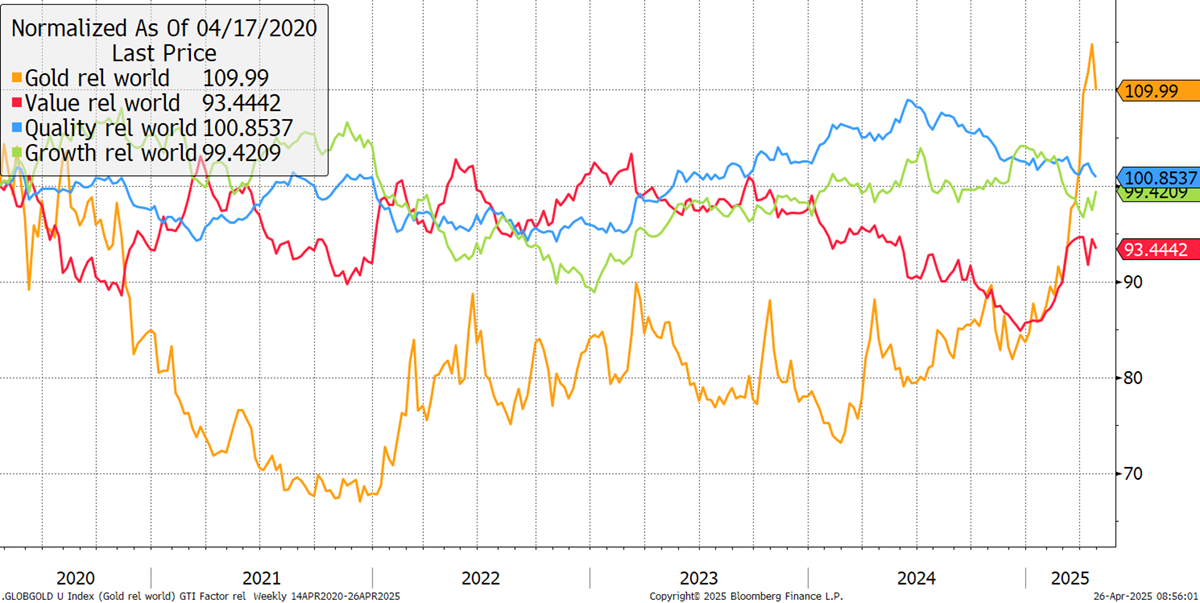
Gold eases back from a dominant position. Growth has seen a little strength over the past week.
Major Factors CAPR since 2020
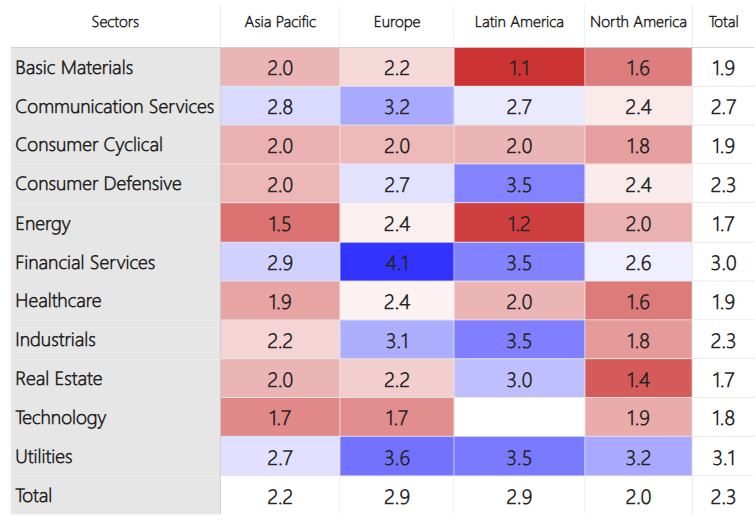
The greatest strength remains in European financial services, which are also strong in Latin America. Utilities, a defensive sector, features well and is the only area of strength in North America. Also notable are industrials in Europe and Latin America.
Energy, real estate and technology are the weakest sectors.
Average ByteTrend Score by Region and Sector Heatmap - CAPR
Please refer to our GTI: User Guide for an overview of the key concepts and terminology used in this report.
Leading Trends with New Highs
These stocks are trading at the 30-week CAPR highs with a ByteTrend Score of 5. All charts shown are CAPR rebased to 100.
| Ticker | FX | Name | CAPR | Dev | Vol | Cap | Sector | Industry |
|---|---|---|---|---|---|---|---|---|
| NFLX | USD | Netflix | 5 | 116 | 39 | 471.2 | Comms | Entertain |
| SAP.DE | EUR | SAP | 5 | 70 | 26 | 324.9 | Tech | Software |
| PM | USD | Philip Morris | 5 | 64 | 25 | 265.0 | Con Disc | Tobacco |
| PLTR | USD | Palantir Tech | 5 | 343 | 93 | 264.5 | Tech | Software Infra |
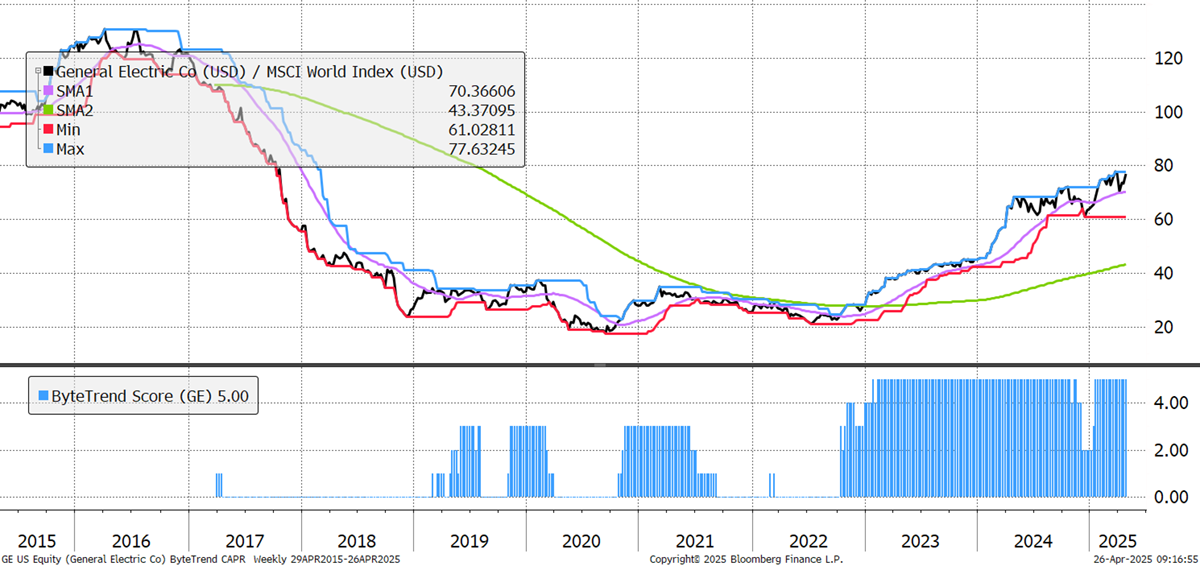
| GE | USD | General Electric | 5 | 98 | 39 | 211.6 | Indust | Aerospace |
| BSX | USD | Boston Scientific | 5 | 75 | 24 | 150.7 | Health | Med Devices |
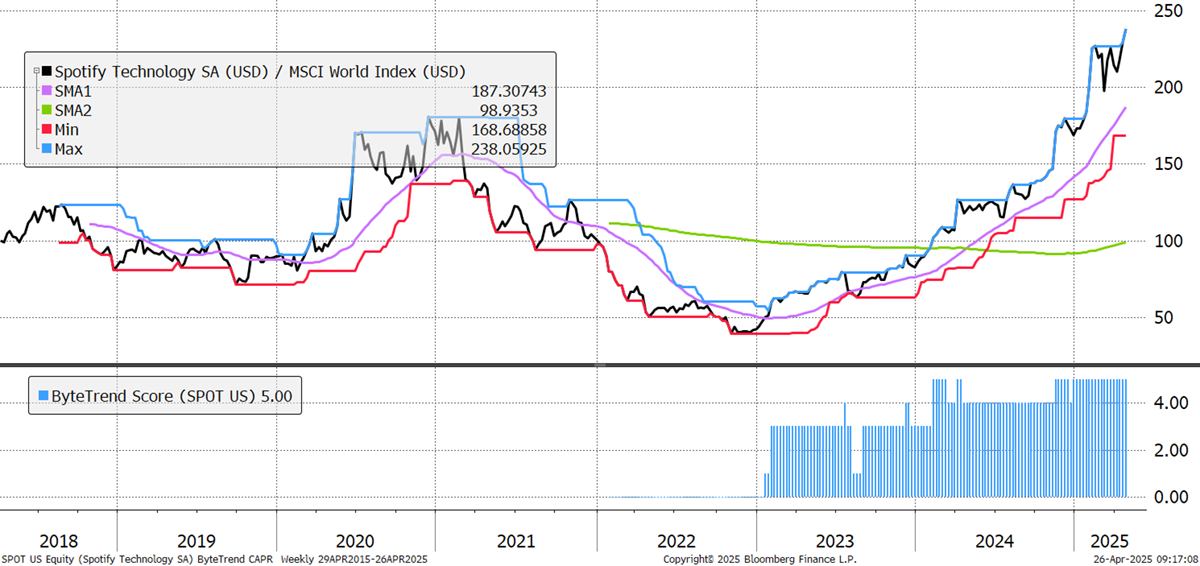
| SPOT | USD | Spotify | 5 | 166 | 44 | 124.3 | Comms | Internet |
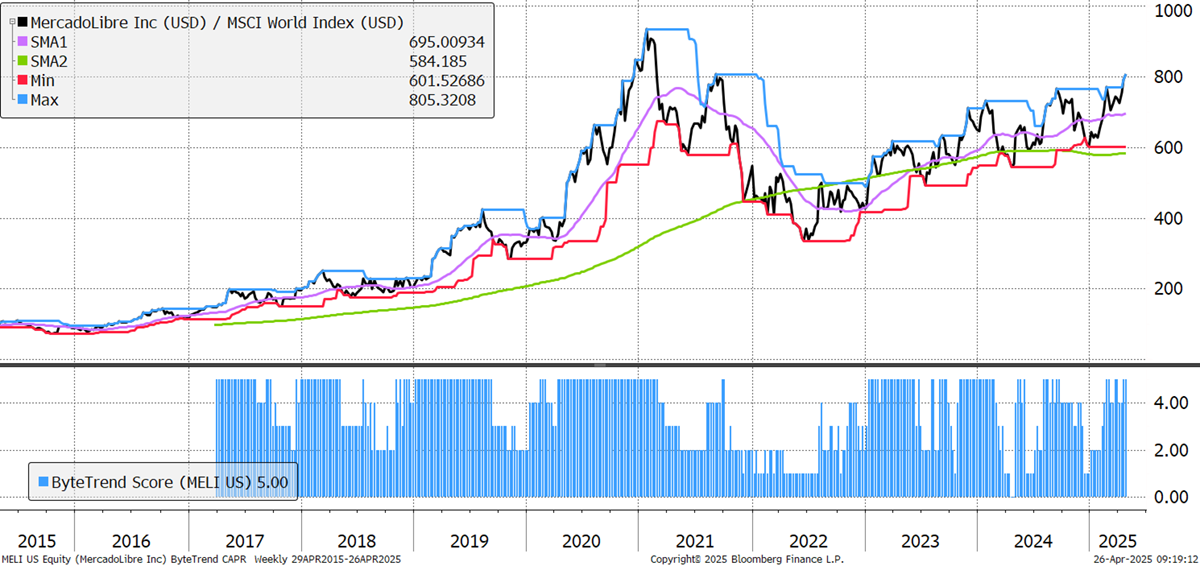
| MELI | USD | MercadoLibre | 5 | 58 | 37 | 112.8 | Con Cycl | Spec Retail |
| SAN.MC | EUR | Santander | 5 | 76 | 34 | 110.5 | Finance | Banks |
| CRWD | USD | CrowdStrike | 5 | 82 | 51 | 105.3 | Tech | Software Infra |
| ISP.MI | EUR | Intesa Sanpaolo | 5 | 69 | 31 | 94.4 | Finance | Reg Banks |
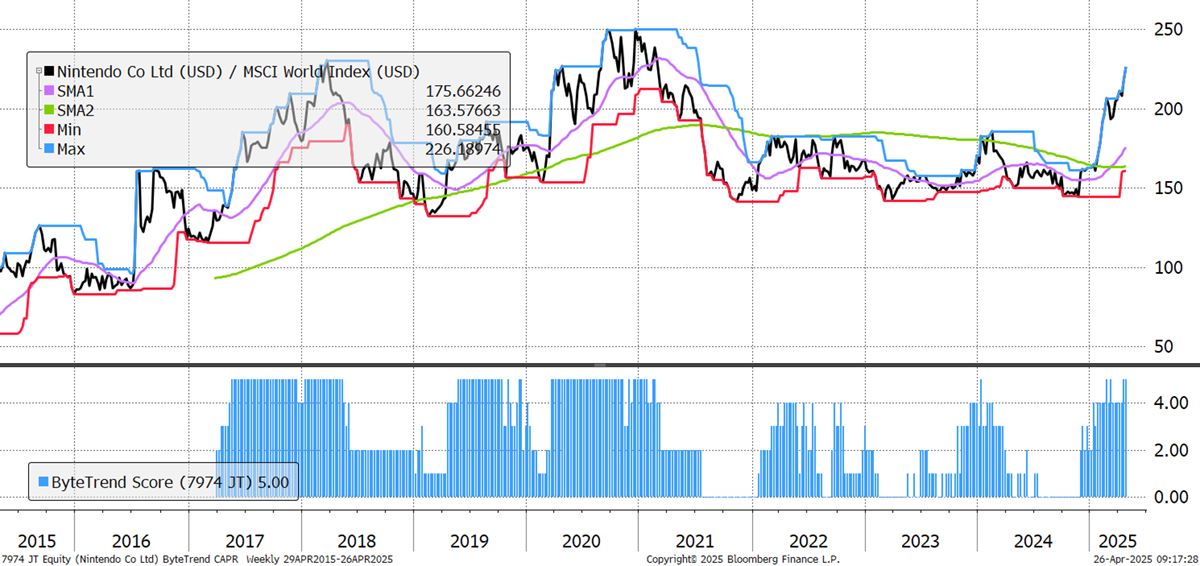
| 7974.T | JPY | Nintendo | 5 | 66 | 29 | 92.4 | Tech | Gaming |
| APH | USD | Amphenol | 5 | 59 | 42 | 91.9 | Tech | Hardware |
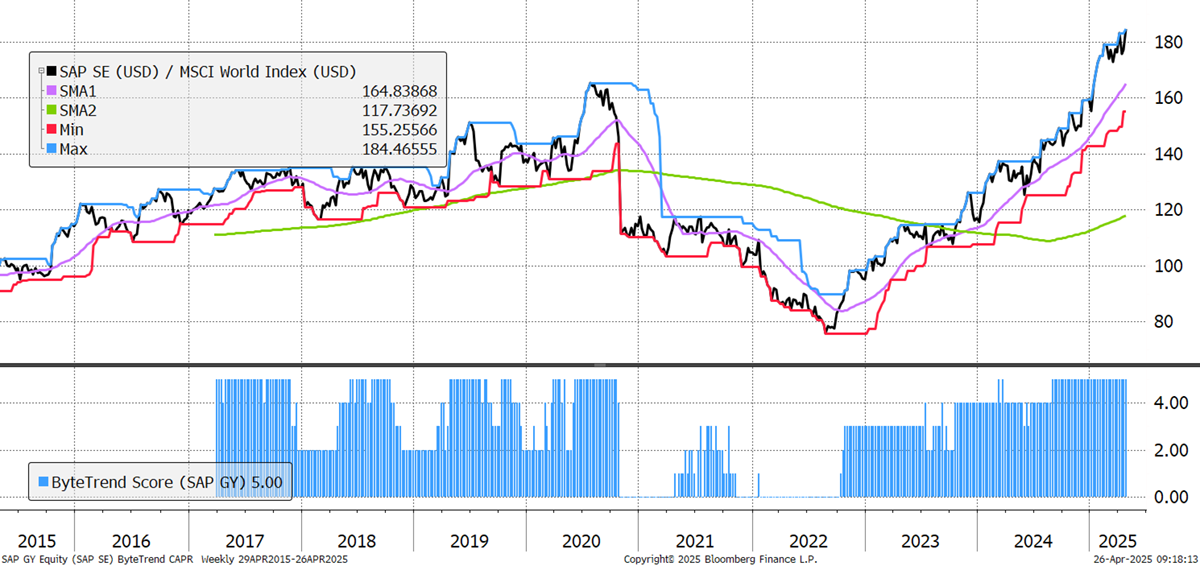
SAP is the world’s largest enterprise software vendor and has built a business on high recurring revenues and switching costs. It has soared as a European tech leader, benefitting from the Q1 rotation out of the US and good results that saw margins expand on revenue growth of 12%, leading operating profits to grow by 58%. In cloud computing, SAP experienced the strongest year-over-year growth among the top 10 enterprise SaaS companies, and it’s at the front of the pack on AI integration too.
SAP
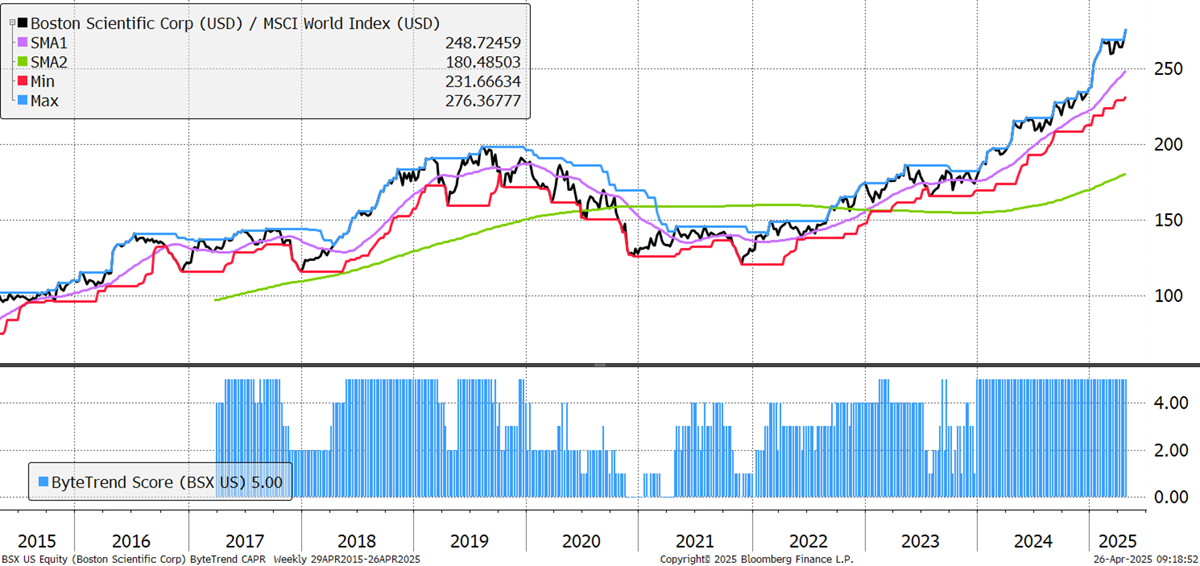
Revenue growth has been accelerating since mid-2022 at Boston Scientific. In Q1 this year, sales were up over 20%, ahead of expectations, with robust growth across divisions and geographies. Guidance is for more mid-teen growth going forward. The US stood out with 31% growth, and Europe, the Middle East and Africa grew 8% ahead of their respective markets. The most outstanding results were in the Electrophysiology business, which was up 143% YoY.
Boston Scientific
General Electric is completing its multi-year transformation, splitting into three focused companies: GE Aerospace, GE Vernova (energy), and GE Health. General Electric is now GE Aerospace, which has 1 million people in the sky using their technology in commercial aviation, and a defence business too. They spent $3bn on R&D in 2024, which is around 3.5% of sales. Returns on invested capital have surged higher in the last two years, now at 18%, as gross margins have doubled to 30%. Earnings-per-share (EPS) was up 60% YoY in Q1.
General Electric
Another European tech success, Spotify’s network effect and economies of scale are powerful drivers. Its participation in the bubble and crash of 2021-22 is a warning for investors not to get over-excited, but for now, it’s going strong, with quarterly record highs for revenue, gross margin, operating income and free cash flow as they finally saw their first full year of profitability. Diversification into audiobooks and video podcasts is a big part of the recent success.
Spotify
MercadoLibre dominates South American e-commerce, especially in Brazil, and has 100 million unique active users. It has grown at pace for some time now, but gross margins have declined from the mid-seventies before Covid to low fifties today. Free cash flow per share, however, has finally taken off, growing 500% in the last couple of years. It grew faster than the market in Brazil, Argentina and Mexico in 2024.
MercadoLibre
Nintendo has powerful intellectual property that keeps each new generation enthralled. However, it reported a sharp decline in financial performance for the first three quarters of fiscal year 2025 (April–December 2024). Net sales dropped 31.4% YoY to ¥956.2 billion, and net profit fell 41.9% to ¥237.1bn. Free cash flow/share had been sliding for a couple of quarters already. A slowdown in switch sales and a delayed release of its next-gen product have also hurt the business. However, its long history of success, large cash pile, and being Japanese have helped it outperform.
Nintendo
There are 76 additional leading trends with new highs in the GTI universe.
Emerging Trends
These stocks are trading at the 30-week CAPR highs with a ByteTrend Score of less than 5. They don’t have to be in an uptrend, just emerging. All charts shown are CAPR rebased to 100.
| Ticker | FX | Name | CAPR | Dev | Vol | Cap | Sector | Industry |
|---|---|---|---|---|---|---|---|---|
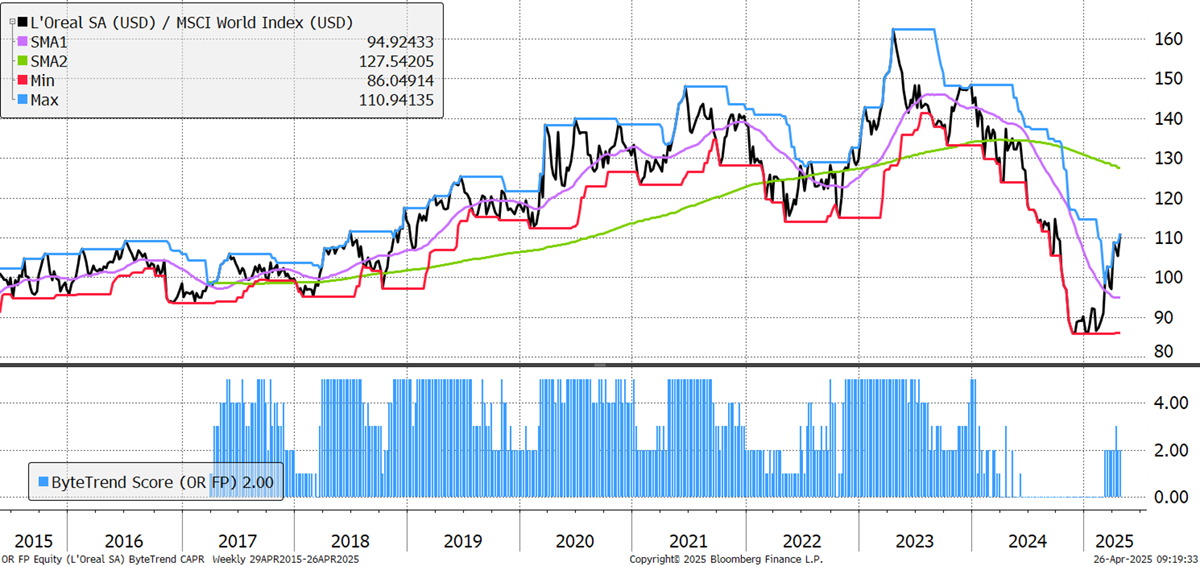
| OR.PA | EUR | L'Oreal | 2 | -2 | 24 | 227.5 | Con Disc | Home prod |
| SCHW | USD | Charles Schwab | 3 | 13 | 33 | 145.0 | Finance | Cap Mkts |
| BA | USD | Boeing | 3 | -6 | 50 | 133.8 | Indust | Aerospace |
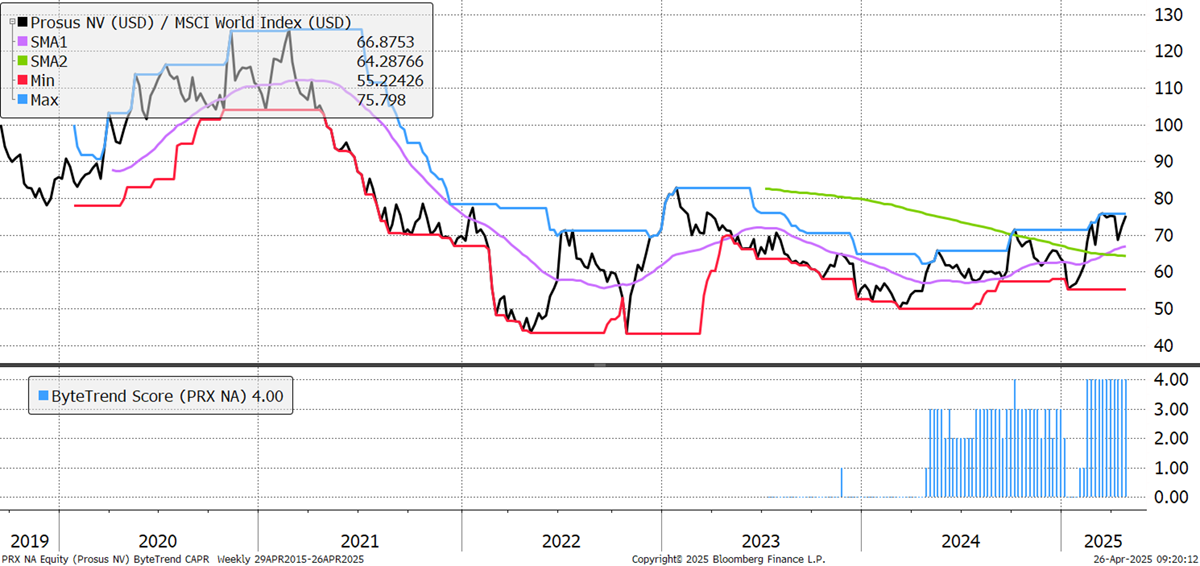
| PRX.AS | EUR | Prosus | 4 | 30 | 37 | 114.8 | Comms | Internet |
| ITUB3.SA | BRL | Itaú Unibanco | 4 | 40 | 21 | 61.5 | Finance | Reg Banks |
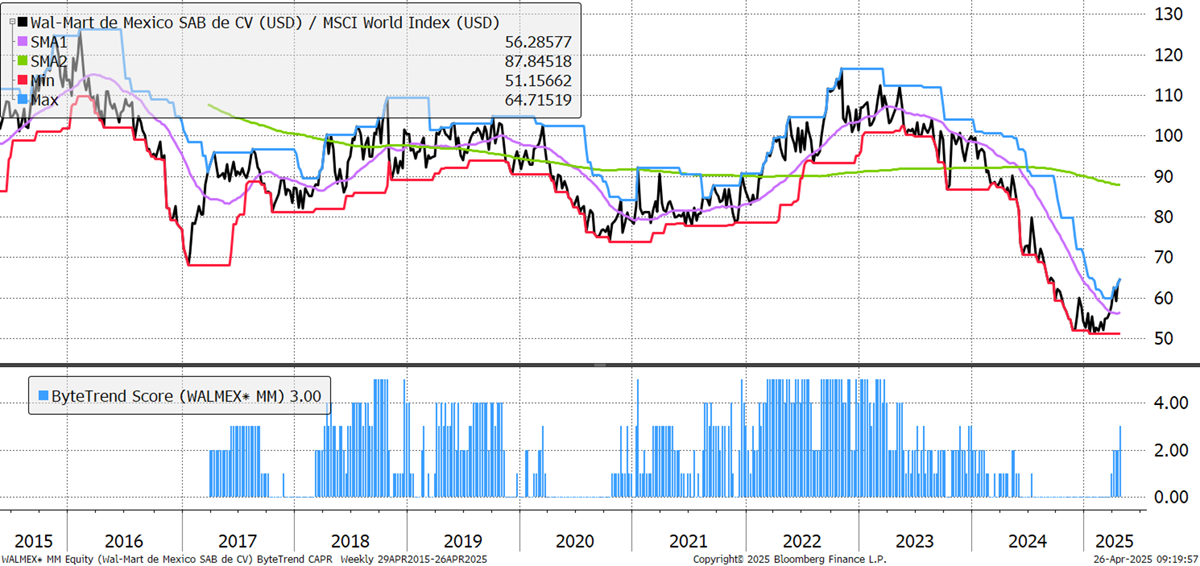
| WALMEX.MX | MXN | Wal-Mart de Mexico | 3 | -9 | 30 | 54.9 | Con Disc | Discounters |
| AMXB.MX | MXN | America Movil | 3 | -3 | 26 | 51.8 | Comms | Telecoms |
| LONN.SW | CHF | Lonza Group | 3 | 5 | 24 | 48.7 | Health | Med Diag |
| EW | USD | Edwards Life | 3 | -13 | 23 | 44.5 | Health | Med Devices |
| RBLX | USD | Roblox | 4 | 36 | 52 | 44.4 | Tech | Gaming |
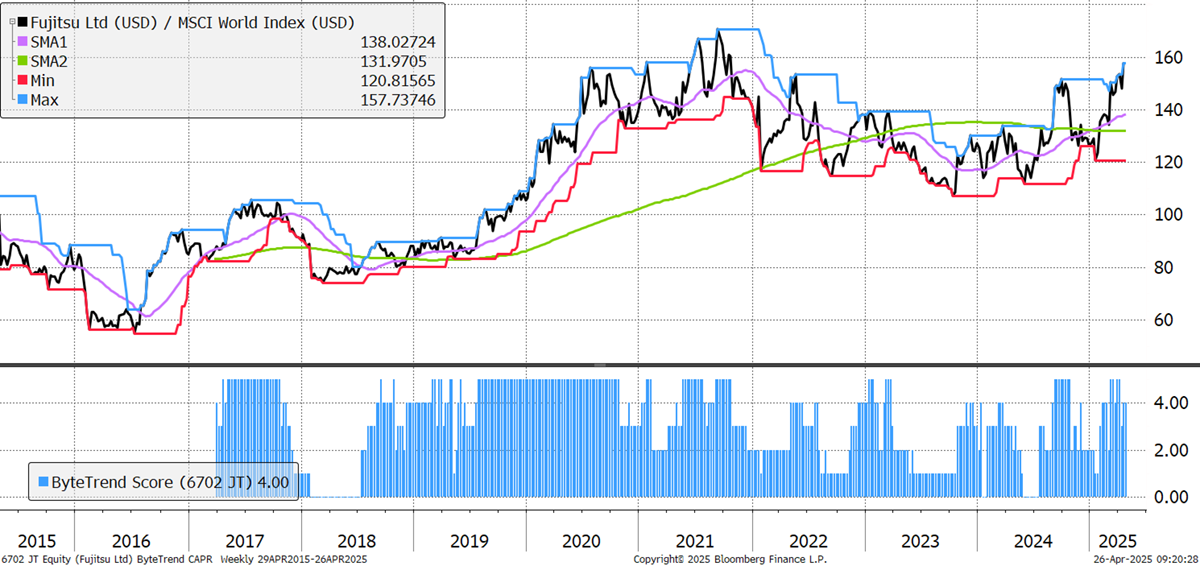
| 6702.T | JPY | Fujitsu | 4 | 45 | 33 | 38.1 | Tech | IT |
| CSGP | USD | CoStar | 3 | 7 | 33 | 34.9 | Real Est | Real Est Serv |
| ZS | USD | Zscaler | 3 | 14 | 43 | 33.4 | Tech | Software Infra |
L’Oréal delivered solid growth of 5.6% and record operating margins in 2024. Fragrances and haircare were the fastest-growing categories, while Europe and emerging markets contributed the most to growth. The US market was more challenging, and China showed slight improvement but remained nearly flat. The China story is a big one for luxury brands, and L’Oréal has suffered along with many others. It has benefitted from the stimulus there and the rotation into Europe, and has hiked its dividend by 6.1% too, continuing a long trend.
L’Oréal
Prosus is a global consumer internet group and one of the largest technology investors and operators in the world. It is looking to add Just Eat (for $4.1bn) to its growing list of over 80 investments across online classifieds, food delivery, fintech and edtech. Its significant holding in Tencent (worth $132bn) is finally starting to add value again, as it’s up 38% in the last year after a long decline.
Prosus
Walmex was the first Walmart store outside the US, opening in Mexico City in 1991, and now has 200,000 local workers. The 2024 sales growth of 8.1% was led by Sam's Club and food/consumables, with Mexico stronger than the rest of its markets. It was driven by same-store sales growth, but they also opened 180 stores. Net profits grew 4.3%. The parent still owns 70% of the shares and is driving its $6bn capex plan to strengthen its Central American dominance.
Wal-Mart de Mexico
Fujitsu is focused on its Service Solutions business, which continued to record progress with revenue of ¥1,563bn, up 2.7% in Q3 2025. They are selling off lower-margin and some foreign businesses, while in Japan, demand for digital transformation and modernisation is strong, leading domestic sales to be 6% higher. It's buying into the corporate governance reforms encouraged by the authorities, seeking to invest more in growth and return more capital to shareholders.
Fujitsu
There are 41 additional emerging trends in the GTI universe.
Weakening
These stocks are trading at the 30-week CAPR lows with a ByteTrend Score above 0. They are weakening trends but not yet downtrends. All charts shown are CAPR rebased to 100.
| Ticker | FX | Name | CAPR | Dev | Vol | Cap | Sector | Industry |
|---|---|---|---|---|---|---|---|---|
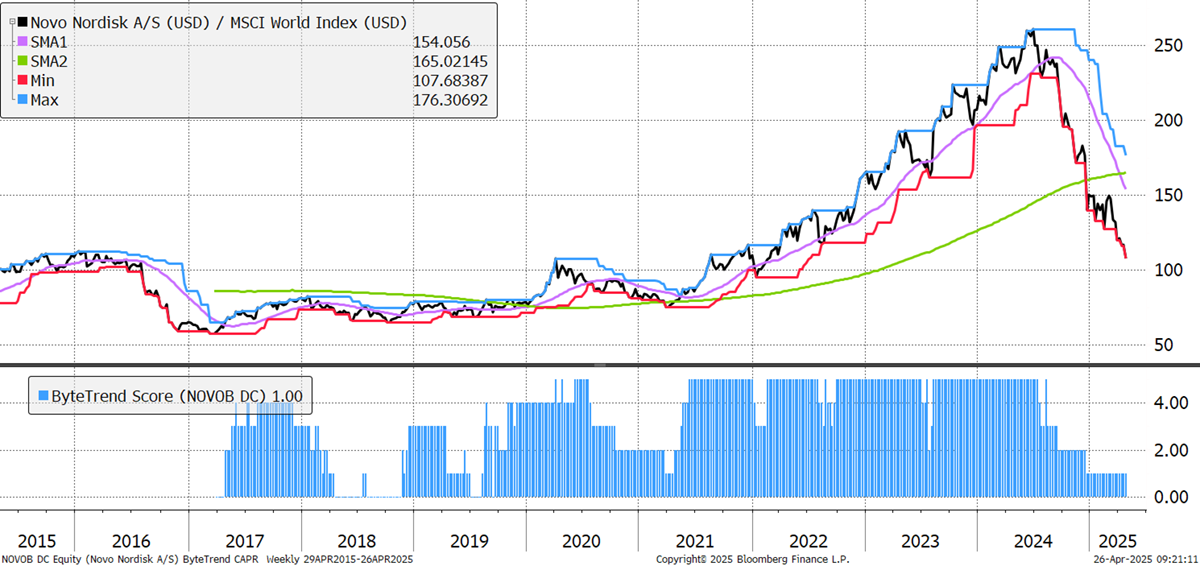
| NOVO-B.CO | DKK | Novo Nordisk | 1 | -29 | 51 | 277.1 | Health | Biotech |
| FI | USD | Fiserv | 3 | 34 | 32 | 99.2 | Tech | IT |
| 6098.T | JPY | Recruit | 1 | 22 | 34 | 74.0 | Indust | Staffing |
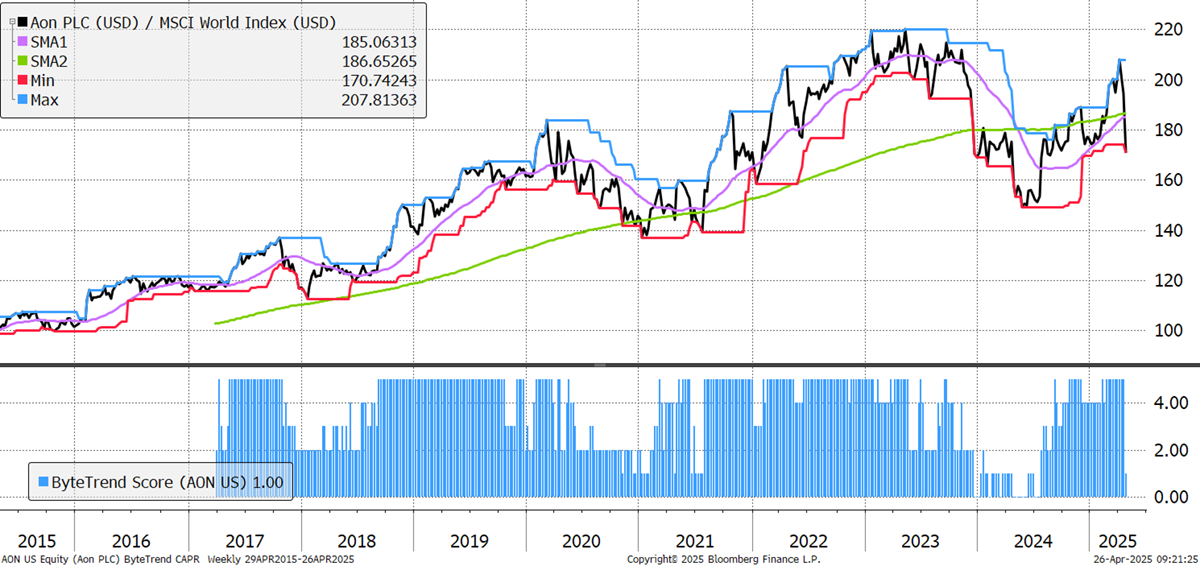
| AON | USD | Aon | 2 | 7 | 23 | 72.5 | Finance | Brokers |
| PETR4.SA | BRL | Petrobras | 1 | 20 | 24 | 71.1 | Energy | O&G Int |
| CARR | USD | Carrier Global | 1 | 12 | 28 | 51.9 | Indust | Constr |
| 600030.SS | CNY | CITIC Securities | 1 | 14 | 44 | 47.9 | Finance | Cap Mkts |
| 2881.TW | TWD | Fubon Fin | 2 | 22 | 17 | 33.3 | Finance | Life Ins |
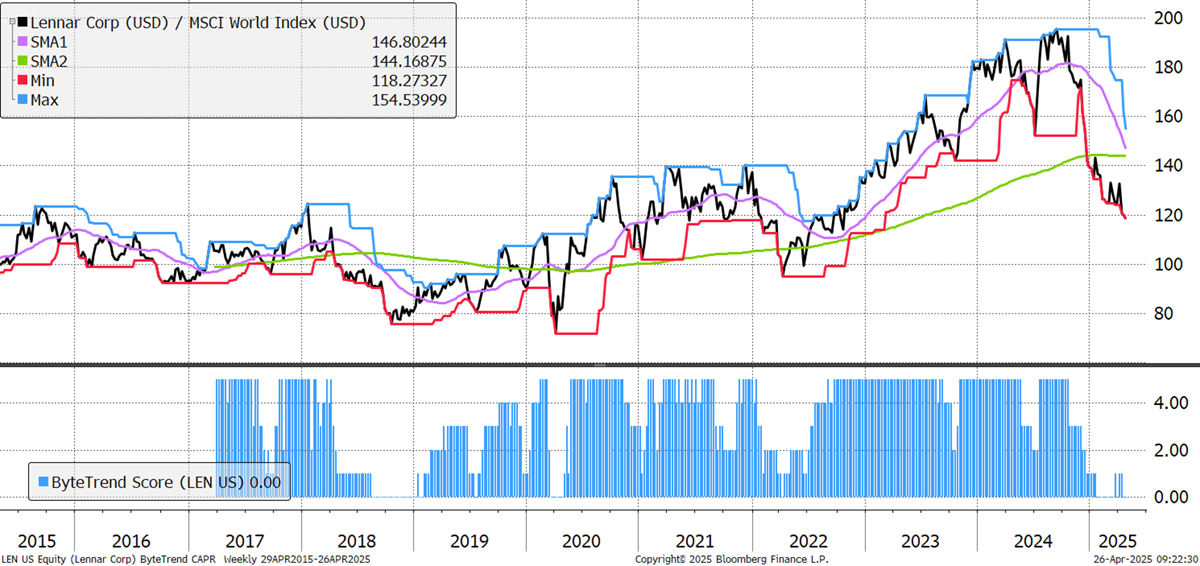
| LEN-B | USD | Lennar | 1 | -4 | 31 | 28.0 | Con Cycl | Resi Constr |
| TSCO | USD | Tractor Supply | 2 | 8 | 32 | 26.5 | Con Cycl | Spec Retail |
| TYL | USD | Tyler Tech | 1 | 17 | 25 | 22.6 | Tech | Software |
Novo Nordisk continues its extraordinary decline. Competition is coming, regulations aren’t going to protect them, and the cannibalisation of their existing business is a growing concern. As results show weakening growth and accelerating capex against incredibly optimistic expectations, investors are feeling quite sore. The move has happened fast; it has lagged global equities by 60% in ten months.
Novo Nordisk
AON featured in the bullish trends segments not too long ago, but it has crashed to a CAPR score of 1. Quarterly results showed slowing organic growth, and it missed expectations. Its adjusted EPS of $5.67 was $0.37 below the consensus estimate of $6.04, and revenue of $4.73 billion also fell short of the $4.83bn expected. Most notably, free cash flow fell 68%.
AON
US housebuilders have been flagging concerns for some time, and Lennar Corp is no exception. Both housing starts and housing completions are falling. In existing home sales, things are also bad. Sales in March were 6% below February and down 2.4% YoY. Hopes for the usual spring sales bounce have come to nothing, and Lennar’s EPS fell from $2.57 to $2.14.
Lennar Corp
There are 27 additional weakening trends in the GTI universe.
Bear Trends
These stocks are trading at the 30-week CAPR lows with a ByteTrend Score of 0. They are in a downtrend. All charts shown are CAPR rebased to 100.
| Ticker | FX | Name | CAPR | Dev | Vol | Cap | Sector | Industry |
|---|---|---|---|---|---|---|---|---|
| UNH | USD | UnitedHealth Group | 0 | -17 | 49 | 382.9 | Health | Med Plans |
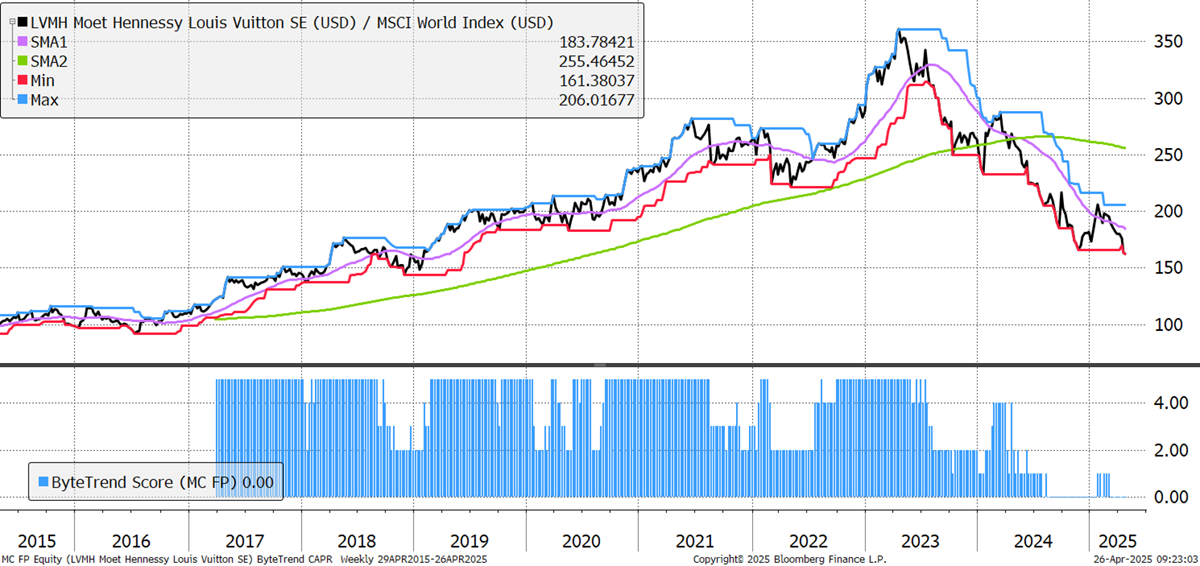
| MC.PA | EUR | LVMH | 0 | -29 | 31 | 283.4 | Con Cycl | Luxury |
| ACN | USD | Accenture plc | 0 | -8 | 24 | 183.7 | Tech | IT |
| TMO | USD | Thermo Fisher | 0 | -23 | 26 | 160.1 | Health | Med Diag |
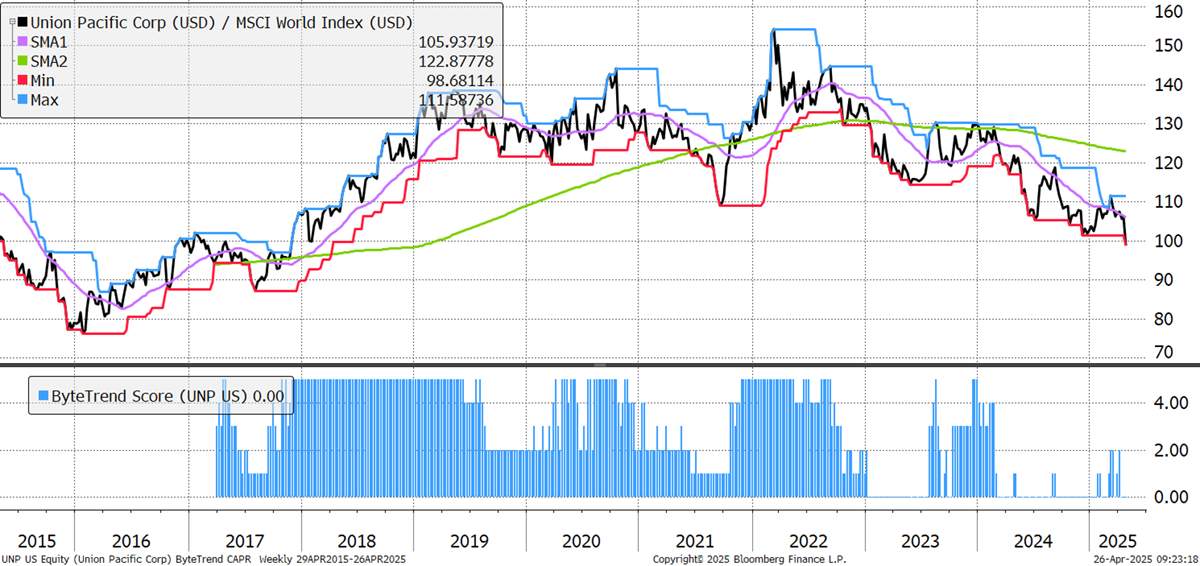
| UNP | USD | Union Pacific | 0 | -6 | 23 | 127.8 | Indust | Rail |
| LOW | USD | Lowe's | 0 | 0 | 21 | 123.6 | Con Cycl | Home Impr |
| 3690.HK | HKD | Meituan | 0 | -19 | 57 | 105.3 | Con Cycl | Spec Retail |
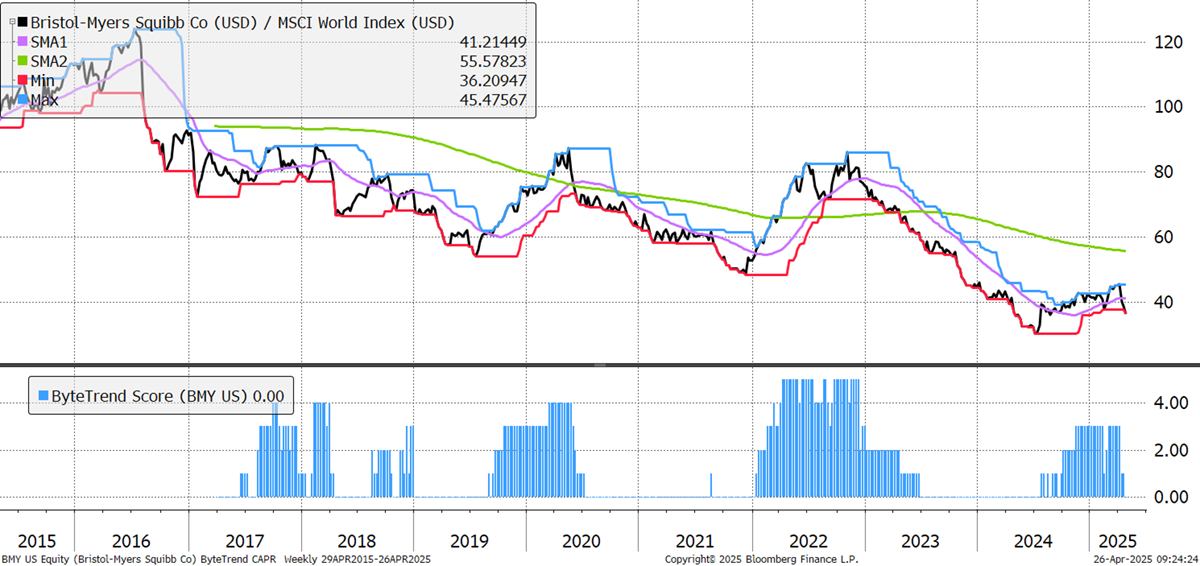
| BMY | USD | Bristol-Myers Sq | 0 | -22 | 29 | 97.5 | Health | Drug Makers |
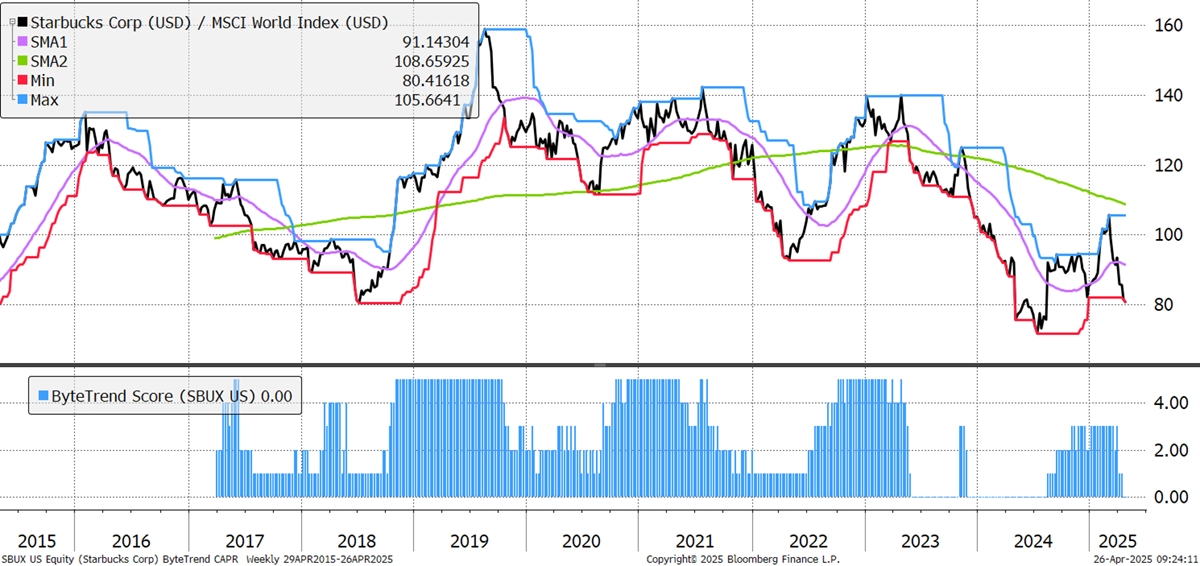
| SBUX | USD | Starbucks | 0 | -13 | 36 | 95.2 | Con Cycl | Restaurants |
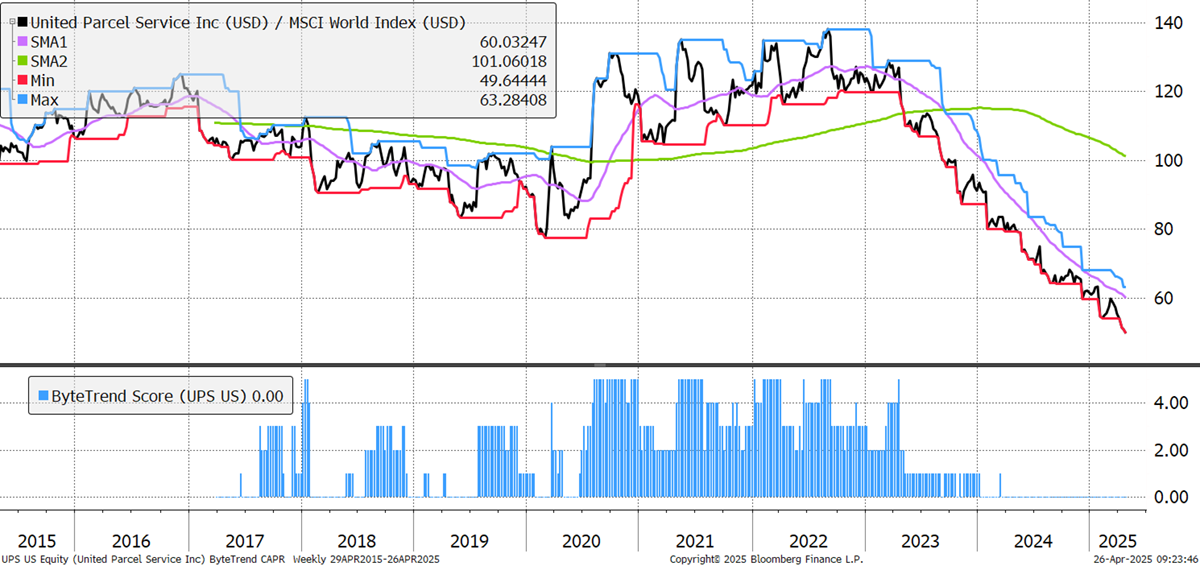
| UPS | USD | UPS | 0 | -41 | 29 | 83.0 | Indust | Logistics |
| APD | USD | Air Products | 0 | -3 | 33 | 59.4 | Materials | Special Chem |
| 2317.TW | TWD | Hon Hai Precision | 0 | 9 | 28 | 59.3 | Tech | Hardware |
Luxury behemoth LVMH was valued at 7.5x its sales not too long ago. That’s back to 3.3x and still above its pre-2017 peak. People thought luxury was like software, but China’s multi-year weakness dispelled that myth. The company has an incredible heritage and thinks in decades, not quarters. However, growth began slowing in late 2021 and hasn’t stopped, and investors finally lost patience in 2023. Its brands will endure, and it won’t underperform forever, but the world doesn’t look like it’s minting many new millionaires right now, which is what it needs to grow.
LVMH
Growth slowed at Union Pacific in early 2022 and has never returned. American trade and transport are not a great place to be right now, and its underperformance has continued in April, taking it back to a CAPR 0. This doesn’t bode well for trade.
Union Pacific
Revenues at Bristol-Myers Squibb surged straight after the pandemic but fell back into negative territory soon after. Their return to positive territory gave it some hope in 2024, but that faded when growth slowed again in Q1 2025. It has distinguished between its legacy and growth portfolios, and the latter grew 18% in the quarter, driven by the launch of Cobenfy last October. They claim it is the first “truly novel” mechanism for the treatment of schizophrenia in decades.
Bristol-Myers Squibb
The star CEO rule is applying so far – investors tend to overestimate the ability of a successful leader to transmit that success to an entirely new organisation and industry. The bounce from Brian Niccol’s recent appointment (from Chipotle, which also announced weak results) has faded. Starbucks lost its mojo slowly, and it will take a superb effort to turn it around for good. It announced Q2 2024 revenues of $9.4bn, a global comparable store sales decline of 4%.
Starbucks
UPS’ underperformance is remarkably deep and consistent, having first fallen to a CAPR 0 sixteen months ago. However, it is starting to see some green shoots, with operating profits up 11%. Additionally, for the seventh year running, it was the industry leader in on-time service during peak delivery season. The trade shutdown from tariffs, however, outweighs all this, as reports mount of empty ports and halted shipments.
UPS
There are 208 additional bear trends in the GTI universe.
Outlook
The recovery is underway, but against a weaker US dollar, which has held back the US recovery in global terms. There are a few bright spots, but they tend to be in the defensive sector, with the clear outlier being European financials.
Overall, global equities need stronger breadth readings to give us confidence that there is sufficient strength to drive a global bull market. So far, there isn’t.
Thanks for reading GTI.


