
Nothing Good Happens Below the 200-Day Moving Average


Issue 58;
- Bond yields surge
- The VIX is yet to spike
- Safe havens vanish
Global Trends is a deep dive into global equities. The aim of this analysis is to better understand which countries, sectors, industries, and stocks are driving market returns. Not only does it help investors identify opportunities, but it also highlights the risks. We try to condense as much important information as possible, focusing on what really matters each week. Embrace this as a weekly discipline, and you’ll soon have a much better understanding of global financial markets.
The World Index falls to a ByteTrend Score of 1 in USD. The price is now below the 200-day moving average. The trend remains upwards and will take time to turn negative as the market falls.
World Index – Developed Markets – Daily
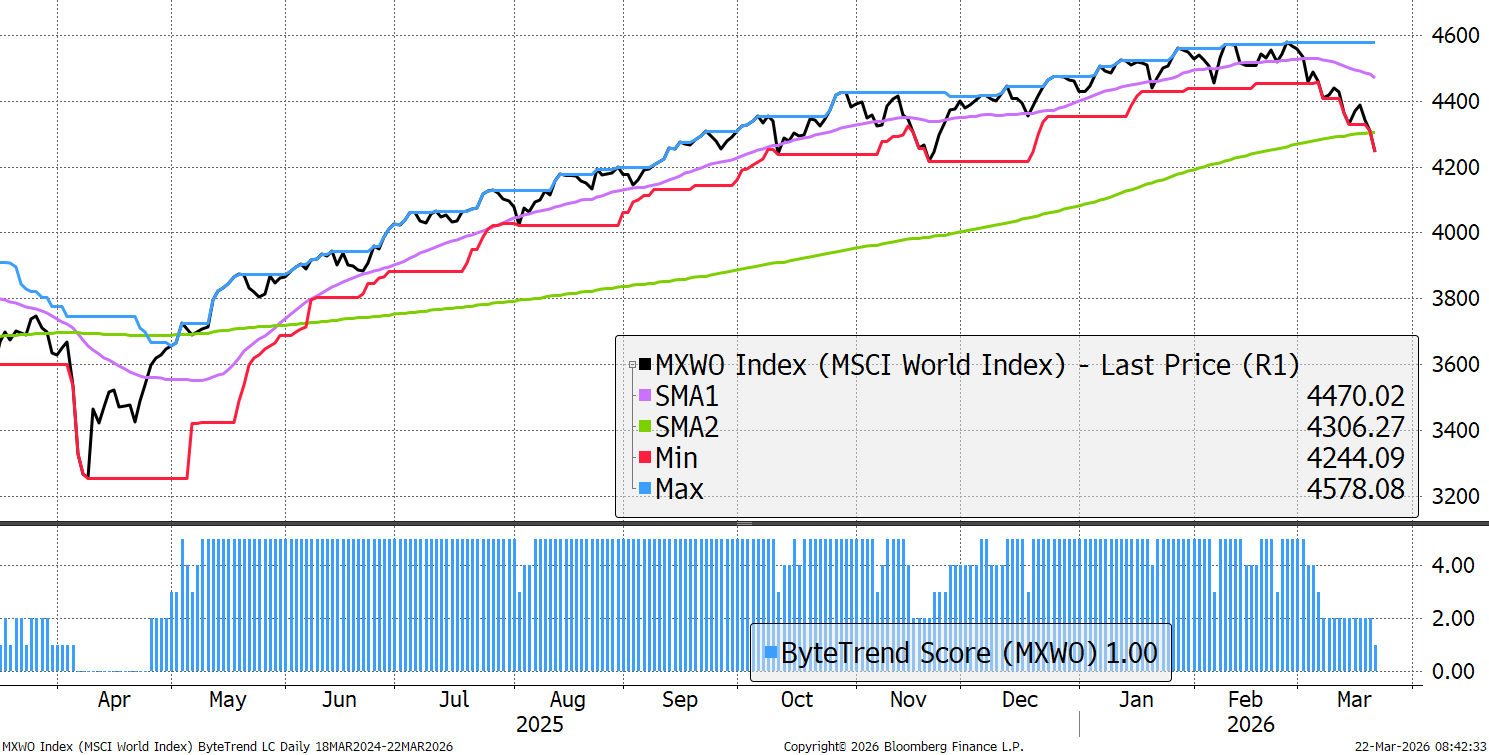
The old saying is that nothing good happens below the 200-day moving average, because that is life during bear markets. It is impossible to say if the market will correct further or not, but it certainly could. In Europe this morning just 18% of stocks are trading above their 50-day moving average and 43% above their 200-day moving average.
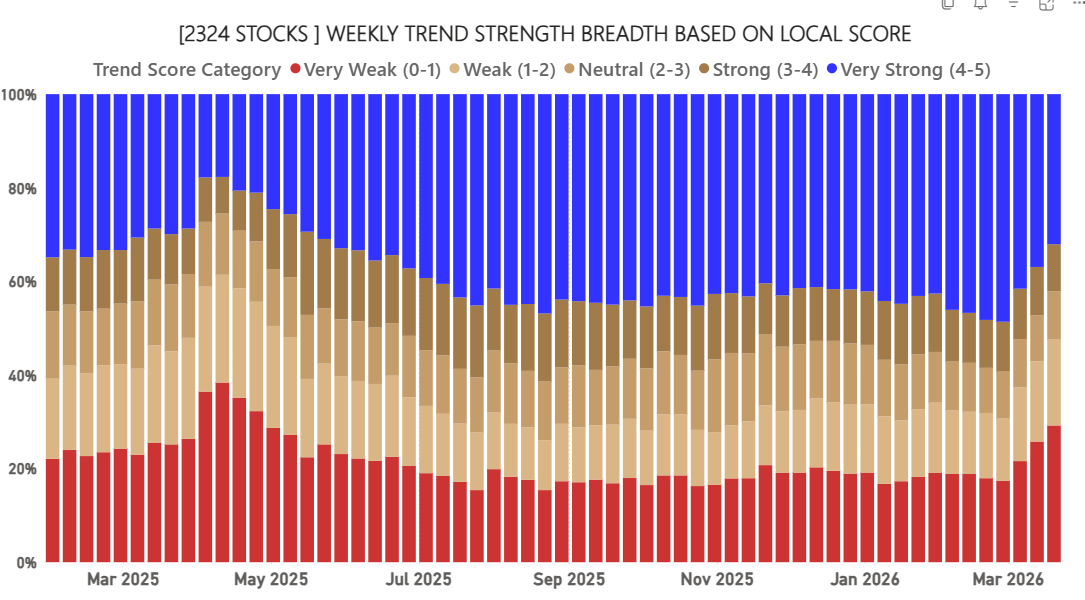
Global Equity Breadth – Local Currency
Breadth is now deteriorating rapidly since hostilities in Iran began.
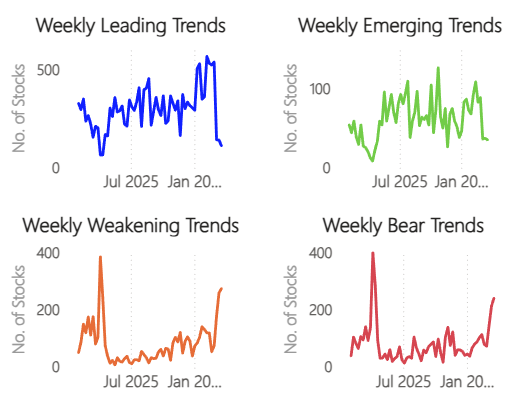
Explosion in Bear Trends
The number of new price highs has collapsed, while the number of new lows has exploded.
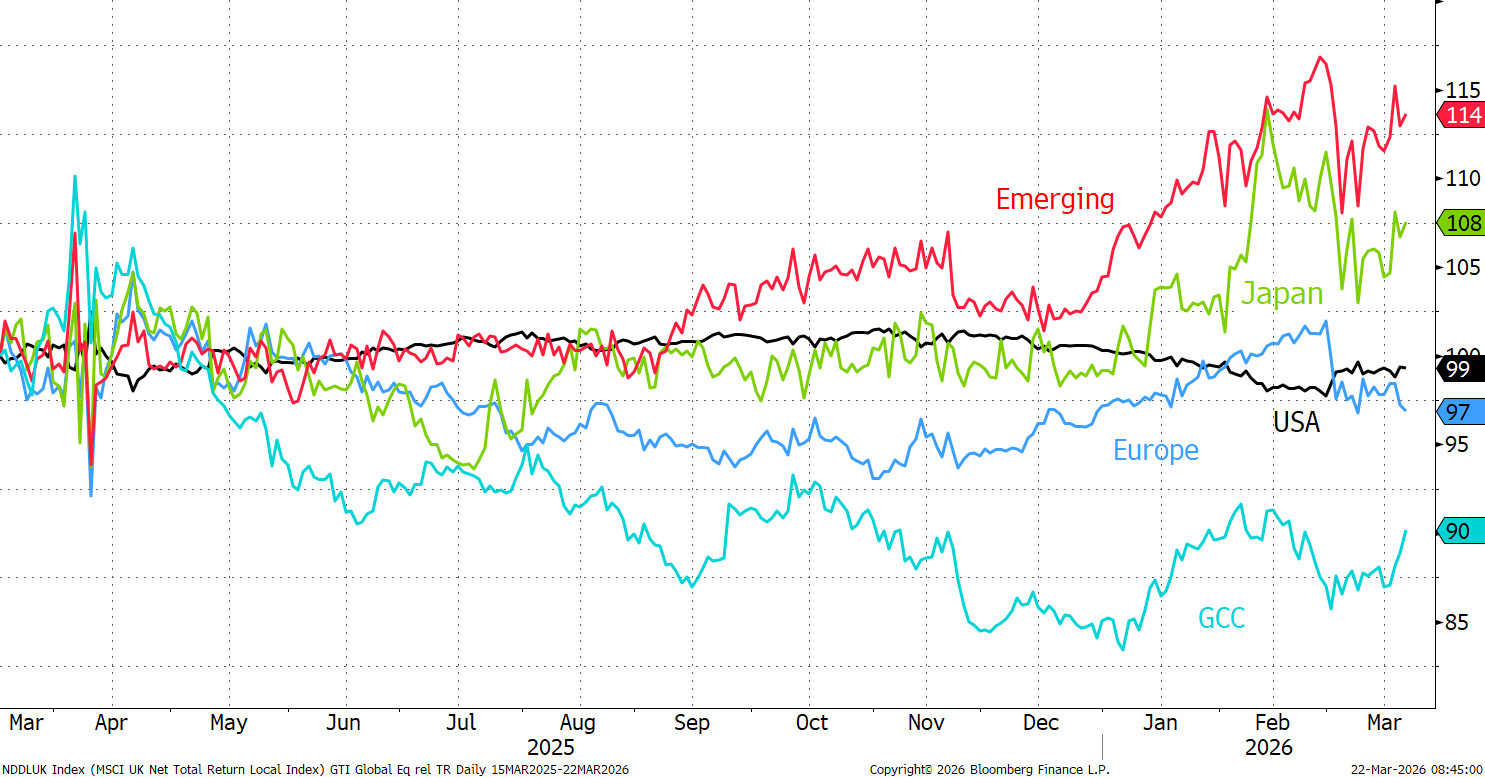
Regional Returns
It is remarkable that the Middle East (GCC) Indices are outperforming despite the collateral damage. Europe is struggling slightly, but regional performance has been quite neutral.
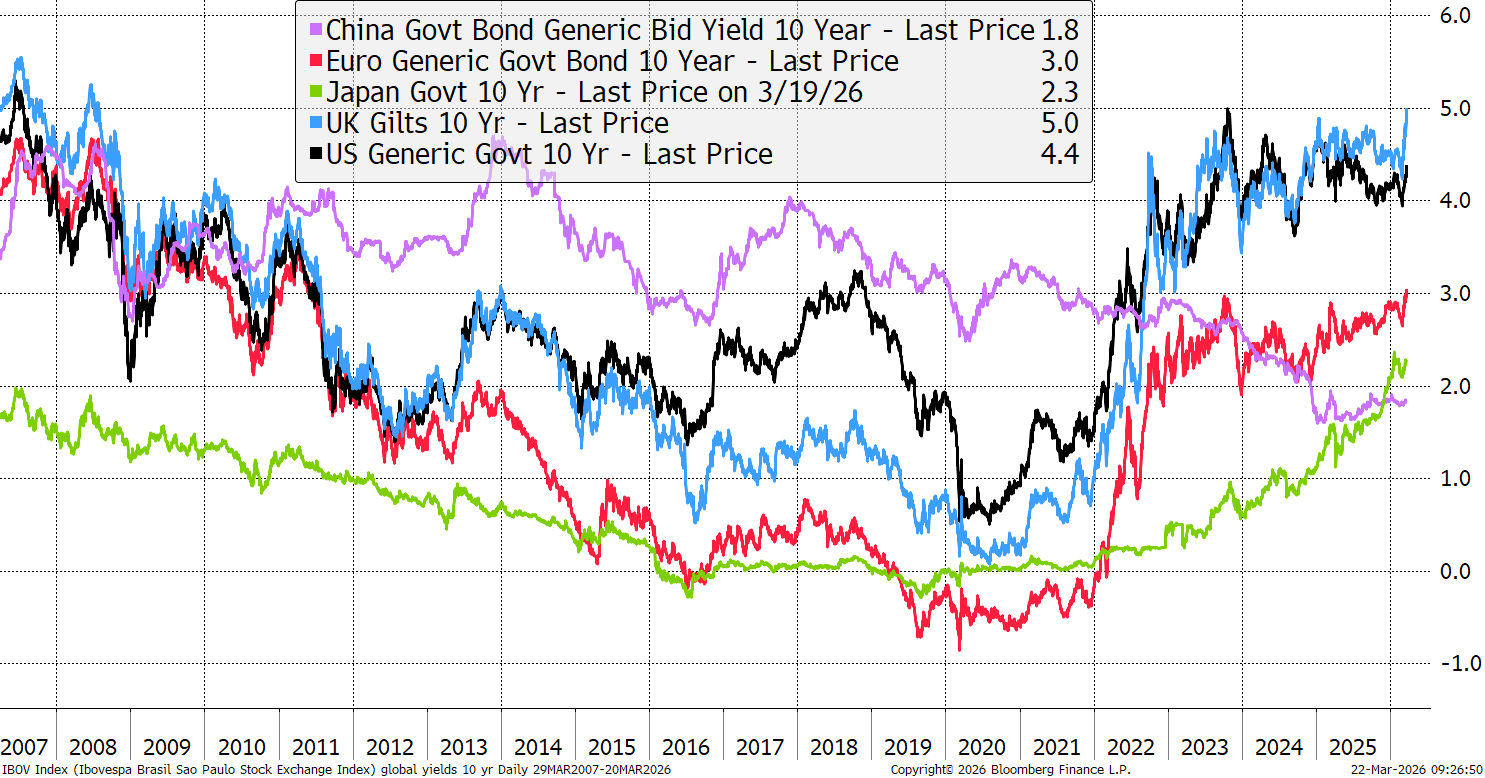
Bond Yields
The UK 10-year yield has made an 18-year high. Yields are rising quickly outside China.
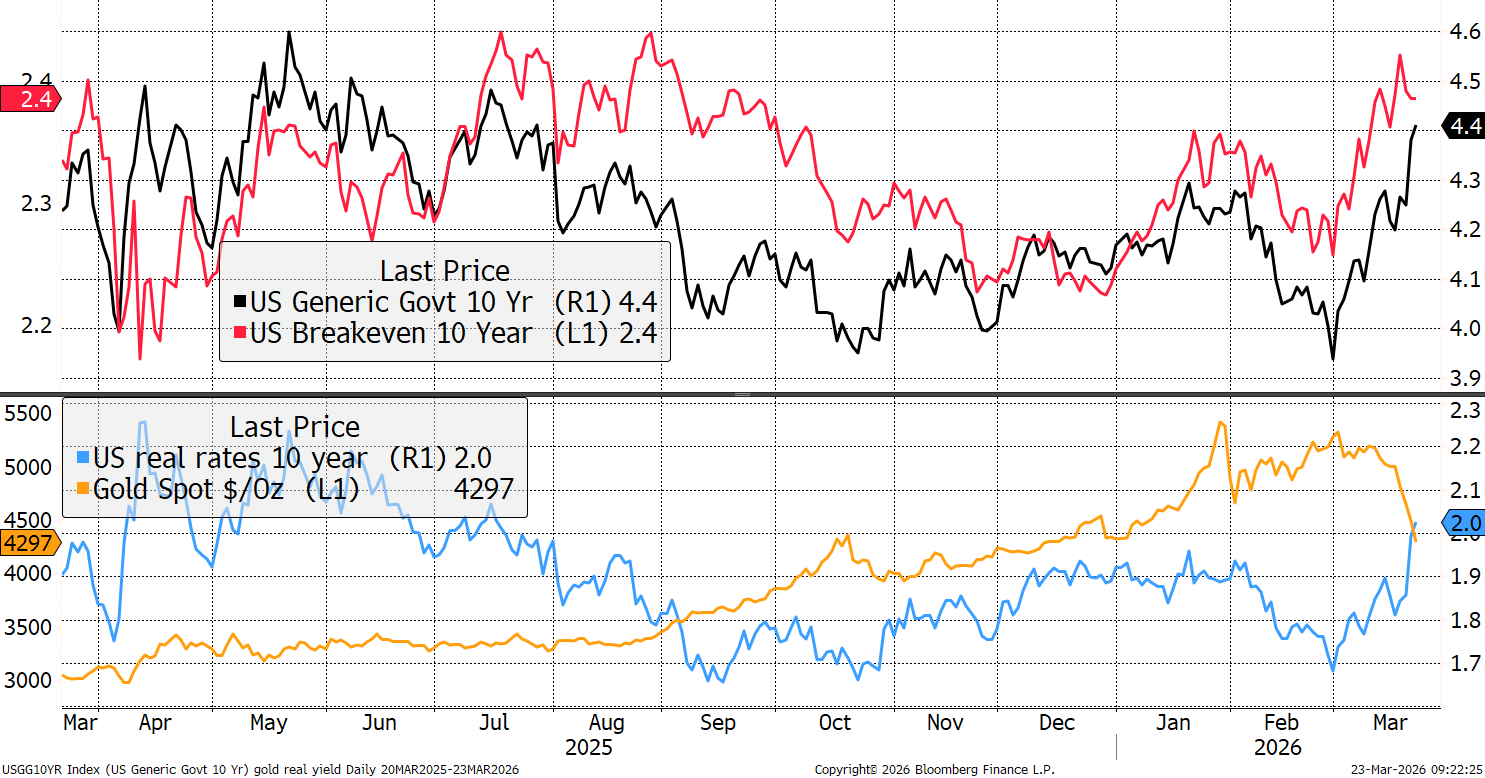
Gold
The surge in real bond yields (nominal less inflation expectations) has tightened monetary conditions. Real yields have been inversely correlated with the gold price since October. The hope is that they reverse.
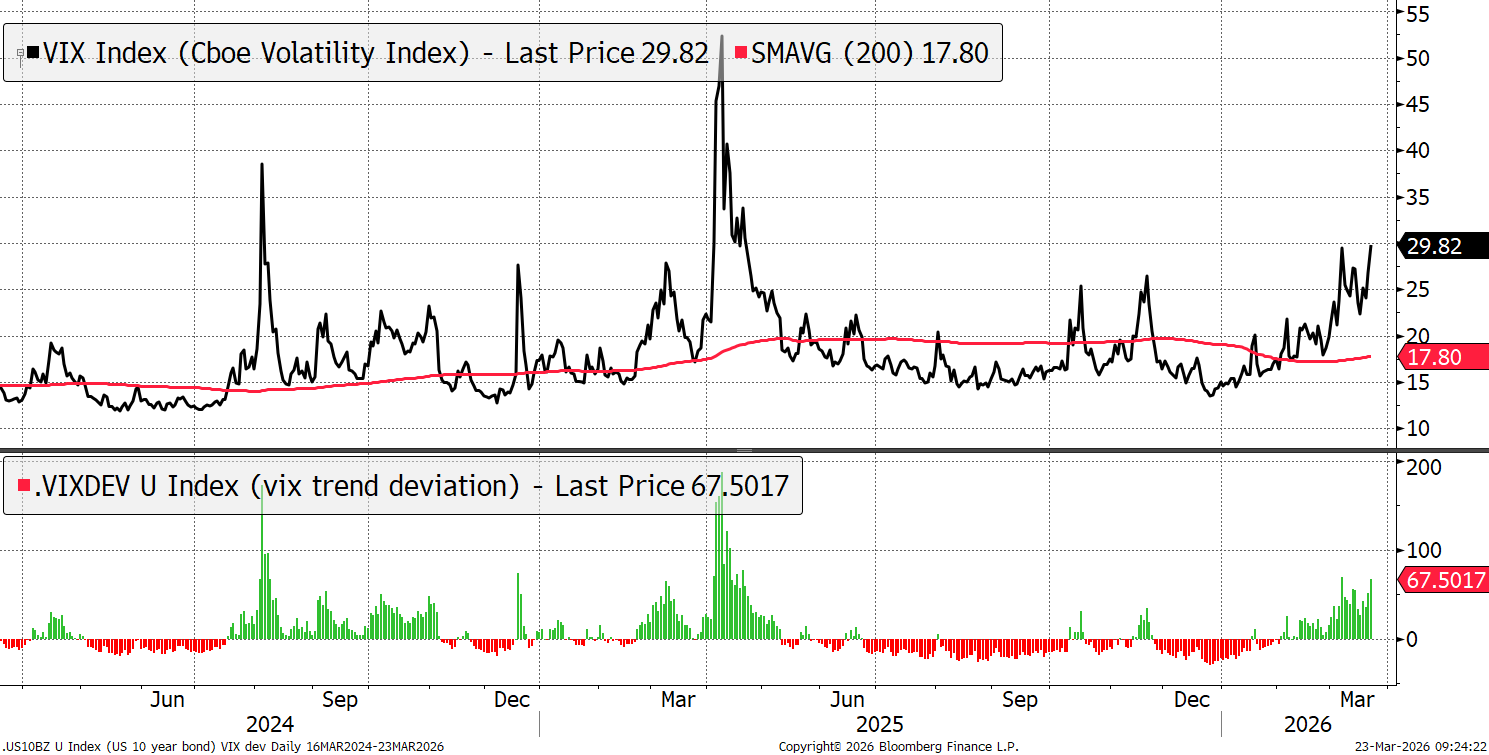
Equity Volatility
The VIX remains elevated. A V-shaped correction is unlikely until it “spikes”. 30 is not such a high number that it suggests market capitulation is upon us.
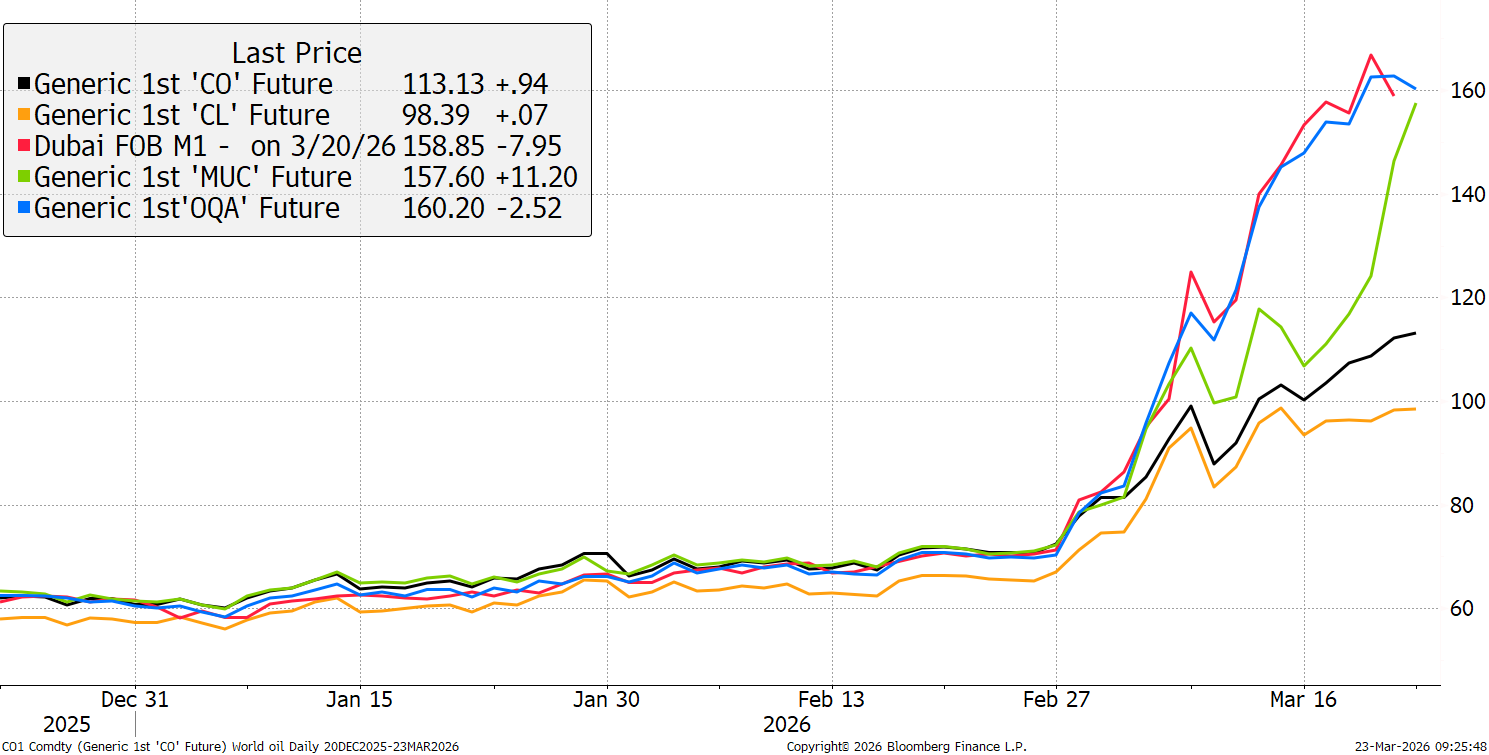
Oil Prices
There isn’t just a US and Brent oil price, but last week we learned there are many more. Delivery from Oman to Asia is already $160. US Crude remains the cheapest and still below $100.
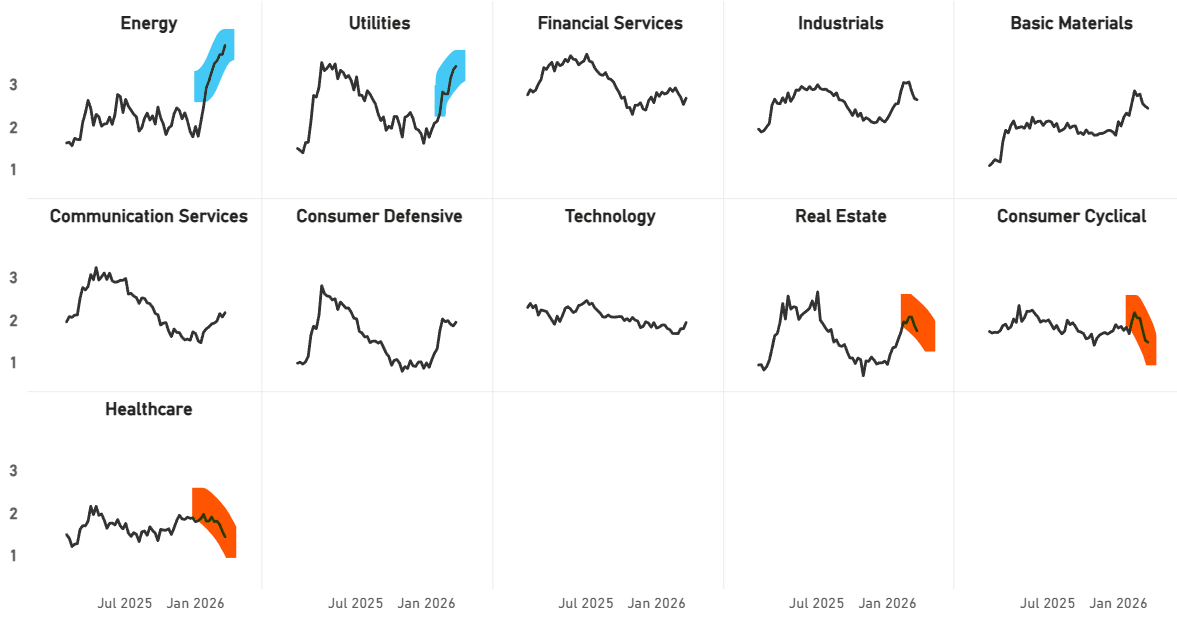
Sector Trends in CAPR
Energy surges higher alongside utilities. Rate sensitive sectors have been weak.
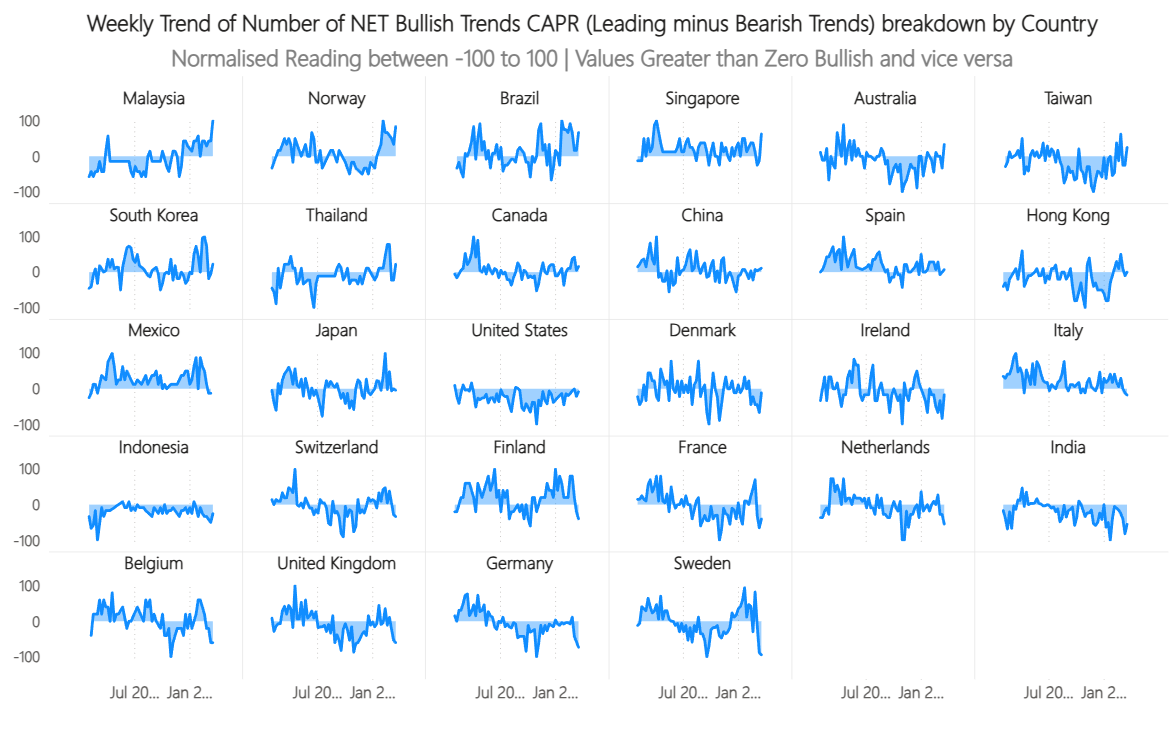
Country Classifications in CAPR
Malaysia, Norway, Brazil are energy producers. Energy deficit countries such as Sweden, Germany, and the UK, have fared worst.
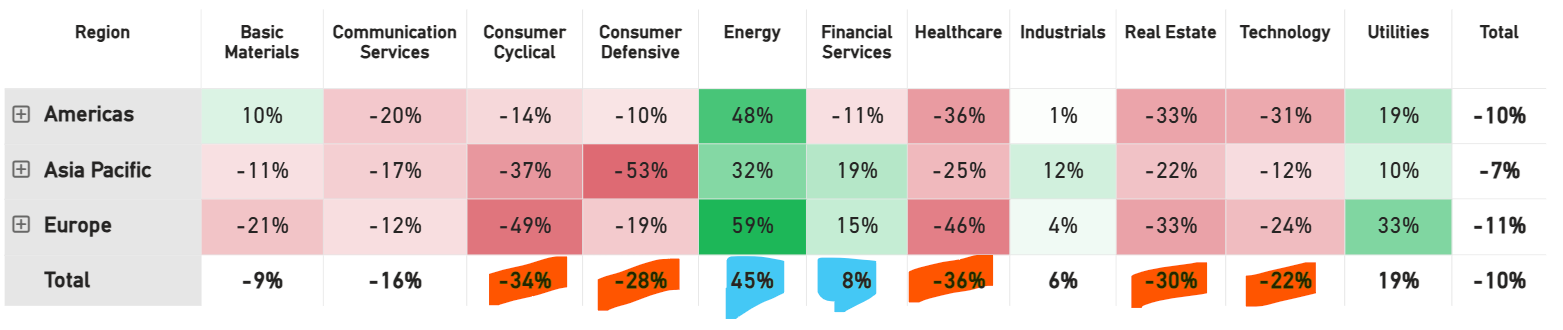
Net Winners
This is the net changes in the market leadership in CAPR terms. Energy stands out alongside utilities. Financial services are this week’s surprise. Healthcare, real estate and consumer defensives feel the pressure from rising bond yields.
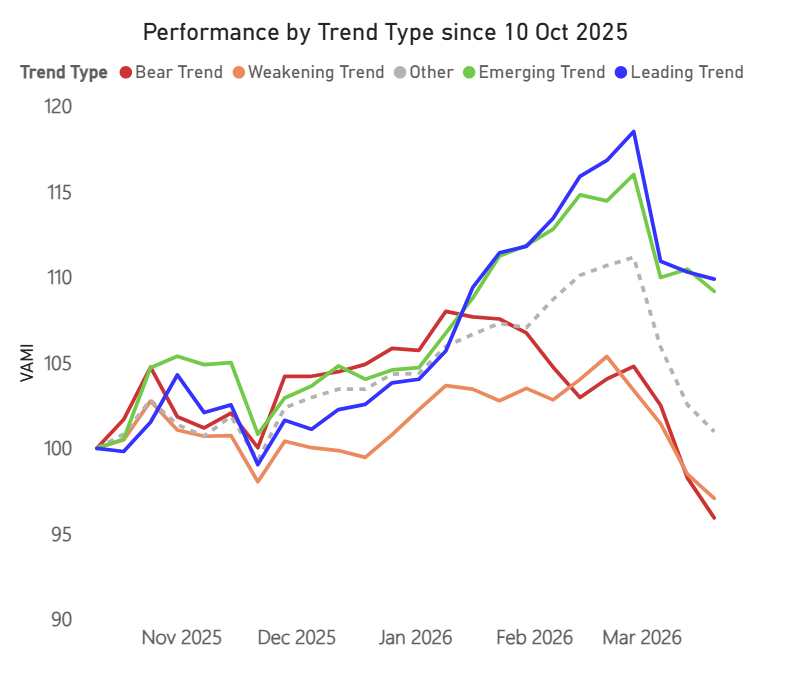
Trend Type Performance
This is still a momentum market in relative terms. The winners are falling less than the losers.
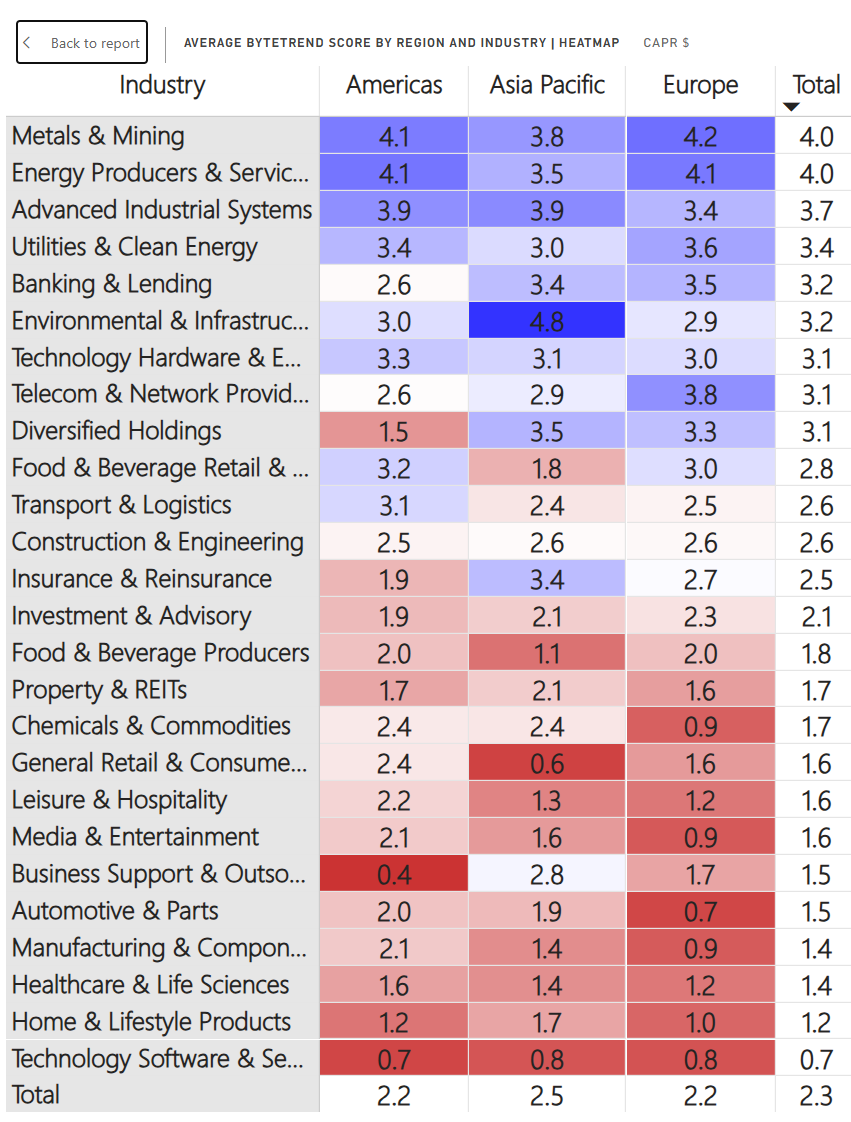
Regions and Industries Average CAPR Score
Energy Producers are the best performers by far, but Metals and Mining had held onto the top spot by Friday’s close. Telecom stocks are also doing well, especially in Europe, as are Utilities & Clean Energy, and Food and Beverage Retailers (who can pass on higher costs to customers better than the Producers). Additionally, Advanced Industrials, Insurance (notably in Asia), and Tech Hardware have stayed in line with the falling World Index.
Meanwhile, Environmental & Infrastructure stocks are reversing sharply lower. Chemicals and Commodities were also strong in Jan and Feb, but are weakening now, and Healthcare, Manufacturing, Autos (mostly in Europe), and Home & Lifestyle products are all under pressure. While Software remains bottom of the table, in relative terms, it has held up better than most in the last few weeks.
Remember to refer to our GTI: User Guide for an overview of the key concepts and terminology used in this report. These concepts may take a little bit of getting used to but are very powerful once you do.
User Guide
Refer to our GTI: User Guide for an overview of the key concepts and terminology used in this report. These concepts may take a little bit of getting used to, but they are very powerful once you do.
How to Read the Tables
The Value Composite Score (Value) is measured against the company’s own financial history and not in absolute terms. The columns are Cheap (Chp), Value (Val), Fair Value (FV), Overvalued (OV), and Expensive (Exp). The Growth Composite Score (Growth) is measured by sales, earnings, cash flow, dividends, and book value on a per share basis. The columns are High, Good, Medium (Med), Low, and Negative (Neg).
The value composite score is measured against the company’s own financial history and not in absolute terms. The columns are cheap Chp, Value Val, Fair Value FV, Overvalued OV, Expensive EXP. The growth composite score is measured by sales, earnings cashflow, dividend, and book value on a per share basis. The columns are High, Good, Med, Low, and Negative, Neg.
Leading Trends with New Highs
These stocks are trading at the 30-week CAPR highs with a ByteTrend Score of 5. All charts shown are CAPR rebased to 100.
| Name | Annual. Vol. 30w | MCap Bn. USD | Value | Growth |
| Exxon Mobil Corporation | 18 | 666 | OV | Neg |
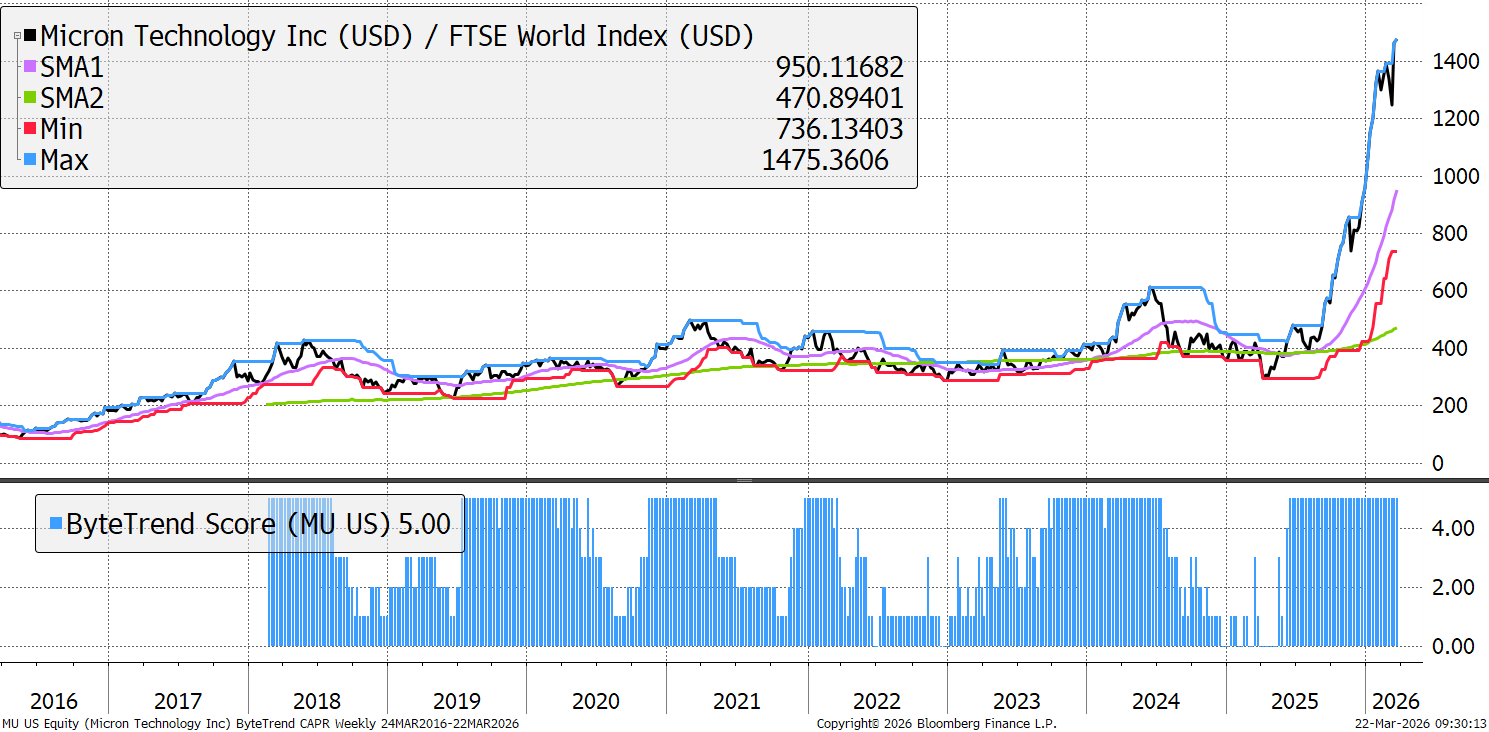
| Micron Technology, Inc. | 58 | 477 | Exp | Low |
| PetroChina Company Limited | 28 | 342 | OV | Good |
| Lam Research Corporation | 50 | 285 | Exp | Good |
| Applied Materials, Inc. | 40 | 283 | Exp | Med |
| Shell plc | 20 | 258 | OV | Neg |
| GE Vernova Inc. | 36 | 231 | OV | Med |
| Commonwealth Bank of Australia | 26 | 206 | OV | Good |
| KLA Corporation | 42 | 197 | Exp | Good |
| TotalEnergies SE | 21 | 190 | OV | Neg |
| The TJX Companies, Inc. | 14 | 172 | OV | Good |
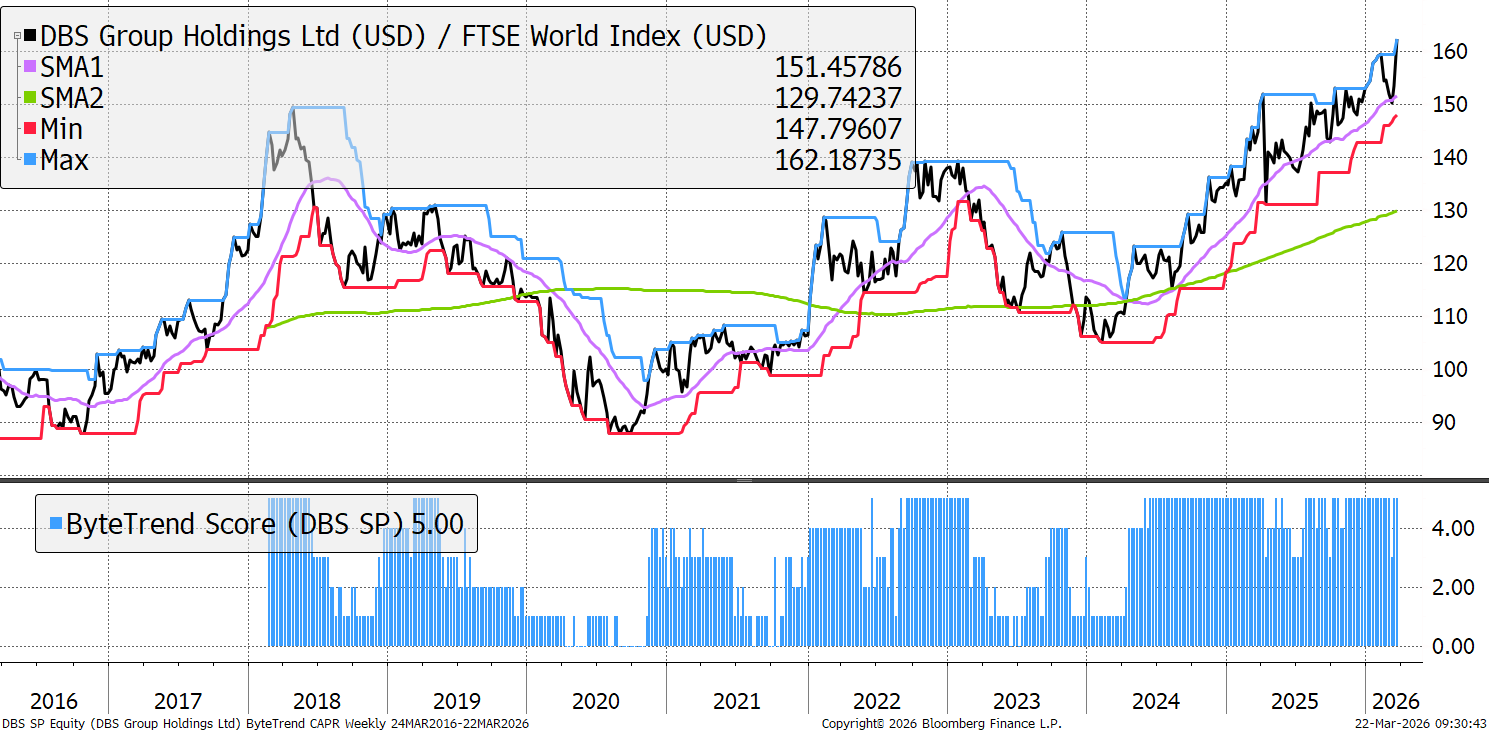
| DBS Group Holdings Ltd | 15 | 127 | OV | High |
| Chubb Limited | 19 | 126 | FV | Good |
| Mitsubishi Corporation | 28 | 126 | Exp | Good |
| China Shenhua Energy Company | 22 | 124 | Exp | Med |
| Petróleo Brasileiro S.A. - Petrobras | 29 | 122 | OV | Neg |
| Delta Electronics, Inc. | 44 | 120 | Exp | Good |
| BP p.l.c. | 23 | 115 | OV | Neg |
| Mitsui & Co., Ltd. | 27 | 112 | Exp | Med |
| CME Group Inc. | 19 | 110 | OV | Good |
| Canadian Natural Resources | 25 | 103 | OV | Low |
| Western Digital Corporation | 59 | 99 | Exp | Good |
| Vertiv Holdings Co | 52 | 98 | Exp | High |
| Westpac Banking Corporation | 14 | 98 | OV | Good |
| Seagate Technology Holdings plc | 59 | 90 | Exp | Neg |
| The Williams Companies, Inc. | 23 | 88 | Exp | Neg |
| BAE Systems plc | 37 | 87 | Exp | Med |
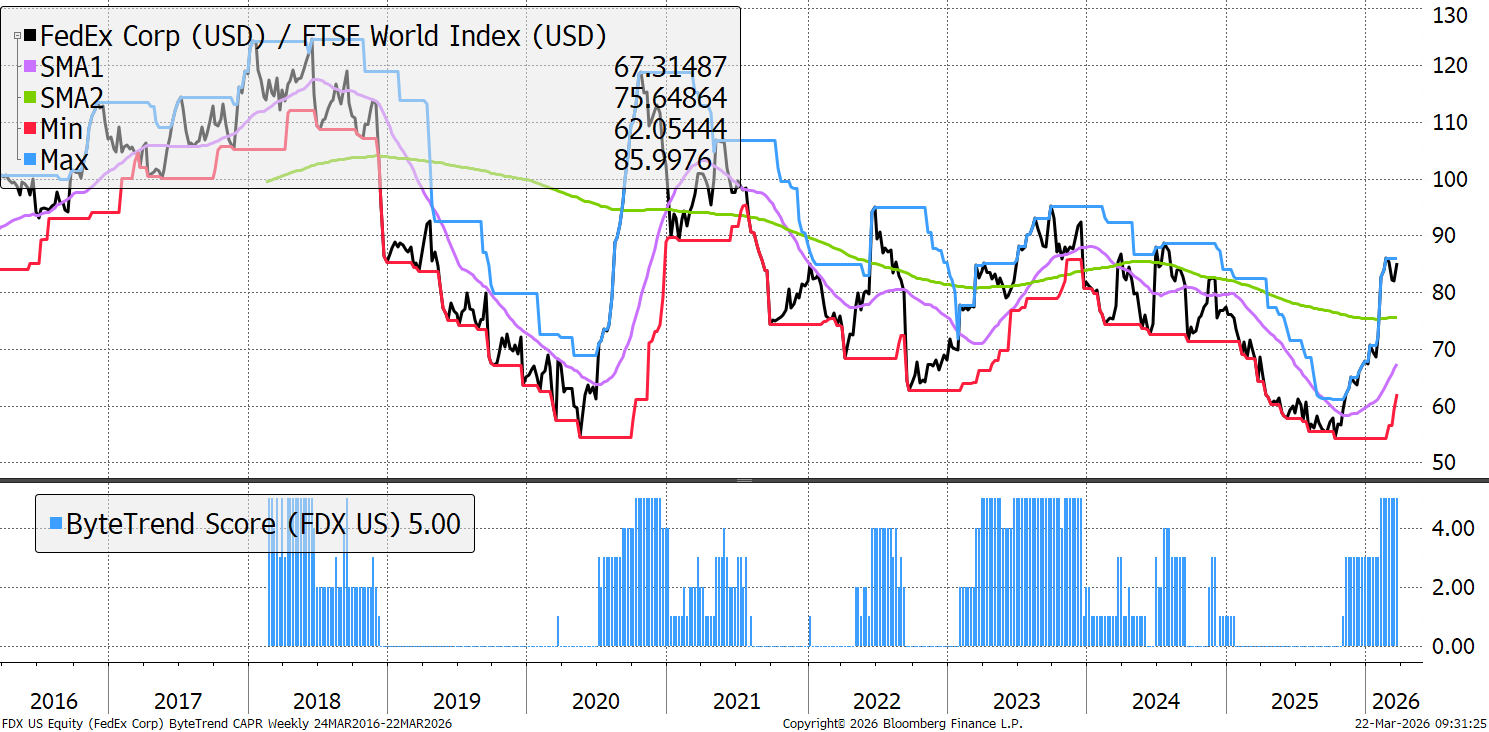
| FedEx Corporation | 30 | 85 | FV | Med |
| Quanta Services, Inc. | 26 | 83 | Exp | High |
| Eni S.p.A. | 22 | 81 | OV | Neg |
| Suncor Energy Inc. | 23 | 76 | OV | Neg |
| Shin-Etsu Chemical Co., Ltd. | 30 | 75 | OV | Med |
| Oversea-Chinese Banking | 15 | 75 | OV | Good |
| Valero Energy Corporation | 35 | 73 | OV | Neg |
| Kinder Morgan, Inc. | 20 | 73 | OV | Low |
| Phillips 66 | 30 | 70 | OV | Neg |
| Ross Stores, Inc. | 18 | 69 | OV | Good |
| Marathon Petroleum Corporation | 36 | 69 | OV | Neg |
| Singapore Telecommunications | 20 | 67 | OV | High |
| The Travelers Companies, Inc. | 20 | 66 | FV | Good |
| L3Harris Technologies, Inc. | 20 | 66 | OV | Med |
| Imperial Oil Limited | 33 | 63 | Exp | Neg |
| Cheniere Energy, Inc. | 28 | 60 | OV | High |
| HOYA Corporation | 23 | 59 | OV | Good |
| Ciena Corporation | 57 | 54 | Exp | Good |
| Targa Resources Corp. | 28 | 51 | Exp | Good |
Micron
Shortages aren’t just for commodities, and the incredible demand for memory chips for AI has led prices to surge and the producers, like Korean Micron, to see the magic combo of surging volumes on rising prices. The Hormuz closure makes this shortage worse, and the world can’t live without semiconductors.
DBS
DBS Group is a leading Singapore bank with retail, SME and institutional focus across Asia. It reported record profits in 2025, driven by solid net interest margins, but is still managing prior‑year tech outages/regulatory scrutiny. It is leaning into the AI theme by automating and cutting thousands of jobs.
FedEx
FedEx will suffer from higher oil prices, but less than before, as its fleet of delivery vehicles moves over to electric and autonomous vehicles. AI is also enabling increasing automation of a labour-intensive business – from drivers to warehouse management. The market has focused on the builders of AI, but FedEx is a potential AI beneficiary.
New Leading Trends
These stocks are trading at the 30-week CAPR highs with a ByteTrend Score of 5, except they are new trends this week, having previously has a score below 5. All charts shown are CAPR rebased to 100.
| Name | Annual. Vol. 30w | MCap Bn. USD | Value | Growth |
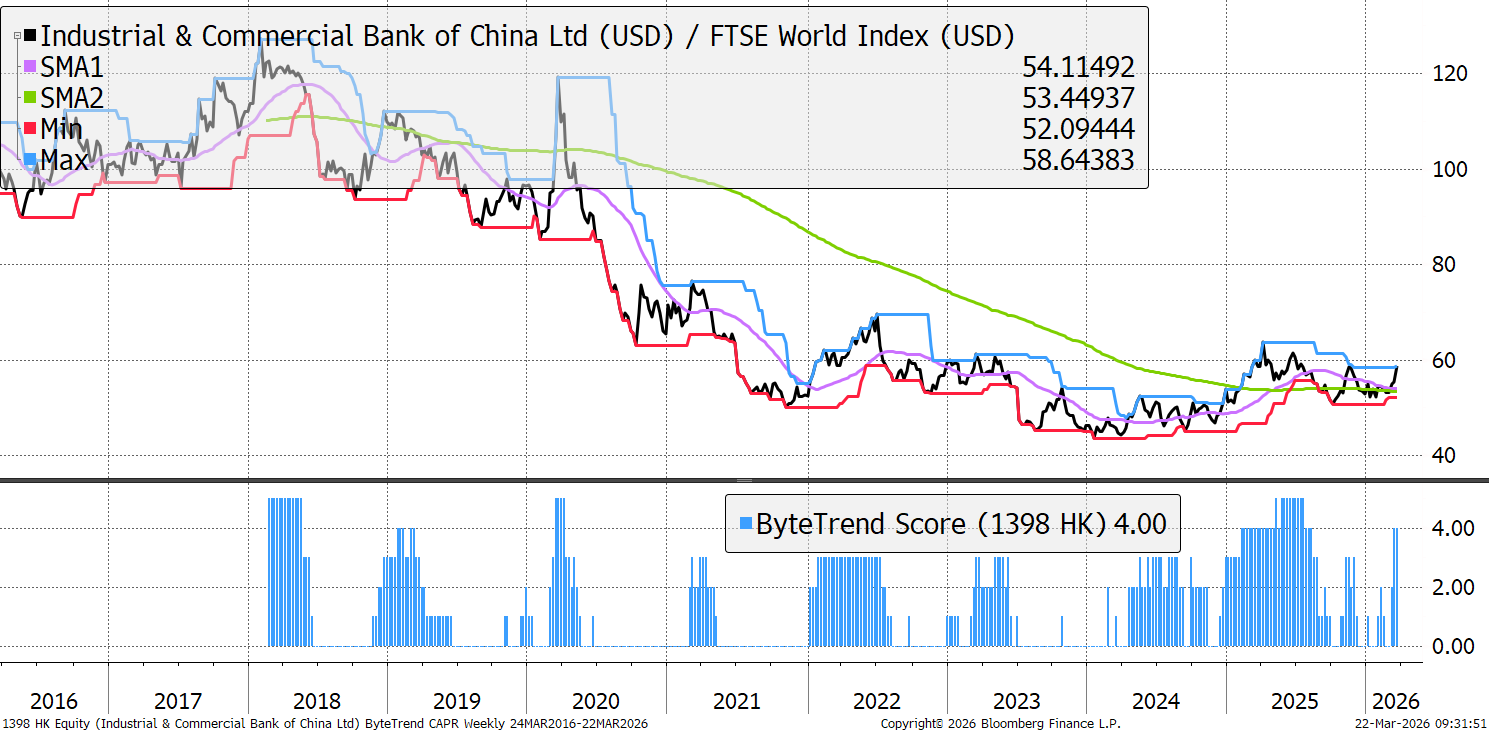
| Industrial and Commercial Bank of China | 20 | 376 | FV | Low |
| China Construction Bank Corporation | 19 | 248 | FV | Med |
| Bank of China Limited | 17 | 243 | FV | Med |
| Dell Technologies Inc. | 46 | 106 | OV | High |
| Equinor ASA | 34 | 103 | OV | Neg |
| ONEOK, Inc. | 24 | 56 | FV | Med |
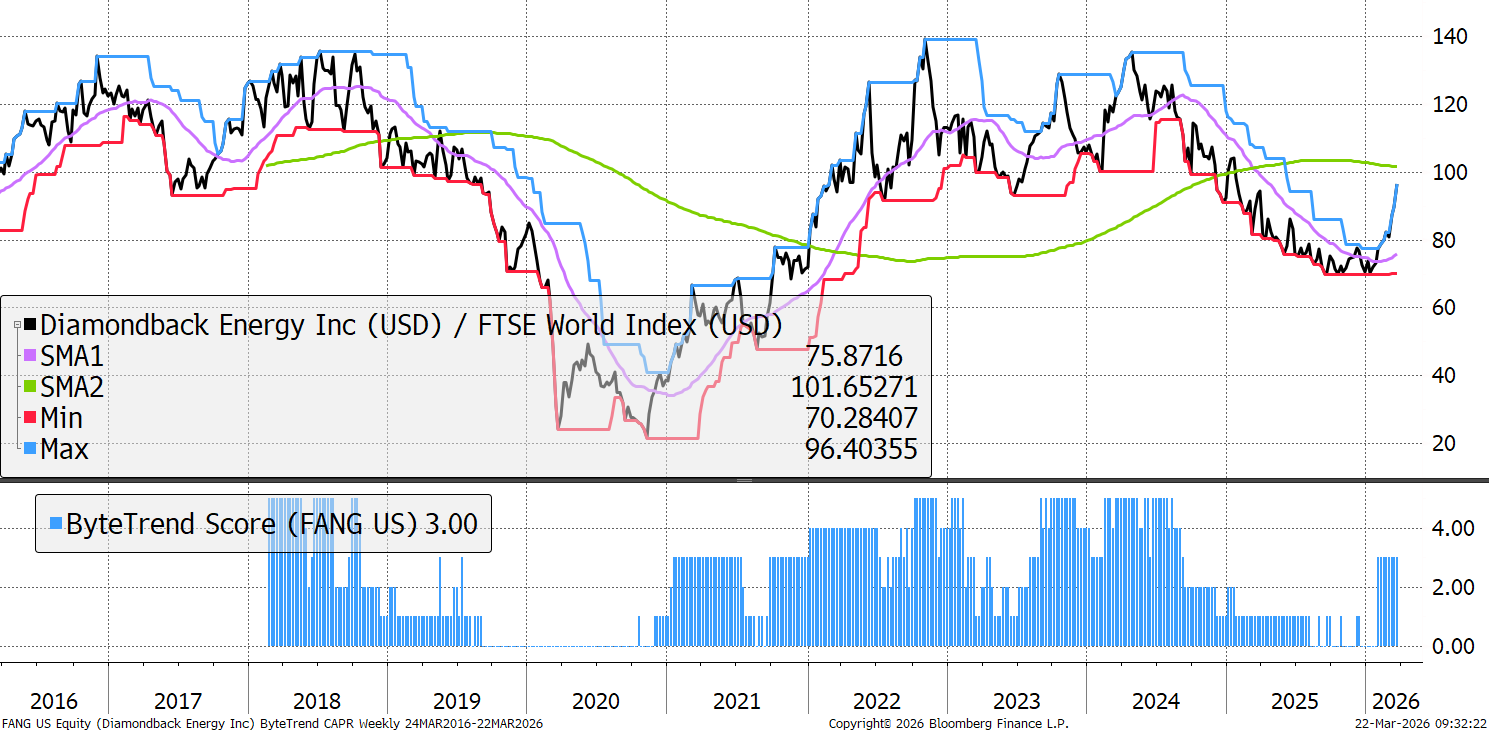
| Diamondback Energy, Inc. | 26 | 54 | FV | Neg |
ICBC
ICBC is the world’s largest bank by assets, with a dominant corporate and retail franchise in China, and a growing international presence too. It is closely tied to China’s economy, hence the persistent weakness from 2020-2024. China’s stimulus and signs of recovery are driving ICBC’s outperformance since early 2025.
Diamondback Energy
Diamondback is an oil and gas Exploration & Production company, with a total focus on the Permian Basin - America's largest shale patch. It is now a major player after acquiring both Endeavor ($26bn) and Double Eagle ($4bn), as part of a wider consolidation within the US shale sector. It has been revising production guidance steadily higher, just in time for the oil price spike.
Emerging Trends
These stocks are trading at the 30-week CAPR highs with a ByteTrend Score of less than 5. They don’t have to be in an uptrend, just emerging. All charts shown are CAPR rebased to 100.
| Name | Annual. Vol. 30w | MCap Bn. USD | Value | Growth |
| Saudi Arabian Oil Company | 16 | 1746 | FV | Neg |
| Chevron Corporation | 18 | 403 | OV | Neg |
| Merck & Co., Inc. | 32 | 282 | FV | High |
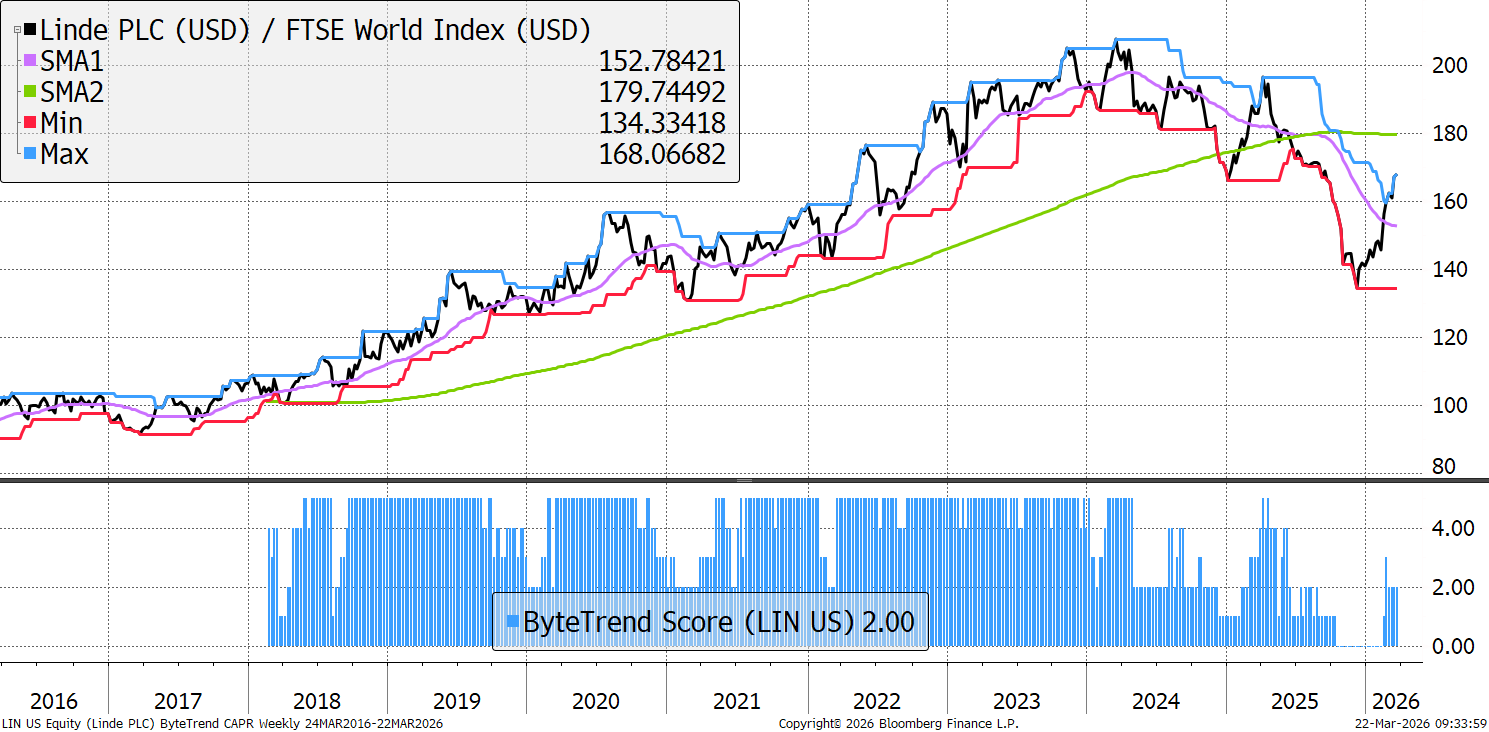
| Linde plc | 20 | 226 | OV | Med |
| ConocoPhillips | 26 | 155 | OV | Neg |
| The Toronto-Dominion Bank | 13 | 154 | FV | High |
| Pfizer Inc. | 28 | 153 | Val | Med |
| Enbridge Inc. | 16 | 117 | OV | Good |
| AIA Group Limited | 32 | 115 | FV | Good |
| Equinix, Inc. | 25 | 94 | FV | Good |
| Glencore plc | 30 | 81 | Exp | Neg |
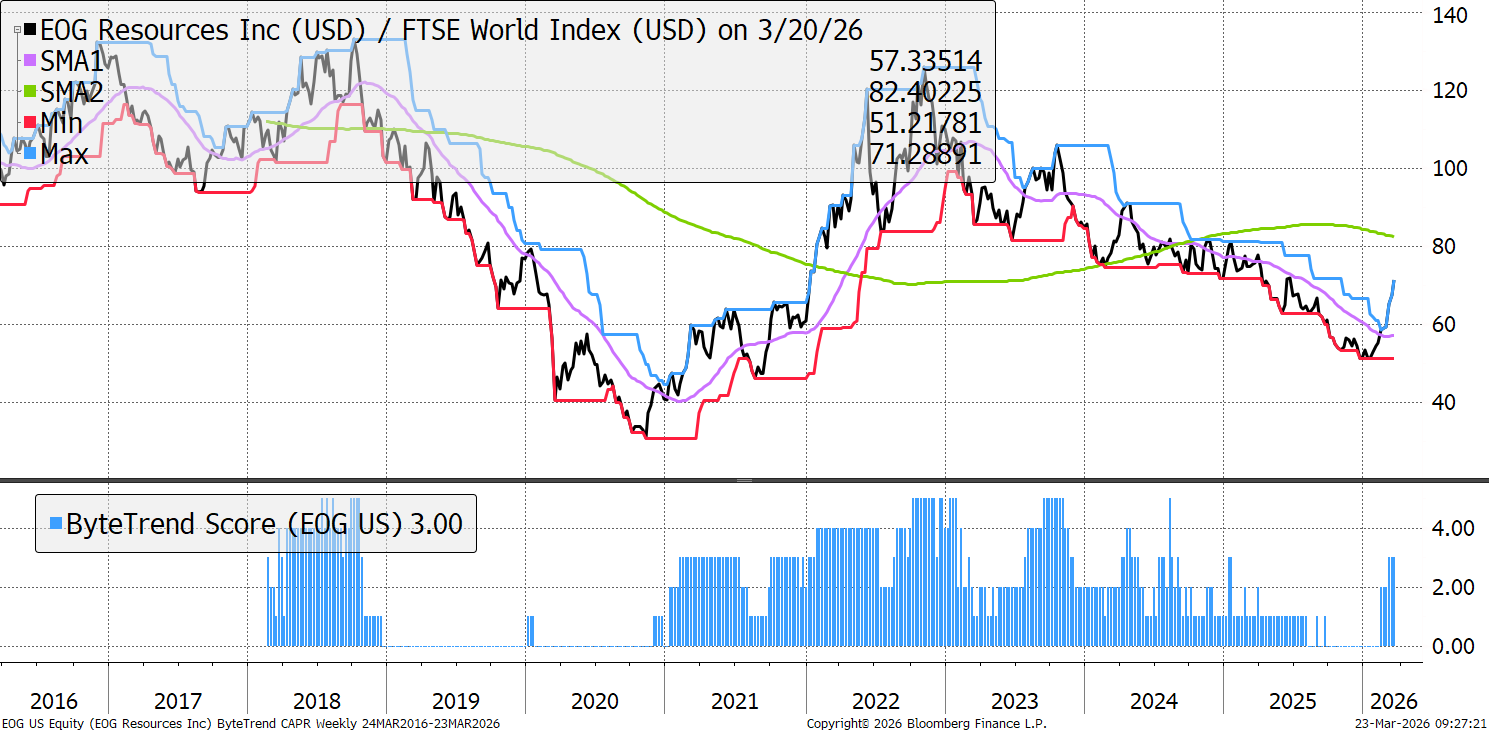
| EOG Resources, Inc. | 23 | 75 | FV | Neg |
| TC Energy Corporation | 18 | 66 | OV | High |
| Occidental Petroleum Corporation | 29 | 60 | OV | Neg |
| Takeda Pharmaceutical Company | 19 | 57 | OV | Neg |
| Corteva, Inc. | 21 | 52 | OV | High |
| Electronic Arts Inc. | 17 | 50 | OV | Med |
Linde
Linde, the global industrial gases leader, had a terrible two years in 2023 and 2024 as high valuations met slowing growth, but late last year it returned to growth and reported record free cash flow, backed by signs of a turnaround in China. The Hormuz crisis affects non-energy commodities too, notably helium, but other gases (e.g. hydrogen) are seeing rising prices amid shortage fears, as many are refined from natural gas. This adds to Linde’s rally, taking it back to record valuations once again.
EOG Resources
EOG is another large US shale E&P company. It has a multi‑basin portfolio (Permian, Eagle Ford, and others) and a strong balance sheet. It is known for its low‑cost inventory, and it too completed a large merger, with Encino ($5.6bn). This added 675,000 net acres in the Utica basin and 275,000 barrels of oil equivalent per day (boepd) to EOG.
Weakening
These stocks are trading at the 30-week CAPR lows with a ByteTrend Score above 0. They are weakening trends but not yet downtrends. All charts shown are CAPR rebased to 100.
| Name | Annual. Vol. 30w | MCap Bn. USD | Value | Growth |
| SAP SE | 25 | 208 | FV | High |
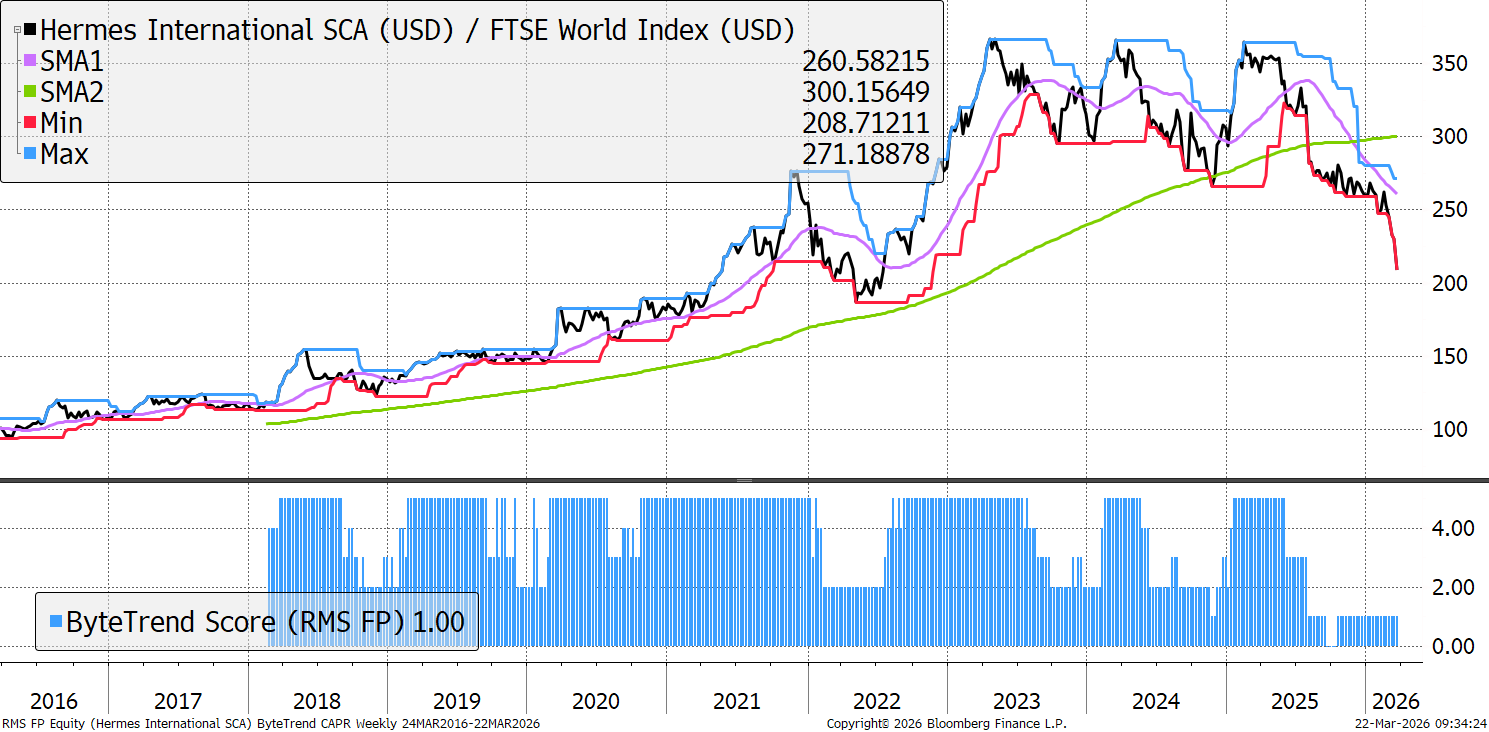
| Hermès International | 29 | 201 | FV | Good |
| Siemens AG | 24 | 185 | OV | Good |
| Airbus SE | 23 | 147 | FV | Good |
| Safran S.A. | 25 | 136 | OV | High |
| Prosus N.V. | 35 | 101 | Val | High |
| Intesa Sanpaolo S.p.A. | 23 | 100 | OV | High |
| Compagnie Financière Richemont S.A. | 31 | 97 | FV | High |
| Hon Hai Precision Industry Co., Ltd. | 30 | 88 | Exp | Good |
| MercadoLibre, Inc. | 39 | 83 | Chp | High |
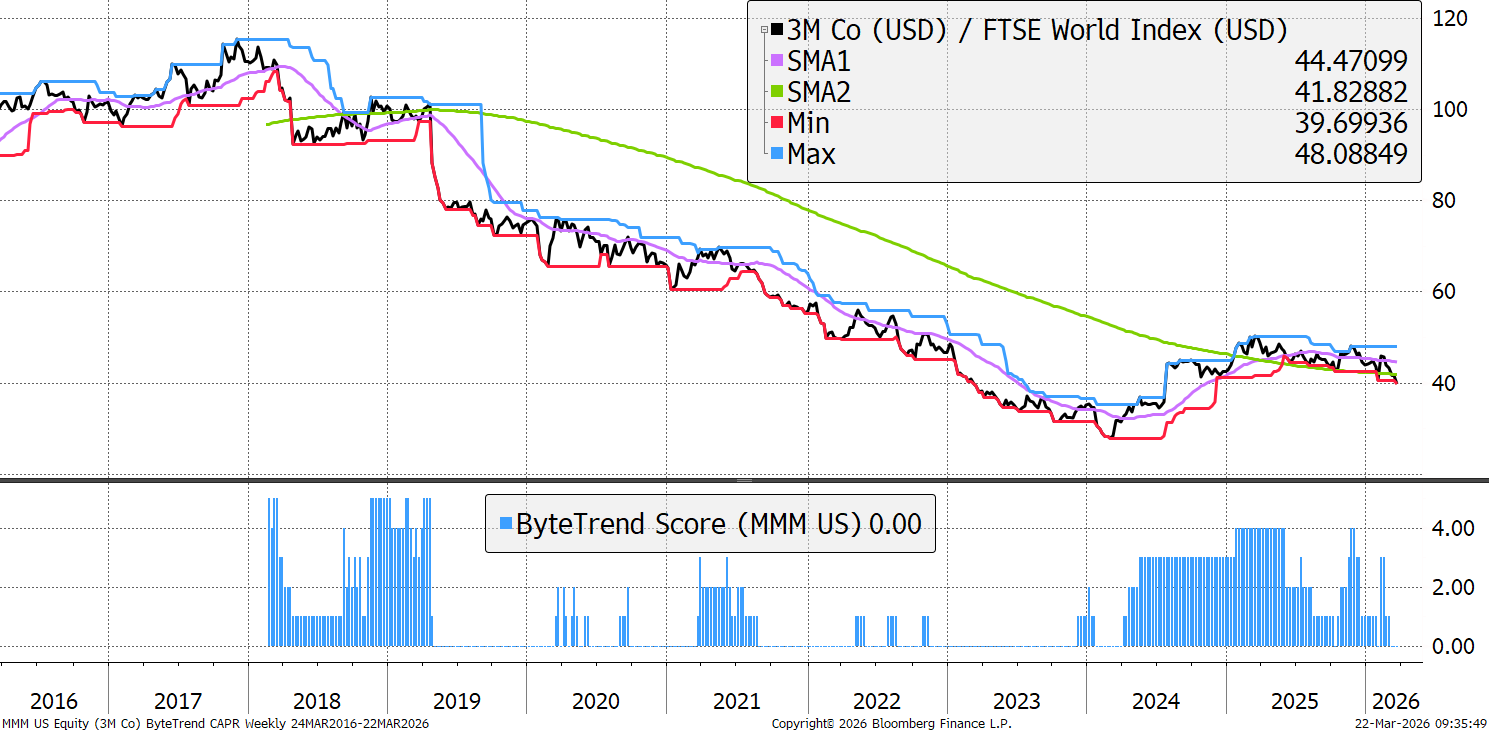
| 3M Company | 31 | 74 | OV | Neg |
| TransDigm Group Incorporated | 25 | 66 | FV | High |
| Robinhood Markets, Inc. | 63 | 64 | Exp | High |
| Carvana Co. | 62 | 61 | FV | Good |
| TE Connectivity Ltd. | 29 | 57 | OV | Good |
| Deutsche Bank AG | 30 | 55 | OV | High |
Hermes
Hermes is one of the world’s most historic and powerful luxury brands. Its dedication to quality craftsmanship and enduring style has seen it thrive for centuries. Its high margins and growth attracted many investors, and it reached excessively optimistic valuations, the fruits of which are now being seen. There is, in fact, a price too high, even for the most brilliant businesses, and despite its price multiple being down half from its peak, it is still at 10x sales. It warns of a downturn in consumer spending even at the high end.
3M
3M is a diversified industrial and consumer technology company. In April 2024, it completed its Solventum spinoff to remove its healthcare exposure and sharpen focus on its core industrial/advanced materials portfolio. Since then, it has been driving restructuring and operational efficiency, and the initial burst of optimism at the move has faded, as the reality of complex post-merger improvements has set in.
Bear Trends
These stocks are trading at the 30-week CAPR lows with a ByteTrend Score of 0. They are in a downtrend. All charts shown are CAPR rebased to 100.
| Name | Annual. Vol. 30w | MCap Bn. USD | Value | Growth |
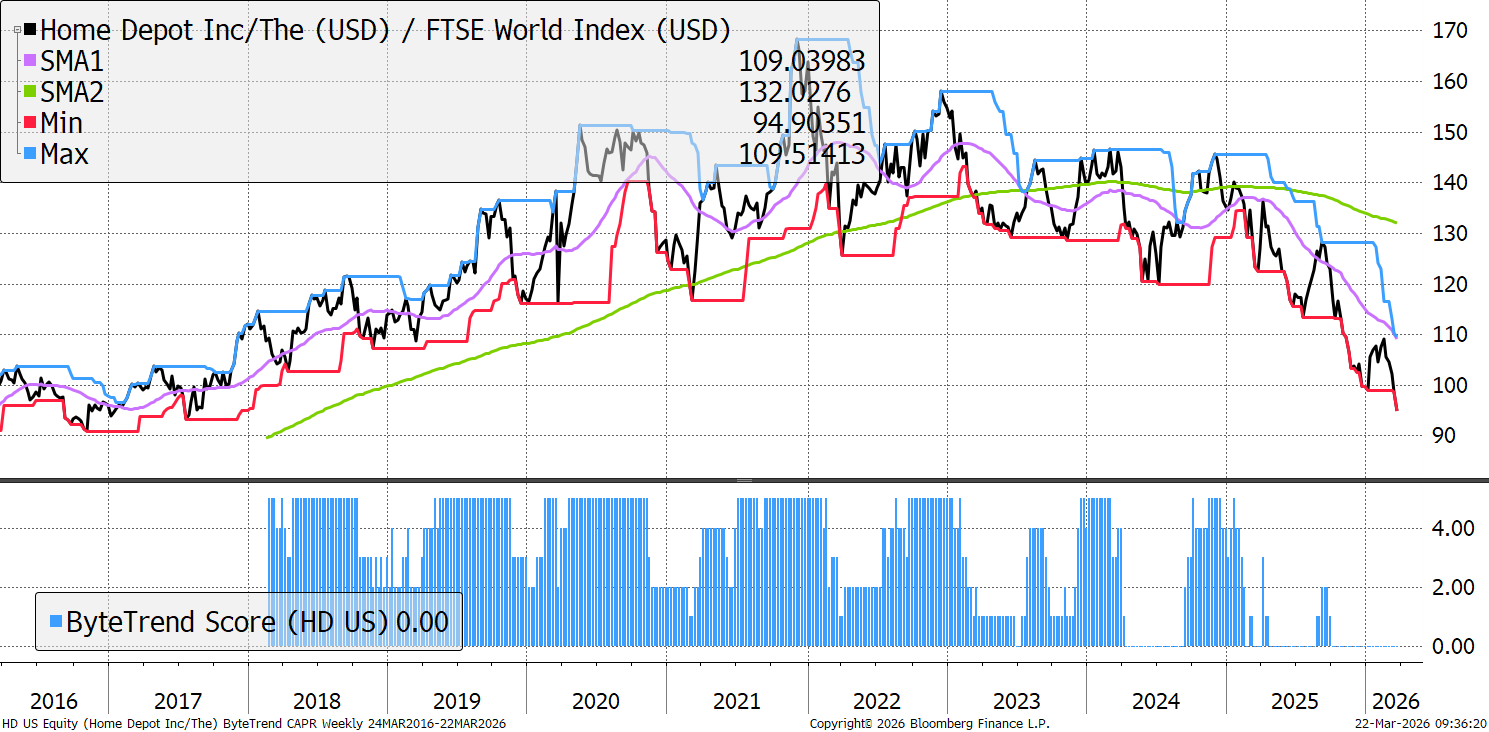
| The Home Depot, Inc. | 24 | 319 | FV | Low |
| LVMH Moët Hennessy | 31 | 264 | Val | Low |
| HDFC Bank Limited | 15 | 128 | Val | High |
| EssilorLuxottica S.A. | 31 | 105 | FV | Med |
| ICICI Bank Limited | 17 | 95 | FV | High |
| Tata Consultancy Services Limited | 23 | 92 | Val | Med |
| Christian Dior SE | 30 | 90 | Val | Neg |
| NIKE, Inc. | 34 | 77 | Val | Neg |
| The Sherwin-Williams Company | 22 | 75 | FV | Good |
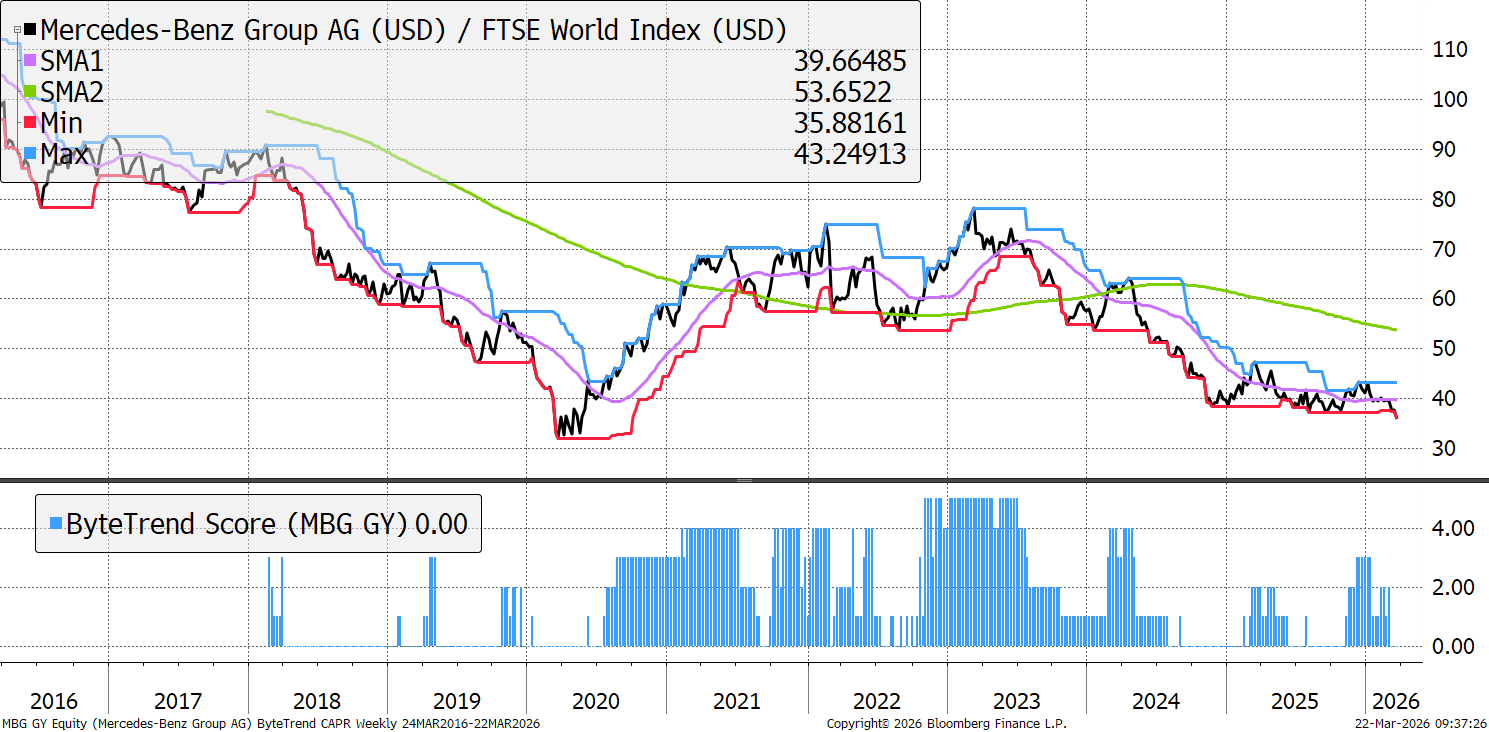
| Mercedes-Benz Group AG | 24 | 56 | FV | Neg |
| Bajaj Finance Limited | 27 | 55 | #DIV/0! | #N/A |
| Infosys Limited | 27 | 54 | FV | Good |
| Bayerische Motoren Werke AG | 30 | 53 | Val | Neg |
| Merck KGaA | 34 | 52 | Val | Neg |
| Hindustan Unilever Limited | 16 | 52 | FV | Med |
| Volkswagen AG | 27 | 51 | Val | Neg |
Home Depot
Home Depot is the largest US home‑improvement retailer, serving DIY and increasingly professional customers. It has been suffering from two things. Firstly, everyone jumped to improve their homes in 2020, pulling demand forward. Secondly, high house prices and rising rates have hurt them, as expensive mortgages slow the housing market, and the less people move, the less they need Home Depot to set up their new place.
Mercedes-Benz
European automakers are in a strategic dilemma. Petrol vehicle sales have been losing share to electric for a decade, but the Chinese have raced to a huge lead on battery technology, and low-cost manufacturing of EVs. Mercedes, like many EU peers, are caught between sticking to a fading legacy product or fighting to compete from a position of extreme weakness in the new one. The Mercedes brand still has great value, but the strategy and execution have been poor.
GTI 200 Spreadsheet
We are pleased to share the GTI 200 spreadsheet. Download the spreadsheet below to view the CAPR and local currency scores, and more, for the world’s largest 200 stocks. Have a look at the different groups and the main list “All stocks”. The Insights tab is interesting, and don’t forget to expand the columns by clicking on the “+” at the top of the page if you want to see more trend data.
Outlook
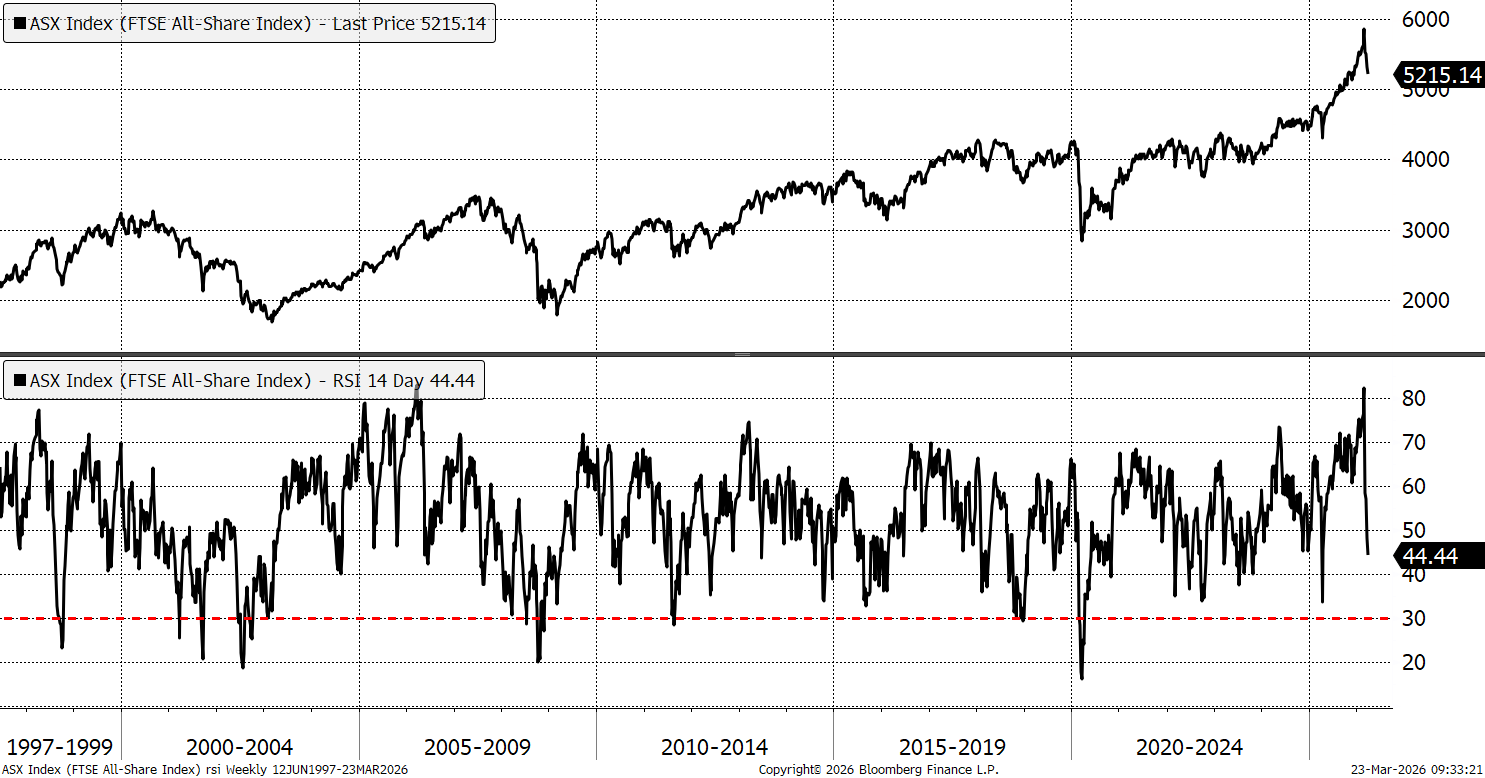
The world index is falling quickly, and outside of energy there are no safe havens, with even the bond market under pressure. Safety first is the message and not a good time for heroic trades. That will come when the market is heavily oversold. Weekly RSI is 44 for the FTSE All Share, which doesn’t seem to be low enough.
FTSE ALL Share RSI - weekly
Thanks for reading GTI.


