
NVIDIA Weakens


Issue 55;
- Breadth remains super strong, but volatility is rising.
- NVIDIA, the last holdout, cracks with no CAPR gains for 18 months.
- Strength in energy and materials was right, ahead of events in the Middle East.
Global Trends is a deep dive into global equities. The aim of this analysis is to better understand which countries, sectors, industries, and stocks are driving market returns. Not only does it help investors identify opportunities, but it also highlights the risks. We try to condense as much important information as possible, focusing on what really matters each week. Embrace this as a weekly discipline, and you’ll soon have a much better understanding of global financial markets.
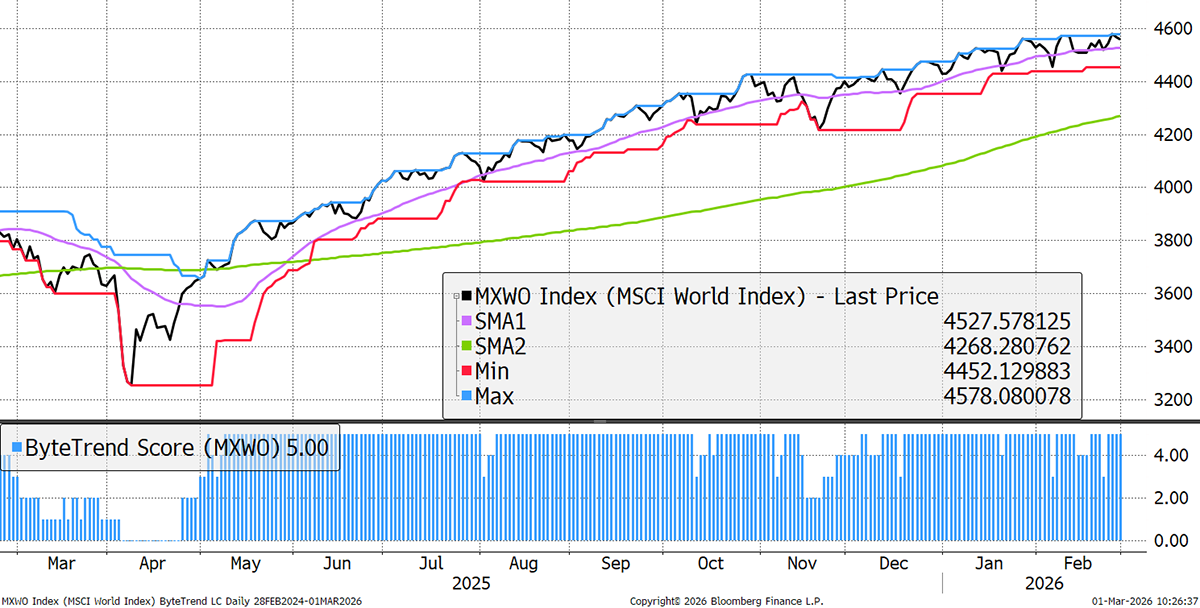
The World Index retains a ByteTrend Score of 5 in USD, but still, no new high for three weeks.
World Index – Developed Markets – Daily
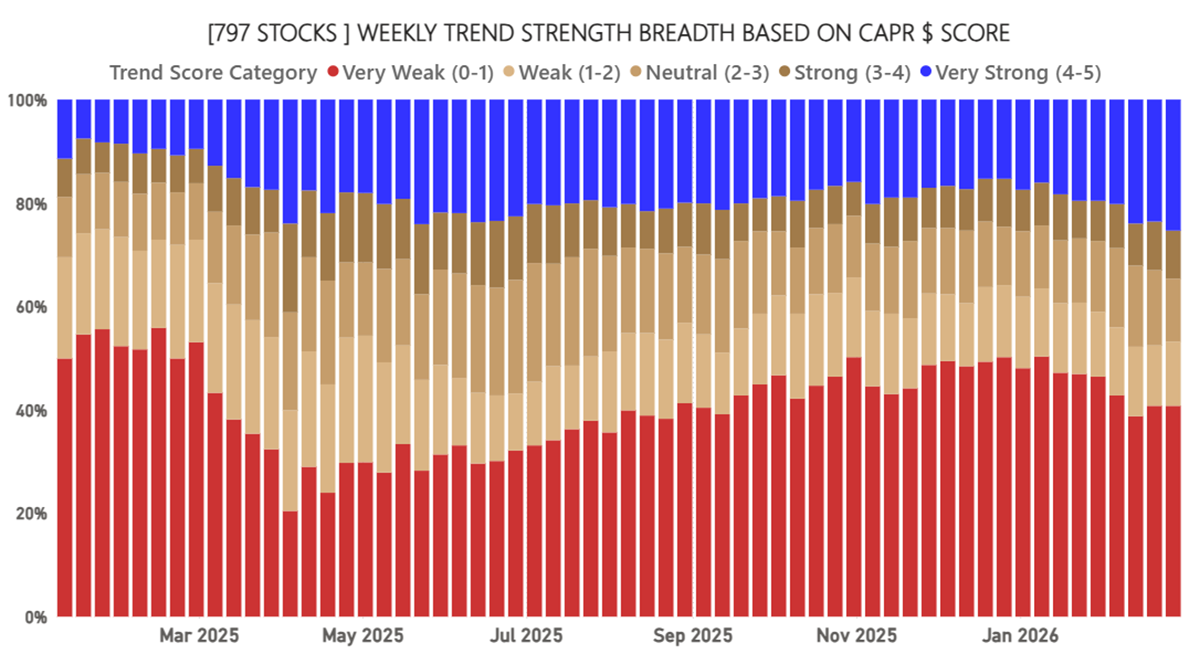
Global Equity Breadth
Breadth remains strong, with an increasing number of bullish trends. The bears have also increased slightly, marginalising neutral stocks. The picture remains bullish for market technicals.
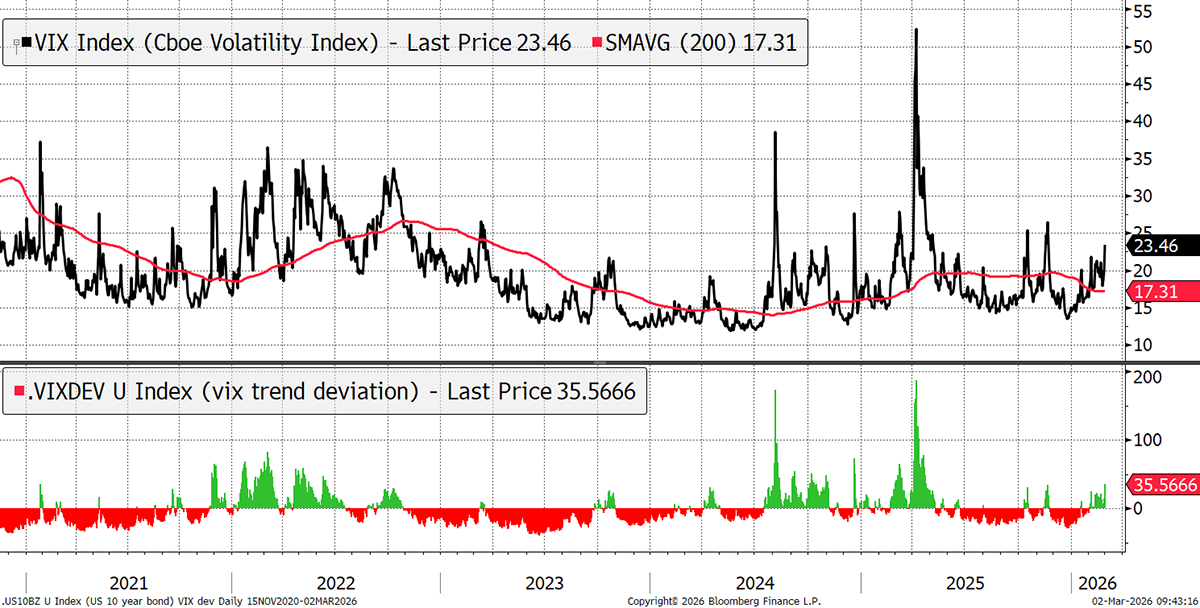
Volatility Jumps
The VIX jumped over the weekend but has been rising for several weeks. No doubt this will rise further today; the question is how long it will remain elevated.
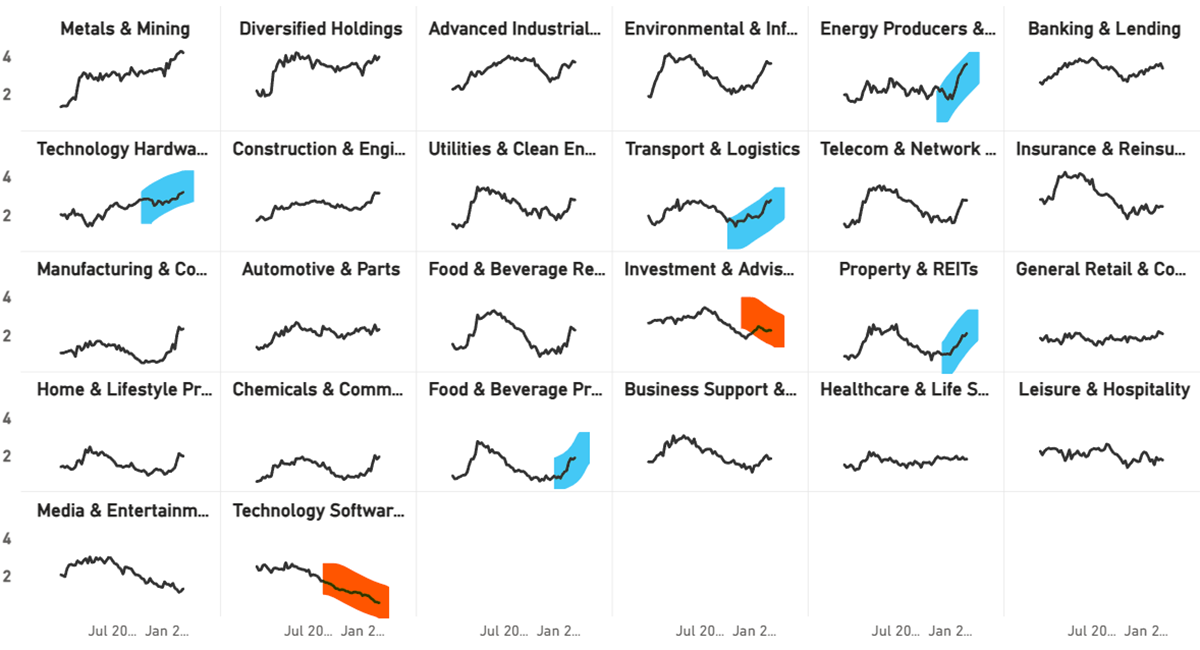
Sector Trends in CAPR
Energy, a hearty real asset, has flown. Most sectors have also done well but have cooled over the past week. Technology remains under pressure in CAPR terms.
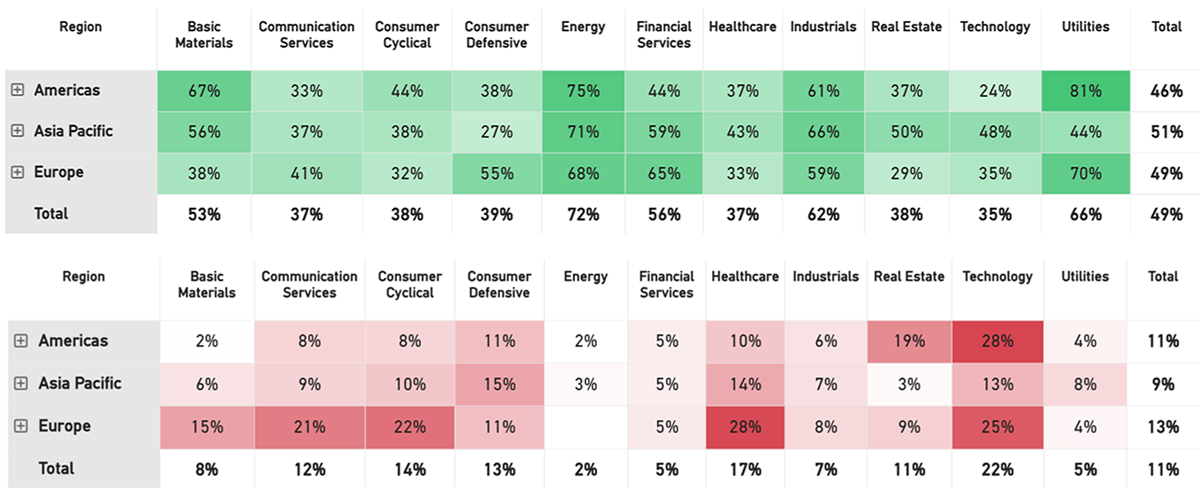
The Winners and Losers - Local Currency
The big divergences are in energy, with 72% winners and 2% losers. Industrials, Utilities, and Materials are in similar bullish states. In global stocks, 49% are in uptrends and only 11% in downtrends. Tech and Healthcare have the highest share of losers, but it is not unanimous.
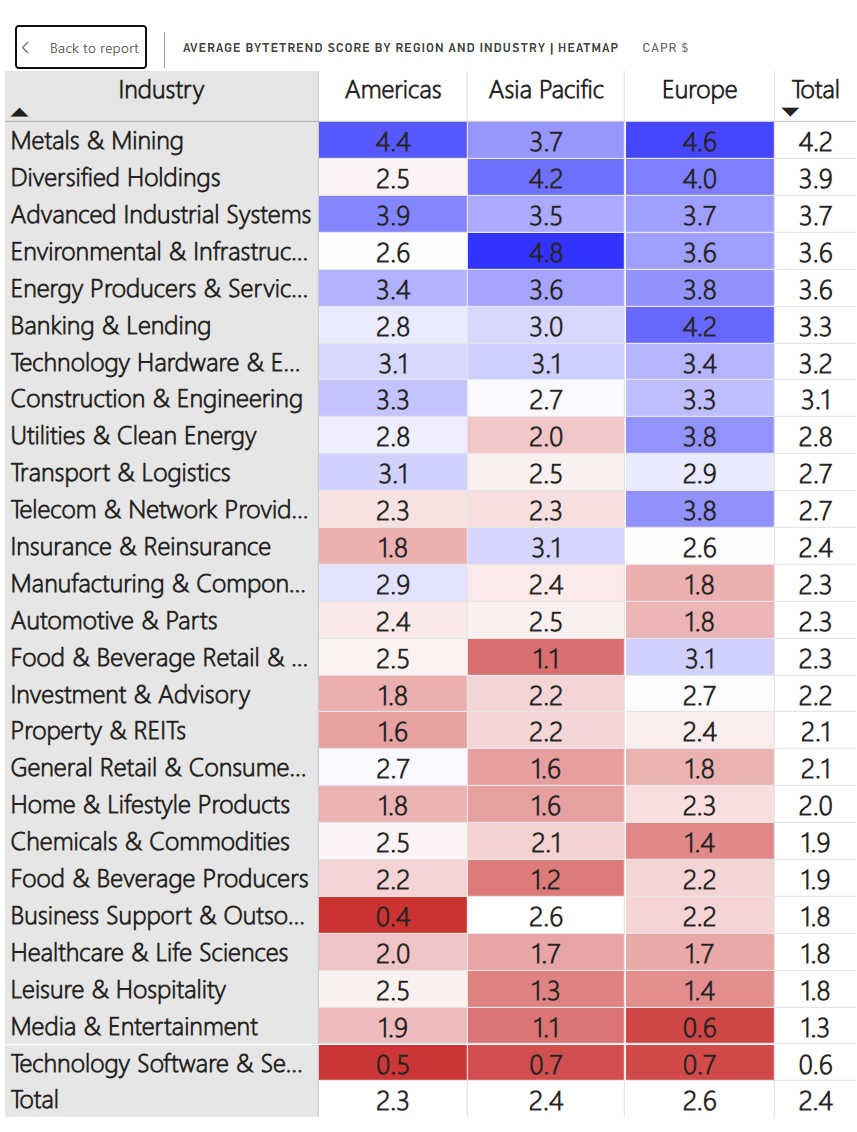
Regions and Industries Average CAPR Score
Energy remains strong across all regions. Property and REITs continue to strengthen, especially in Europe.
In Asia, Chemicals and Commodities continued to improve, and Media/Entertainment stocks continued their decline. Construction and Engineering also maintained their upward trend, as did Transport and Logistics.
In America, Business Support and Outsourcing is now the joint-weakest with Software, as the AI threat to white-collar work has led to widespread disruption fears.
User Guide
Refer to our GTI: User Guide for an overview of the key concepts and terminology used in this report. These concepts may take a little bit of getting used to, but they are very powerful once you do.
How to Read the Tables
The Value Composite Score (Value) is measured against the company’s own financial history and not in absolute terms. The columns are Cheap (Chp), Value (Val), Fair Value (FV), Overvalued (OV), and Expensive (Exp). The Growth Composite Score (Growth) is measured by sales, earnings, cash flow, dividends, and book value on a per share basis. The columns are High, Good, Medium (Med), Low, and Negative (Neg).
Leading Trends with New Highs
These stocks are trading at the 30-week CAPR highs with a ByteTrend Score of 5. All charts shown are CAPR rebased to 100.
| Name | Annual Vol 30w | Mkt Cap $Bn | Value | Growth |
| Taiwan Semiconductor Manufacturing | 23 | 1649 | OV | High |
| Samsung Electronics Co., Ltd. | 38 | 1006 | Exp | High |
| Exxon Mobil Corporation | 19 | 644 | OV | Neg |
| SK hynix Inc. | 55 | 509 | Exp | High |
| GE Aerospace | 27 | 361 | Exp | High |
| AstraZeneca PLC | 28 | 325 | FV | Good |
| Novartis AG | 20 | 324 | OV | Good |
| HSBC Holdings plc | 24 | 323 | OV | High |
| PetroChina Company Limited | 26 | 299 | OV | Good |
| GE Vernova Inc. | 34 | 237 | OV | Med |
| Amgen Inc. | 29 | 209 | OV | Med |
| Schneider Electric S.E. | 23 | 184 | OV | Med |
| Southern Copper Corporation | 33 | 180 | Exp | Good |
| The TJX Companies, Inc. | 14 | 180 | OV | Good |
| Analog Devices, Inc. | 32 | 174 | OV | Med |
| TotalEnergies SE | 18 | 170 | OV | Neg |
| ABB Ltd | 22 | 170 | OV | High |
| Siemens Energy AG | 34 | 168 | Exp | High |
| Rio Tinto Group | 16 | 161 | OV | Neg |
| Zijin Mining Group Company Limited | 37 | 153 | Exp | High |
| Lockheed Martin Corporation | 23 | 152 | OV | Med |
| Rolls-Royce Holdings plc | 24 | 149 | Exp | High |
| Newmont Corporation | 37 | 142 | OV | High |
| Chubb Limited | 18 | 134 | FV | Good |
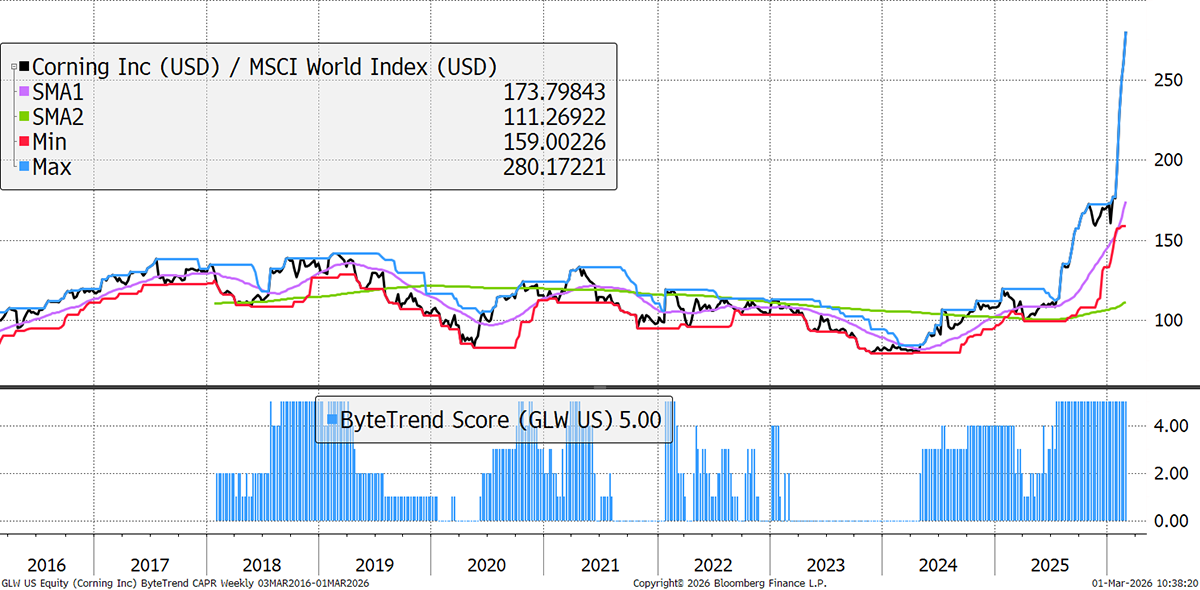
| Corning Incorporated | 37 | 129 | Exp | Good |
| Investor AB (publ) | 15 | 128 | FV | Good |
| BNP Paribas S.A. | 26 | 126 | OV | Good |
| Agnico Eagle Mines Limited | 40 | 126 | OV | High |
| Mitsubishi Corporation | 27 | 126 | Exp | Good |
| McKesson Corporation | 29 | 122 | OV | High |
| Enel S.p.A. | 20 | 121 | OV | High |
| Delta Electronics, Inc. | 43 | 118 | Exp | Good |
| CME Group Inc. | 20 | 115 | OV | Med |
| Delta Electronics (Thailand) Public | 47 | 112 | Exp | High |
| Chugai Pharmaceutical Co., Ltd. | 40 | 110 | OV | Good |
| Mitsui & Co., Ltd. | 26 | 108 | Exp | Med |
| Petróleo Brasileiro S.A. - Petrobras | 30 | 107 | FV | Neg |
| National Australia Bank Limited | 18 | 107 | OV | Good |
| Howmet Aerospace Inc. | 28 | 106 | Exp | High |
| Westpac Banking Corporation | 19 | 104 | OV | Good |
| Northrop Grumman Corporation | 20 | 103 | OV | Good |
| Grupo México, S.A.B. de C.V. | 35 | 99 | Exp | Med |
| MediaTek Inc. | 41 | 99 | Exp | Good |
| Freeport-McMoRan Inc. | 39 | 98 | Exp | Neg |
| Vertiv Holdings Co | 52 | 98 | Exp | High |
| Hyundai Motor Company | 71 | 95 | Exp | Good |
| Canadian Imperial Bank of Commerce | 14 | 94 | OV | Good |
| National Grid plc | 15 | 93 | OV | Good |
| Vinci S.A. | 25 | 93 | FV | Med |
| FedEx Corporation | 28 | 91 | OV | Med |
| The Williams Companies, Inc. | 24 | 91 | Exp | Neg |
| Canadian Natural Resources Limited | 24 | 91 | OV | Med |
| Johnson Controls International plc | 30 | 88 | Exp | Med |
| Ecolab Inc. | 19 | 87 | OV | Good |
| Quanta Services, Inc. | 25 | 84 | Exp | High |
| Monster Beverage Corporation | 20 | 83 | OV | Good |
| Engie S.A. | 20 | 83 | OV | High |
| AB Volvo (publ) | 22 | 79 | OV | Good |
| Mitsubishi Electric Corporation | 29 | 79 | Exp | Good |
| Kinder Morgan, Inc. | 21 | 74 | OV | Low |
| Wheaton Precious Metals Corp. | 36 | 74 | Exp | Low |
| Infineon Technologies AG | 37 | 71 | OV | Neg |
| Eni S.p.A. | 18 | 68 | OV | Neg |
| Suncor Energy Inc. | 21 | 68 | OV | Neg |
| Crédit Agricole S.A. | 21 | 67 | OV | Good |
| Ross Stores, Inc. | 18 | 67 | OV | Med |
| CMOC Group Limited | 50 | 67 | Exp | High |
| Simon Property Group, Inc. | 16 | 67 | OV | Good |
| Singapore Telecommunications | 19 | 66 | OV | High |
| Baker Hughes Company | 25 | 64 | OV | Good |
| AngloGold Ashanti Plc | 43 | 64 | Exp | High |
| Valero Energy Corporation | 33 | 64 | OV | Neg |
| E.on Se | 18 | 61 | OV | High |
| BOC Hong Kong (Holdings) | 22 | 61 | FV | Good |
| Orange S.A. | 18 | 57 | Exp | Neg |
| Antofagasta plc | 31 | 57 | Exp | Neg |
| Sandvik AB (publ) | 17 | 55 | OV | Good |
| Kia Corporation | 43 | 55 | OV | Good |
| AMETEK, Inc. | 15 | 55 | OV | Good |
| National Bank of Canada | 16 | 55 | OV | Good |
| Sun Hung Kai Properties Limited | 28 | 54 | FV | High |
| ASE Technology Holding Co., Ltd. | 52 | 54 | Exp | Neg |
| Cardinal Health, Inc. | 30 | 54 | OV | Low |
| Franco-Nevada Corporation | 35 | 54 | OV | Good |
| Ferrovial SE | 17 | 54 | OV | High |
| Keysight Technologies, Inc. | 44 | 53 | OV | Med |
| Disco Corporation | 52 | 52 | Exp | Good |
| Gold Fields Limited | 43 | 52 | Exp | High |
| Sumitomo Electric Industries, Ltd. | 47 | 52 | Exp | High |
| Targa Resources Corp. | 29 | 51 | Exp | Good |
| ArcelorMittal S.A. | 25 | 50 | Exp | Neg |
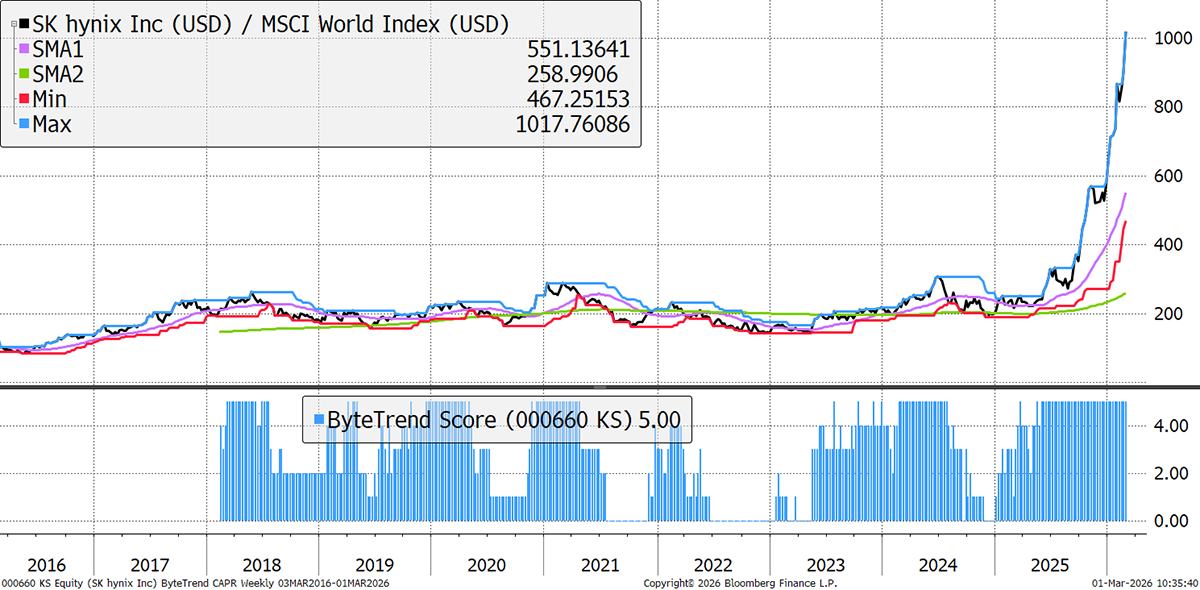
SK Hynix
This is one of the most remarkable charts out there. Surging demand for high-bandwidth memory (HBM) chips used in AI accelerators, where SK Hynix holds a 60% market share, has propelled it to record profits amid supply shortages and price hikes. Their Q4 2025 operating profit more than doubled to 19 trillion KRW ($13.8 billion).
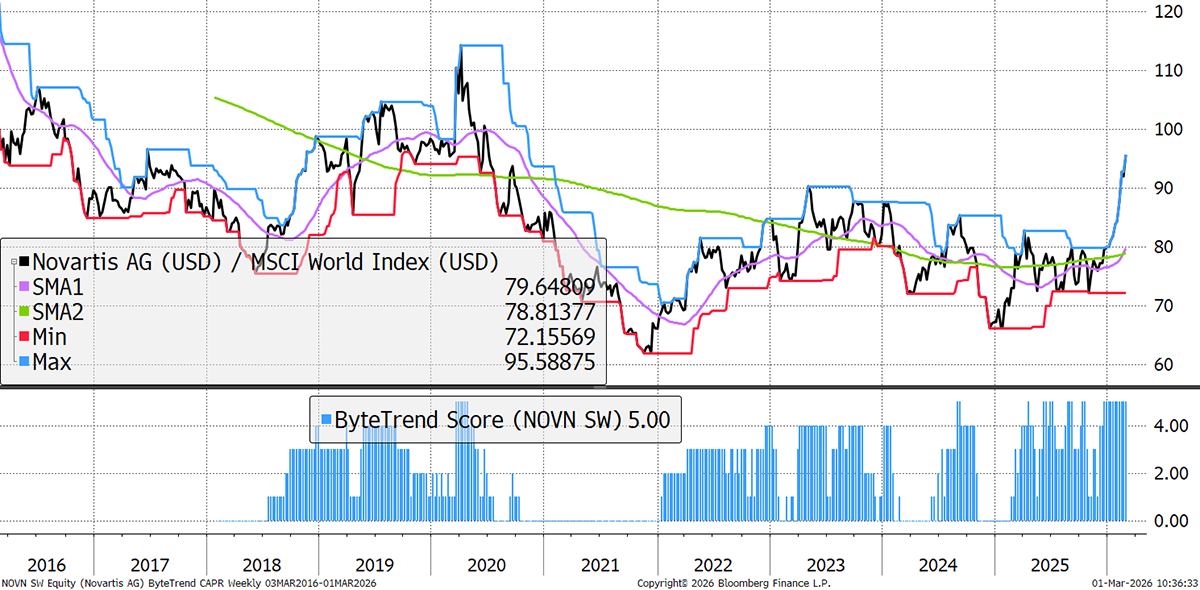
Novartis
Novartis was an early pick in our Quality portfolio. Huge and historic, based in pharma-focused Basel, its core growth products have been strong, and FDA approvals have been favourable. Meanwhile, it is acquiring Avidity Biosciences for $12 billion, expanding its portfolio ahead of patent expirations. Free cash flow growth is strong, and buybacks are steady.
Corning
Another extraordinary chart is Corning. Once again, you guessed it, this is driven primarily by explosive demand for its optical connectivity products tied to AI data centre expansion.
New Leading Trends
These stocks are trading at the 30-week CAPR highs with a ByteTrend Score of 5, except they are new trends this week, having previously had a score below 5. All charts shown are CAPR rebased to 100.
| Name | Annual Vol 30w | Mkt Cap $Bn | Value | Growth |
| Shell plc | 18 | 233 | FV | Neg |
| BHP Group Limited | 25 | 211 | OV | Neg |
| China Petroleum & Chemical Corp | 18 | 115 | OV | Neg |
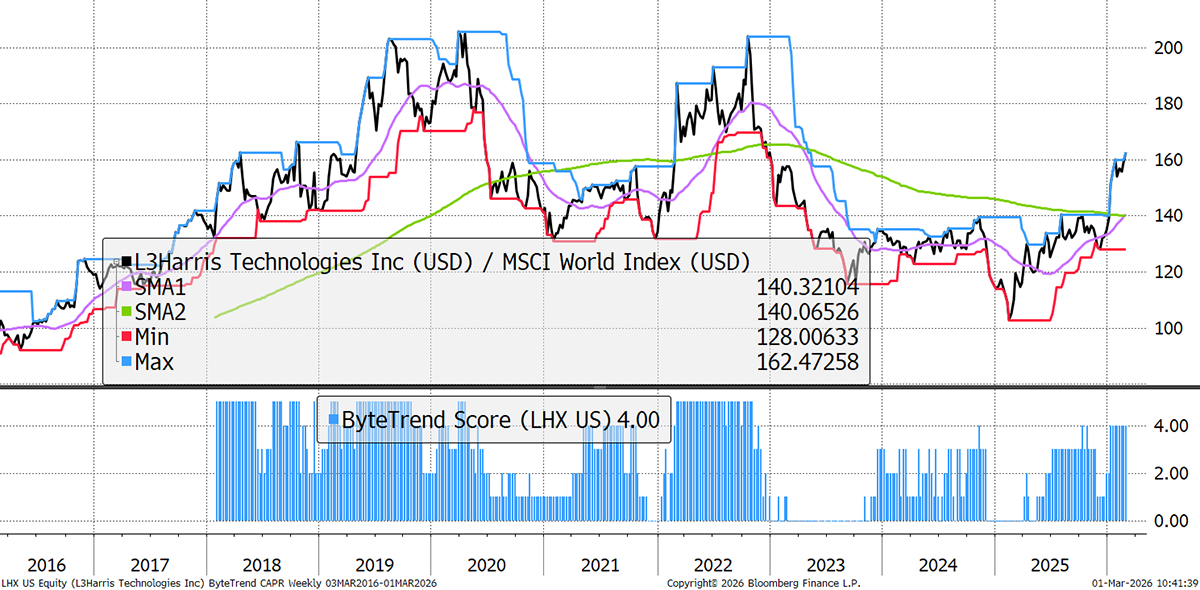
| L3Harris Technologies, Inc. | 20 | 68 | OV | Med |
| Coca-Cola Europacific Partners PLC | 20 | 50 | OV | Med |
L3Harris Technologies
L3Harris was formed from the merger of L3 Technologies and Harris Corporation in 2019. This merger of equals created a top-tier aerospace and defence firm. Organic growth took some time to accelerate during this defence boom, but it’s happening now, and the stock is catching up.
Emerging Trends
These stocks are trading at the 30-week CAPR highs with a ByteTrend Score of less than 5. They don’t have to be in an uptrend, just emerging. All charts shown are CAPR rebased to 100.
| Name | Annual Vol 30w | Mkt Cap $Bn | Value | Growth |
| Johnson & Johnson | 18 | 599 | OV | Good |
| Roche Holding AG | 29 | 380 | FV | Low |
| Chevron Corporation | 18 | 373 | OV | Neg |
| The Coca-Cola Company | 14 | 351 | OV | Low |
| Merck & Co., Inc. | 31 | 309 | FV | High |
| McDonald's Corporation | 12 | 243 | FV | Med |
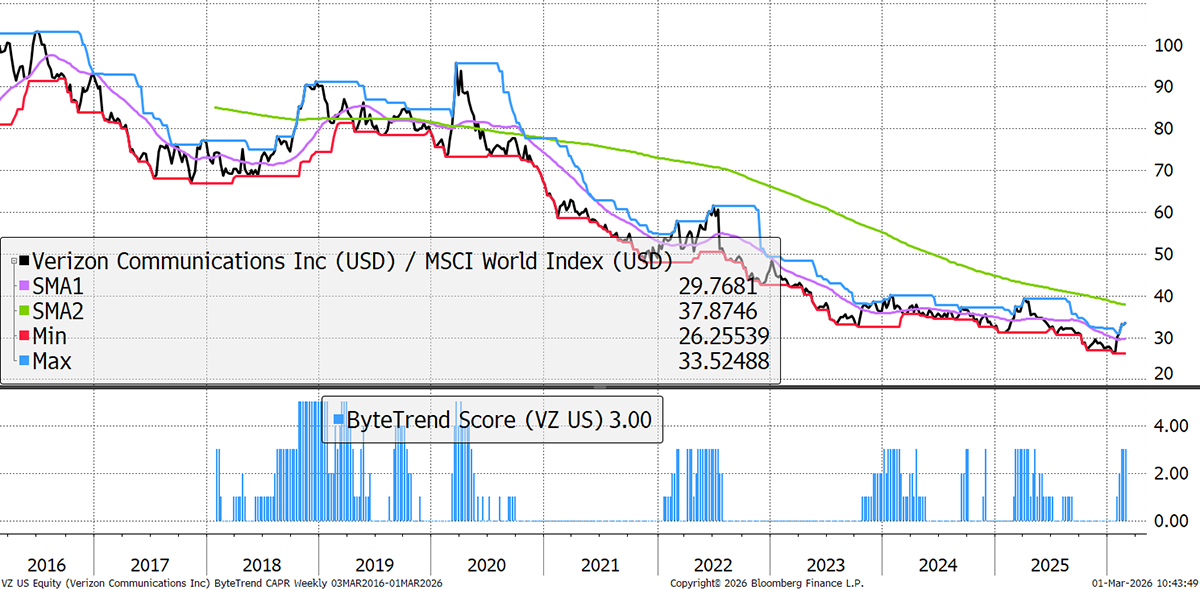
| Verizon Communications Inc. | 24 | 211 | FV | Med |
| Deutsche Telekom AG | 25 | 197 | FV | Good |
| NextEra Energy, Inc. | 21 | 195 | FV | Good |
| The Toronto-Dominion Bank | 11 | 164 | FV | High |
| Anheuser-Busch InBev SA/NV | 20 | 158 | FV | Good |
| Union Pacific Corporation | 19 | 157 | FV | Low |
| Honeywell International Inc. | 22 | 155 | OV | Med |
| ConocoPhillips | 25 | 139 | FV | Neg |
| Prologis, Inc. | 22 | 133 | FV | Good |
| Bristol-Myers Squibb Company | 25 | 127 | FV | Med |
| Vertex Pharmaceuticals Incorporated | 36 | 126 | FV | Low |
| BP p.l.c. | 22 | 99 | OV | Neg |
| Equinix, Inc. | 23 | 96 | FV | Good |
| Glencore plc | 29 | 84 | Exp | Neg |
| Colgate-Palmolive Company | 18 | 80 | Exp | Good |
| CSX Corporation | 21 | 79 | OV | Neg |
| Canadian Pacific Kansas City Ltd. | 19 | 79 | FV | Neg |
| América Móvil, S.A.B. de C.V. | 25 | 78 | FV | High |
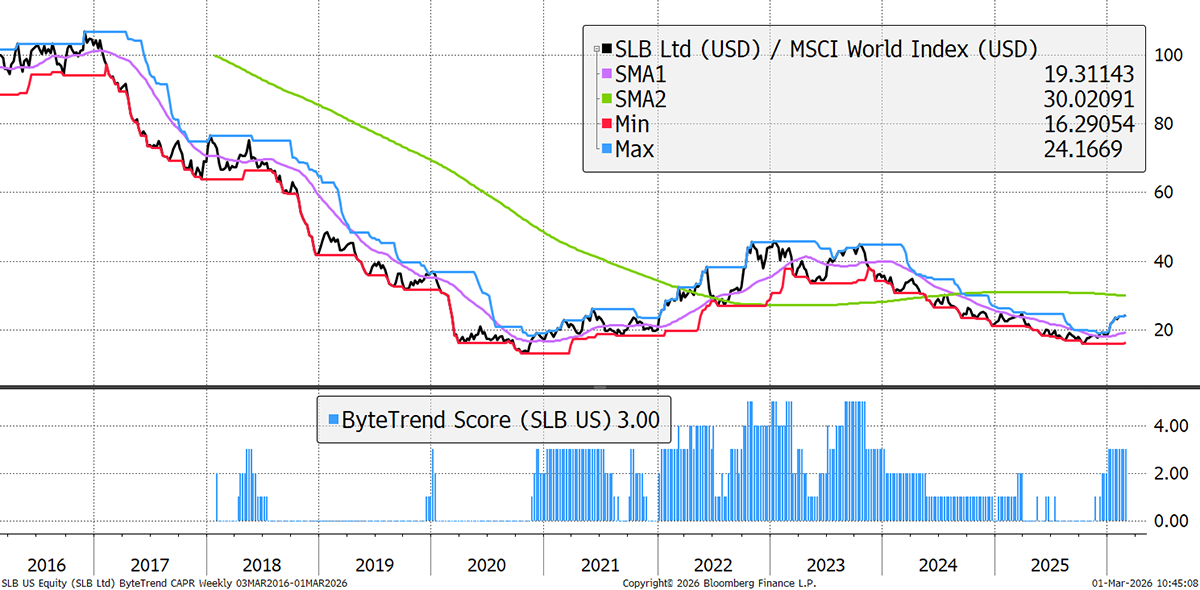
| SLB N.V. | 31 | 77 | FV | Good |
| Shin-Etsu Chemical Co., Ltd. | 30 | 74 | OV | Med |
| Equinor ASA | 22 | 74 | FV | Neg |
| Vale S.A. | 15 | 74 | OV | Neg |
| American Electric Power Company, Inc. | 19 | 72 | FV | Med |
| Canadian National Railway Company | 16 | 69 | FV | Low |
| TC Energy Corporation | 18 | 67 | OV | High |
| Realty Income Corporation | 15 | 62 | FV | Med |
| Takeda Pharmaceutical Company | 19 | 59 | OV | Neg |
| Corteva, Inc. | 20 | 54 | OV | High |
| Anglo American plc | 25 | 53 | Exp | Neg |
| Occidental Petroleum Corporation | 27 | 52 | FV | Neg |
| Ambev S.A. | 19 | 50 | Val | Good |
Verizon Communications
Verizon completed its $20 billion all-cash acquisition of Frontier Communications last month, adding 7.2 million fibre locations (2.2 million subscribers) across 31 states. This augments Verizon's own Fios network, expanding total fibre passings to 30 million. It also enables more bundling of premium wireless broadband services, and it is highly beneficial for free cash flow generation.
SLB
Schlumberger has been driving strong free cash flow growth and reducing debt, putting it in a strong position for an oil run. This came after it completed its $7.8 billion acquisition of ChampionX in mid-2025, which is a supplier of extraction technologies that SLB already used.
Weakening
These stocks are trading at the 30-week CAPR lows with a ByteTrend Score above 0. They are weakening trends but not yet downtrends. All charts shown are CAPR rebased to 100.
| Name | Annual Vol 30w | Mkt Cap $Bn | Value | Growth |
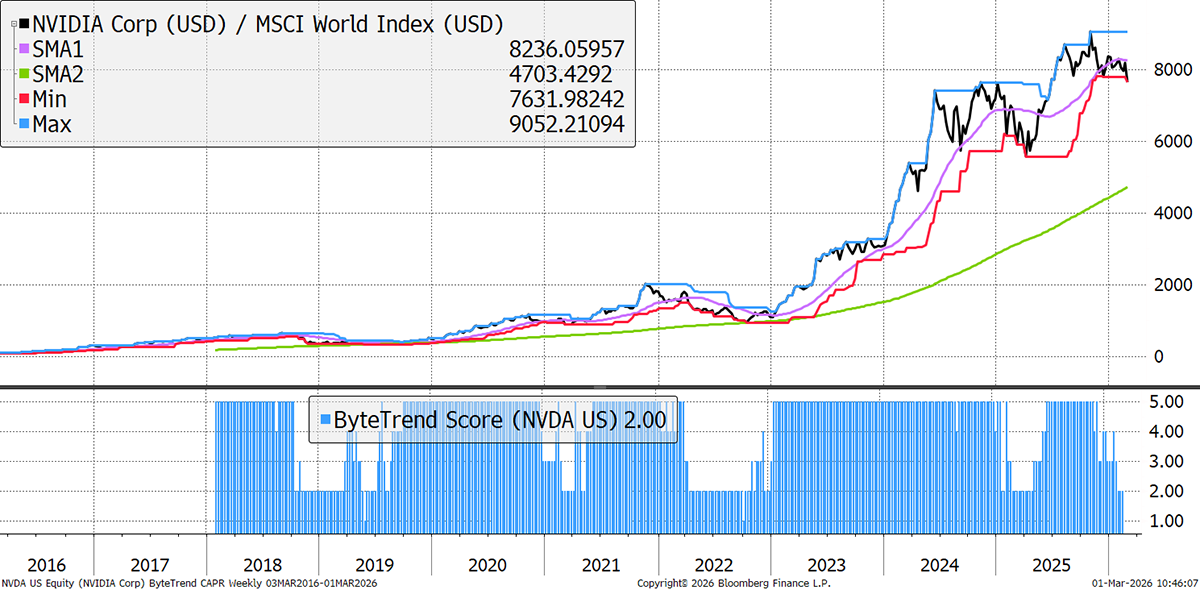
| NVIDIA Corporation | 28 | 4307 | FV | High |
| Broadcom Inc. | 42 | 1515 | Exp | High |
| JPMorgan Chase & Co. | 22 | 810 | OV | Good |
| Wells Fargo & Company | 28 | 256 | FV | Good |
| Hermès International | 23 | 254 | FV | Good |
| Agricultural Bank of China Limited | 26 | 238 | FV | Med |
| SAP SE | 24 | 235 | FV | High |
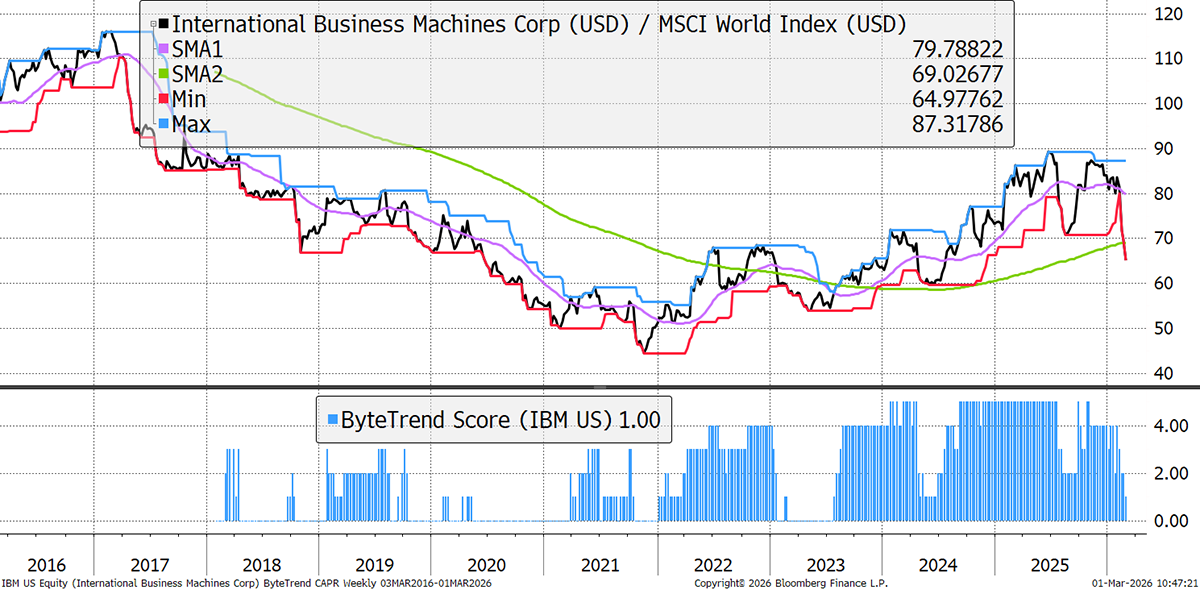
| International Business Machines | 30 | 225 | OV | High |
| American Express Company | 28 | 213 | OV | Good |
| Airbus SE | 23 | 172 | FV | Good |
| BlackRock, Inc. | 20 | 165 | OV | Low |
| Capital One Financial Corporation | 28 | 124 | OV | Low |
| EssilorLuxottica S.A. | 31 | 123 | FV | Med |
| Bharti Airtel Limited | 17 | 118 | Exp | High |
| Xiaomi Corporation | 31 | 116 | FV | High |
| CrowdStrike Holdings, Inc. | 39 | 94 | FV | High |
| MercadoLibre, Inc. | 38 | 89 | Chp | High |
| KKR & Co. Inc. | 35 | 78 | OV | High |
| Elevance Health Inc. | 30 | 71 | Val | Neg |
| Robinhood Markets, Inc. | 66 | 68 | Exp | High |
| Apollo Global Management, Inc. | 32 | 61 | FV | High |
| Cloudflare, Inc. | 45 | 61 | FV | High |
| Discover Financial Services | 0 | 50 |
NVIDIA
NVIDIA has not generated any alpha since late 2024, merely tracking the market. The hardware rally has moved on. Recent results were far ahead of expectations (supposedly even further ahead than people expected – it’s a game of bluff), and yet, the stock’s brief rise was short-lived, and it has crashed back below where it was. It is facing rising competition from Google and others, leading to concerns that its monopoly position may not last. Its EV-to-Sales has fallen from 45x to 20x, ROIC has been falling for five quarters in a row, and the stock is 15% below its peak.
IBM
IBM suffered its worst fall in 25 years last week, as Anthropic released a tool that could read and improve IBM’s COBOL computer language. COBOL is used in 95% of U.S. ATM transactions and critical finance/government systems. This tool sparked fears of disruption to IBM's lucrative mainframe (zSystems) and consulting business, where COBOL modernisation services form a key moat. Essentially, it was added to the “vulnerable to disruption” list.
Bear Trends
These stocks are trading at the 30-week CAPR lows with a ByteTrend Score of 0. They are in a downtrend. All charts shown are CAPR rebased to 100.
| Name | Annual Vol 30w | Mkt Cap $Bn | Value | Growth |
| Microsoft Corporation | 21 | 2916 | FV | Med |
| Tencent Holdings Limited | 26 | 597 | Val | Good |
| Mastercard Incorporated | 19 | 462 | FV | Good |
| Bank of America Corporation | 24 | 364 | FV | Good |
| Reliance Industries Limited | 18 | 207 | OV | Good |
| The Walt Disney Company | 17 | 188 | FV | High |
| Novo Nordisk A/S | 60 | 167 | Chp | Good |
| HDFC Bank Limited | 14 | 150 | Val | High |
| Blackstone Inc. | 30 | 136 | FV | Good |
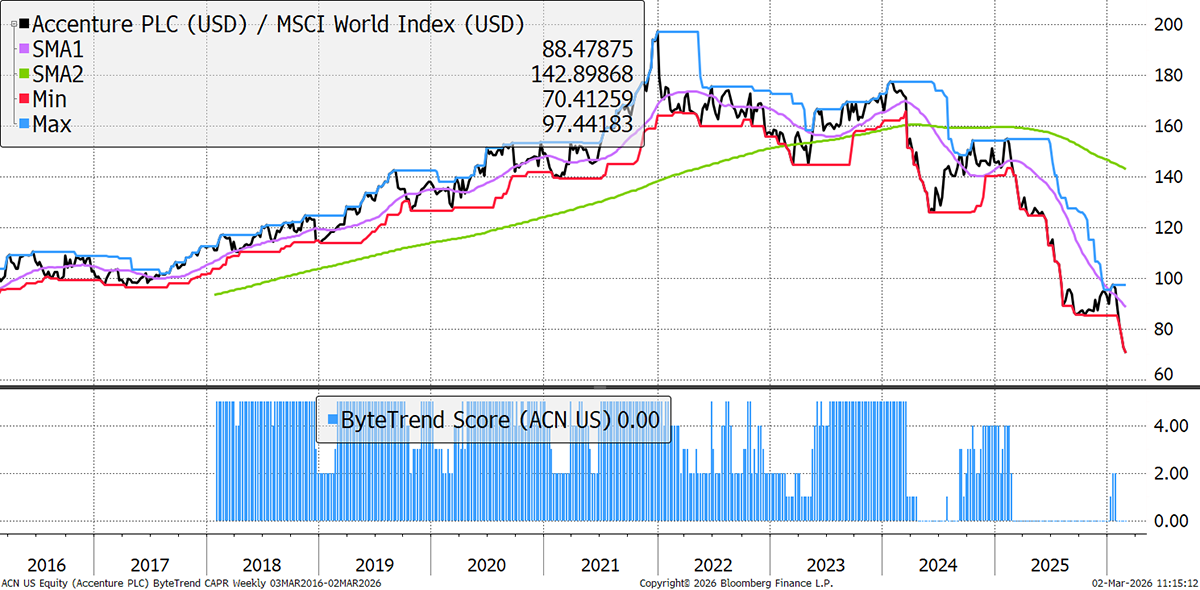
| Accenture plc | 29 | 129 | Val | Med |
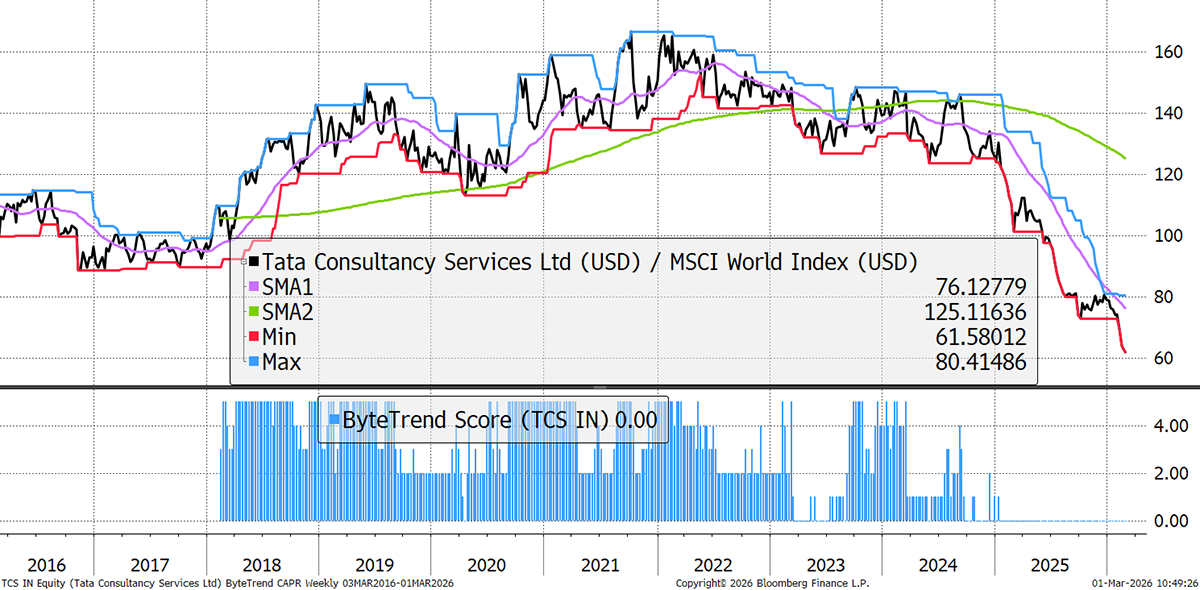
| Tata Consultancy Services Limited | 22 | 105 | Val | Med |
| Palo Alto Networks, Inc. | 35 | 104 | FV | Good |
| Marsh & McLennan Companies, Inc. | 20 | 90 | ||
| Automatic Data Processing, Inc. | 21 | 87 | FV | Good |
| Brookfield Asset Management Ltd. | 21 | 75 | High | |
| NetEase, Inc. | 31 | 73 | Val | Good |
| Postal Savings Bank of China Co., Ltd. | 20 | 67 | FV | Low |
| Meituan | 36 | 63 | Chp | High |
| Infosys Limited | 27 | 58 | FV | Good |
| Snowflake Inc. | 48 | 58 | FV | High |
| Saudi Telecom Company | 14 | 56 | OV | Med |
| PT Bank Central Asia Tbk | 23 | 53 | Val | Good |
| CSL Limited | 43 | 51 | Val | Good |
Accenture
AI is like a free consultant. The Big Four, and others, are desperately trying to learn how to co-opt this incredible tool to avoid being replaced by it. The uncertainty of success is what’s leading these declines. Labour-intensive, white-collar companies are firmly in the sights of AI disruption fears. Some may survive, even thrive, but the market is shooting first and asking questions later.
TATA Consultancy
TATA Consultancy faces the same disruption threat, but also faces the added geographic headwind. India’s bull market ended long ago, and high valuations have left companies exposed. Companies are reducing spending on IT and consultants to focus on deploying AI, putting pressure on growth and margins at the likes of TATA. Growth was especially weak in America and in its tech services business.
GTI 200 Spreadsheet
We are pleased to share the GTI 200 spreadsheet. Download the spreadsheet below to view the CAPR and local currency scores, and more, for the world’s largest 200 stocks. Have a look at the different groups and the main list “All stocks”. The Insights tab is interesting, and don’t forget to expand the columns by clicking on the “+” at the top of the page if you want to see more trend data.
Outlook
The World Index is resilient, as most stocks are rising. Yet volatility has risen, and events in the Middle East could escalate. The leading themes in hard assets remain, but the tech hardware winners should note NVIDIA’s peak.
Thanks for reading GTI.


