
Quality Slumps


Issue 15;
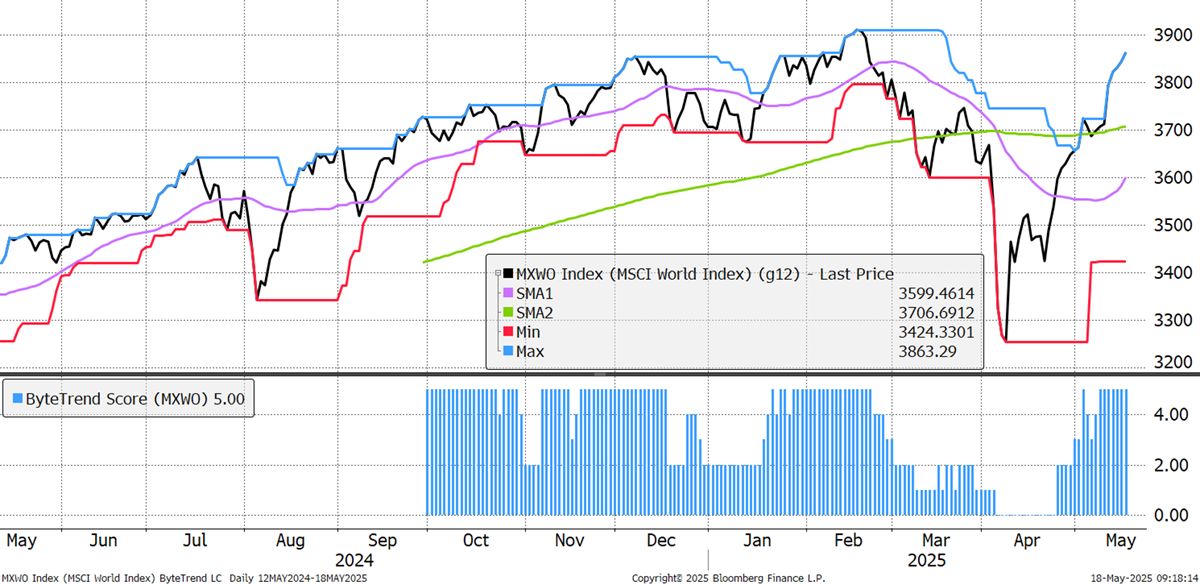
In a remarkable turnaround, the World Index is back to where it was in February. The ByteTrend score is a 5, indicating an uptrend. Most stocks are trading well above their lows, typically by 20% or more. This indicates a broad rally across sectors and regions.
World Index – Developed Markets - Daily
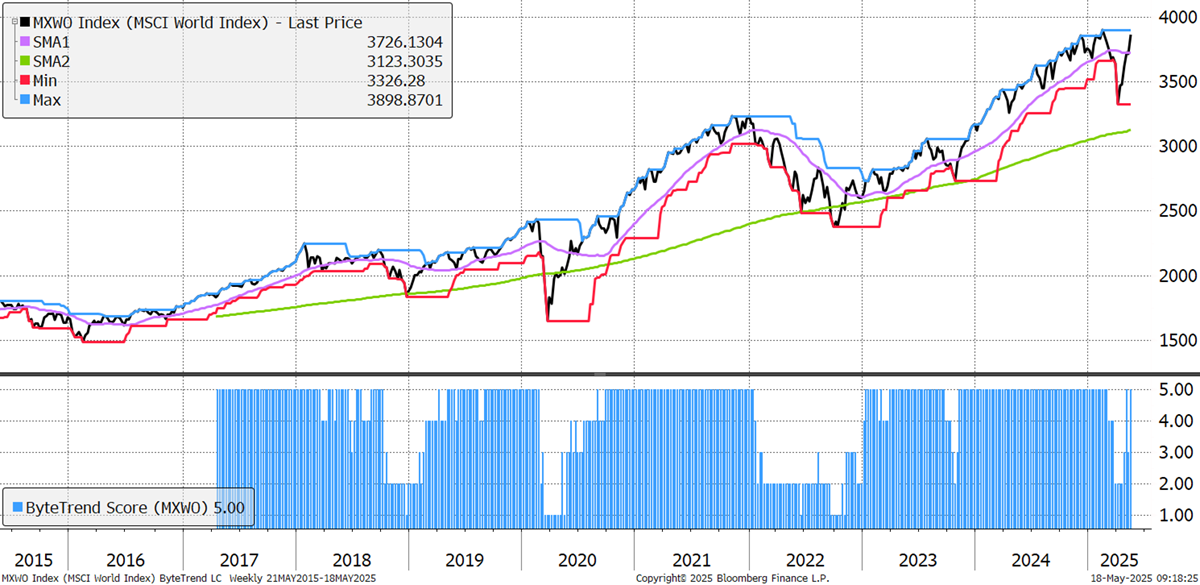
On the weekly chart, the ByteTrend score is also a 5. Some commentators still think this is a bear market rally, but this now seems unlikely. The trend is too strong.
World Index – Developed Markets - Weekly
Market breadth is recovering with fewer stocks showing ByteTrend scores of 0 (red bars), and additional strong trends with scores of 5 (blue). This means it’s not just the large-caps supporting this rally, and participation is broadening. Contrast that with January and February, where breadth was weakening ahead of the market correction in April. Things are now improving.
ByteTrend: Weekly Breadth Signal
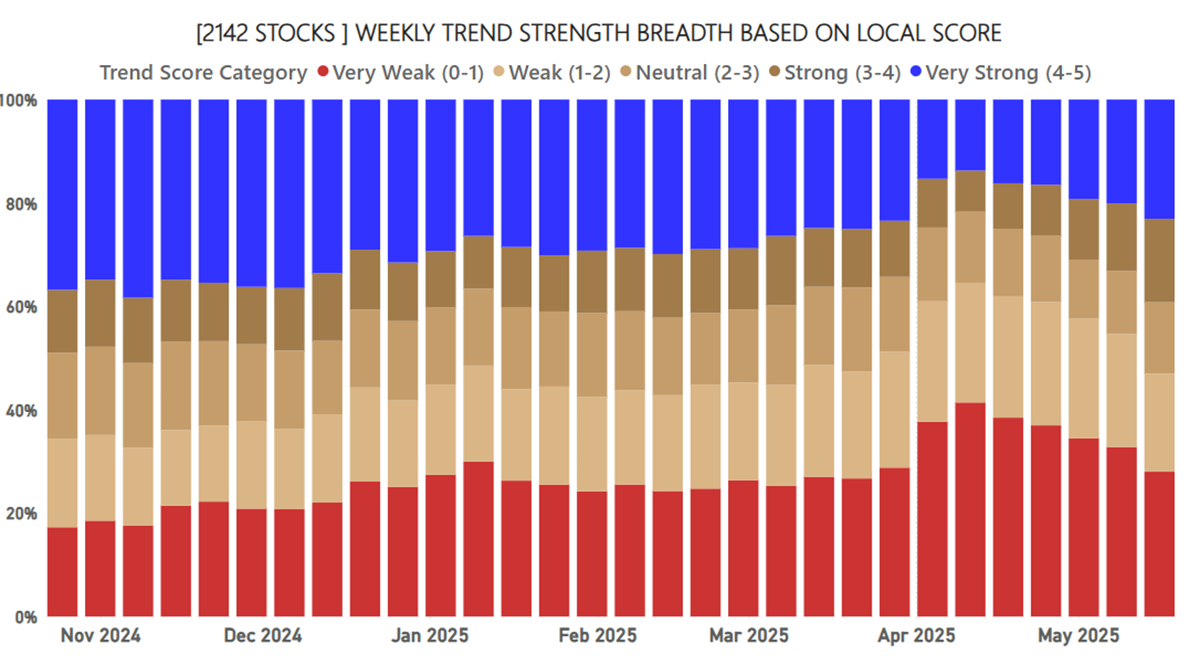
To be clear, this breadth chart shows ByteTrend scores, which don’t have to have new highs or lows.
Leaders and Laggards
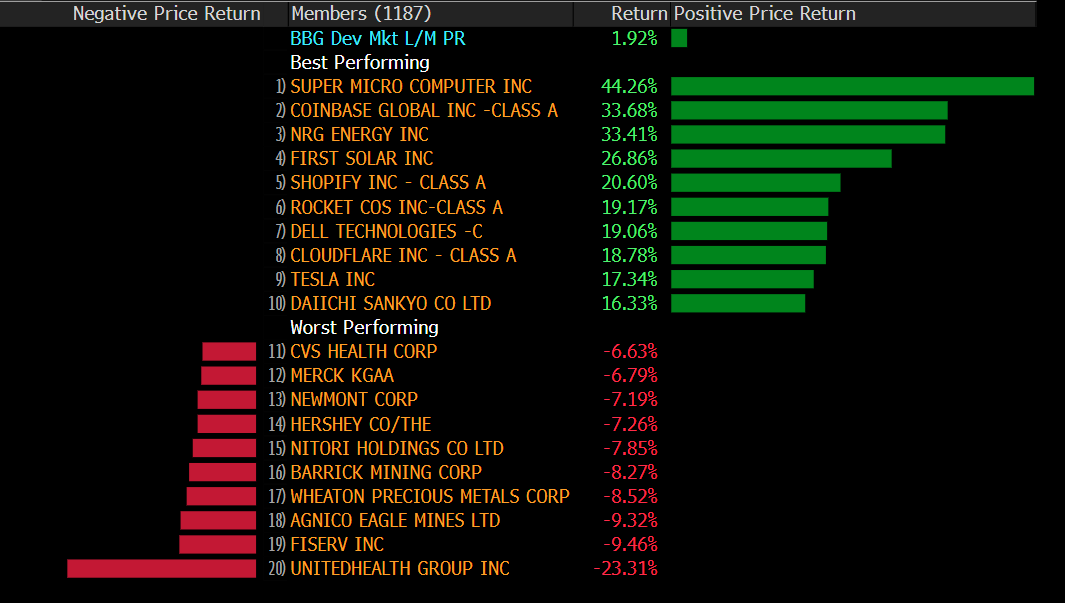
In an example of how powerful trends can be, UnitedHealth was flagged as a bear trend in last week’s GTI 200, and it crashed thereafter. Some gold miners also came under pressure. On the bright side, Coinbase joined the S&P 500, and various tech names did well.
Developed Markets Leaders and Laggards
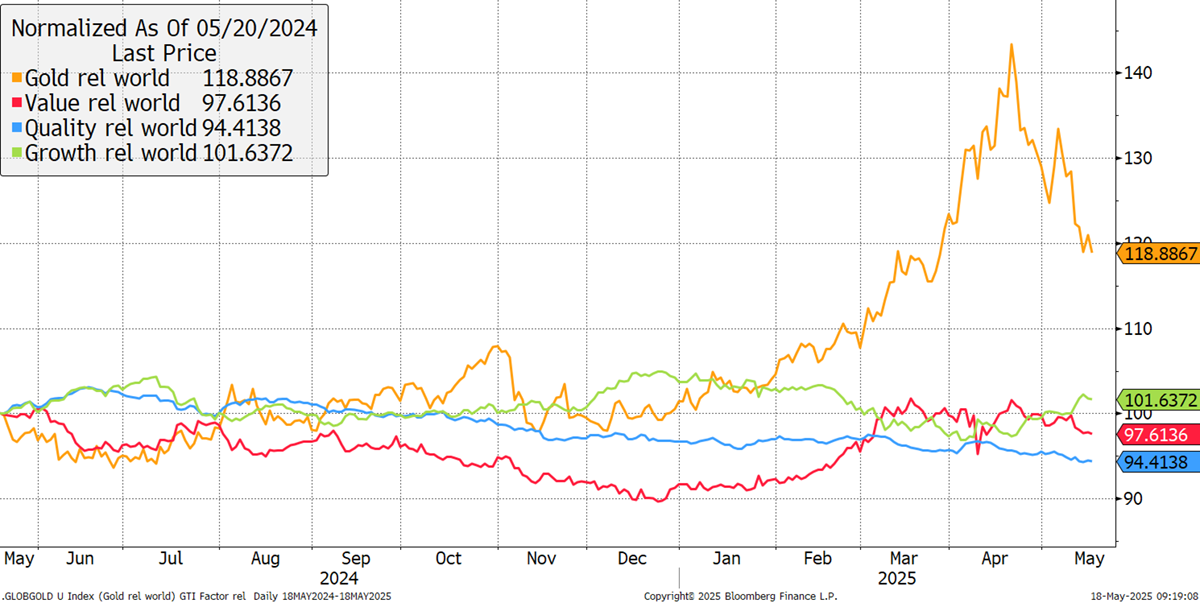
Gold is lagging this rally, along with Quality, which continues to drag. Value is stable, but Growth has recently made a comeback.
Major Factors CAPR since 2020 - Past Year
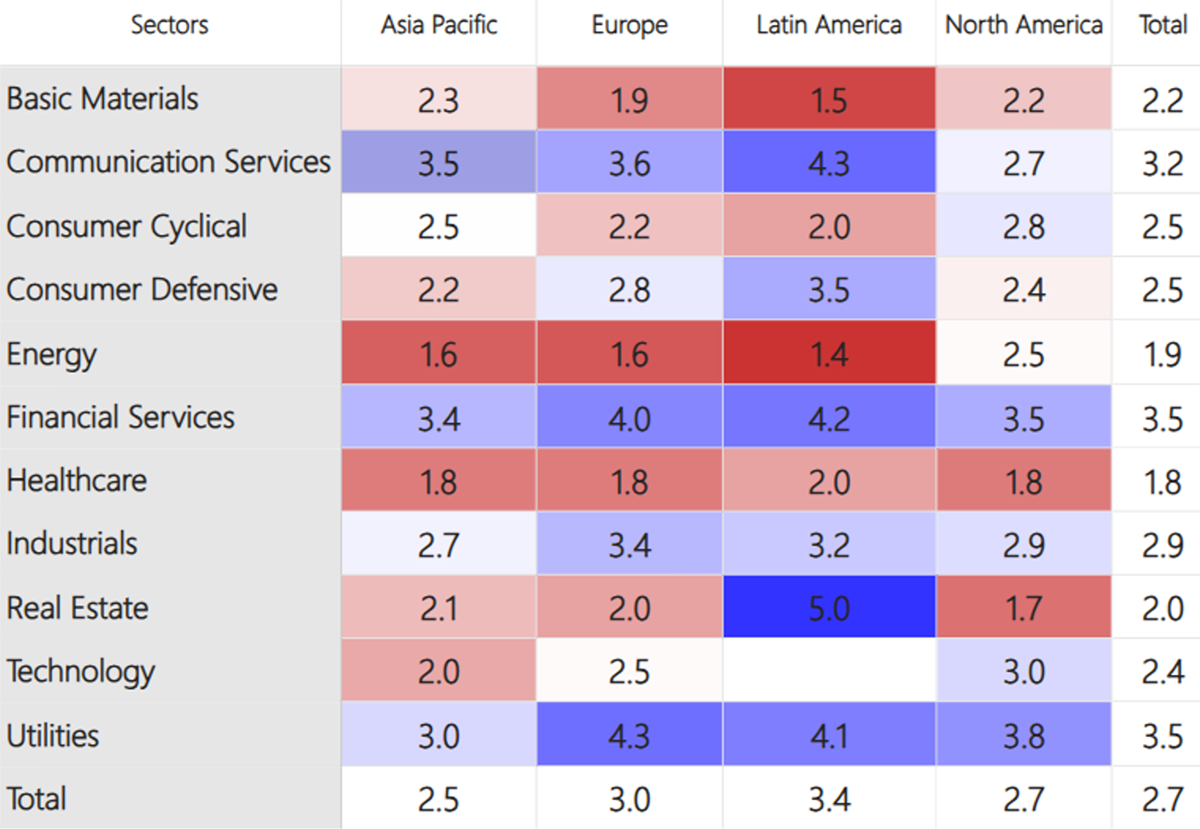
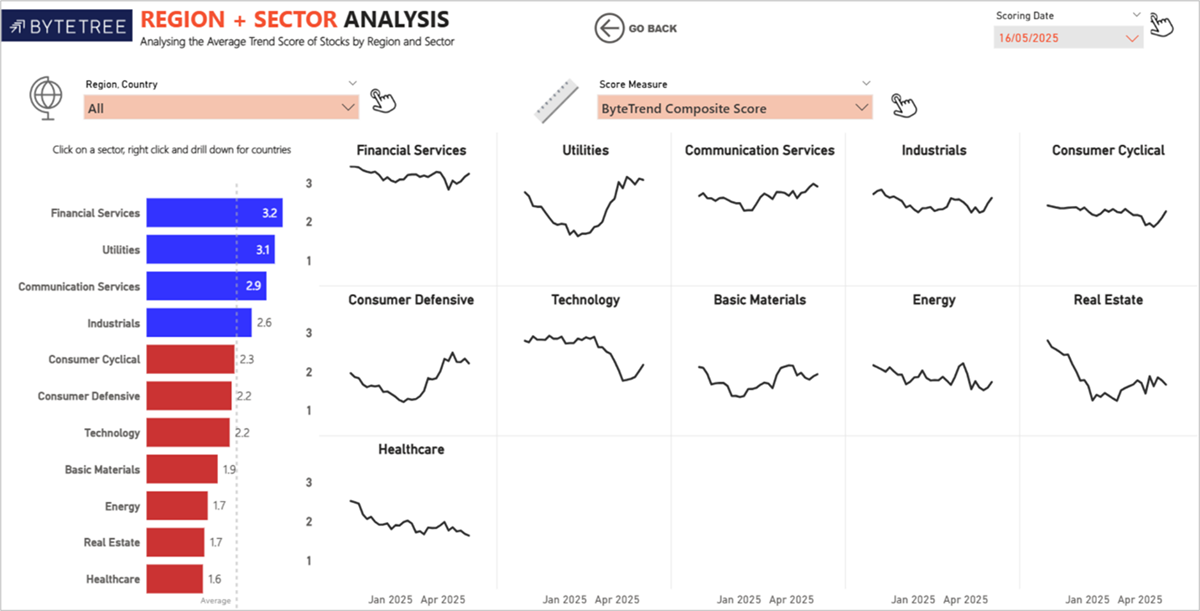
The world matrix still favours utilities, which are strong. Communications remain strong, with industrials quietly improving. Financials are strong in all regions, especially in Europe, as bond yields remain elevated. Natural resources, energy and materials lag behind.
Average ByteTrend Score by Region and Sector Heatmap - CAPR
Leading Trends with New Highs
These stocks are trading at the 30-week CAPR highs with a ByteTrend Score of 5. All charts shown are CAPR rebased to 100.
| Ticker | FX | Name | Score CAPR | % Dev from CAPR 30W High | % Dev from CAPR 30W Low | Annual. Vol 30w | MCap Bn USD | Sector | Industry |
|---|---|---|---|---|---|---|---|---|---|
| PLTR | USD | Palantir Tech | 5 | 0 | 193 | 94 | 306 | Tech | Software Infra |
| GE | USD | General Electric | 5 | 0 | 38 | 40 | 247 | Indust | Aerospace |
| UBER | USD | Uber Tech | 5 | 0 | 51 | 42 | 192 | Tech | Software |
| DE | USD | Deere & Company | 5 | 0 | 32 | 33 | 144 | Indust | Ag Mach |
| MELI | USD | MercadoLibre | 5 | 0 | 46 | 38 | 131 | Con Cycl | Spec Retail |
| GEV | USD | GE Vernova | 5 | 0 | 43 | 57 | 117 | Utility | Renew |
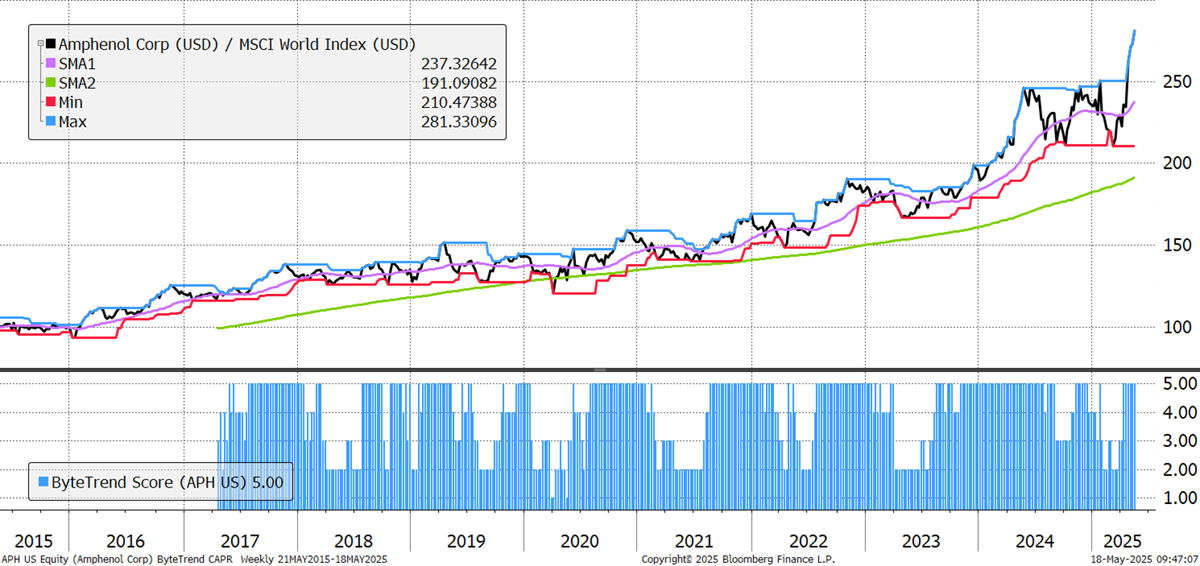
| APH | USD | Amphenol | 5 | 0 | 34 | 43 | 105 | Tech | Hardware |
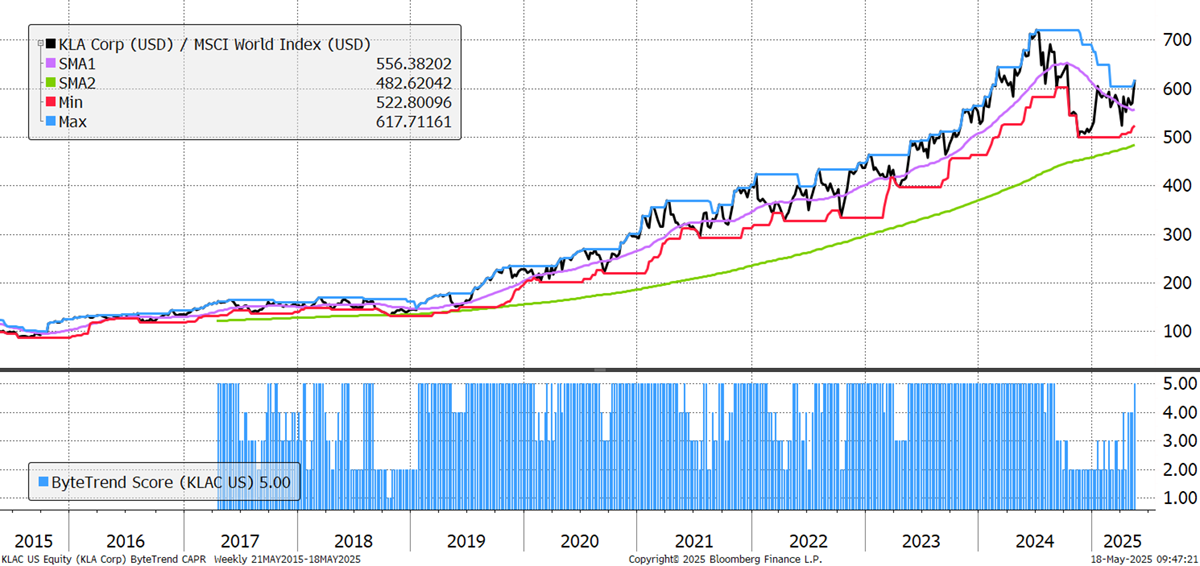
| KLAC | USD | KLA | 5 | 0 | 24 | 44 | 105 | Tech | Semis |
| TT | USD | Trane Tech | 5 | 0 | 22 | 35 | 96 | Indust | Constr |
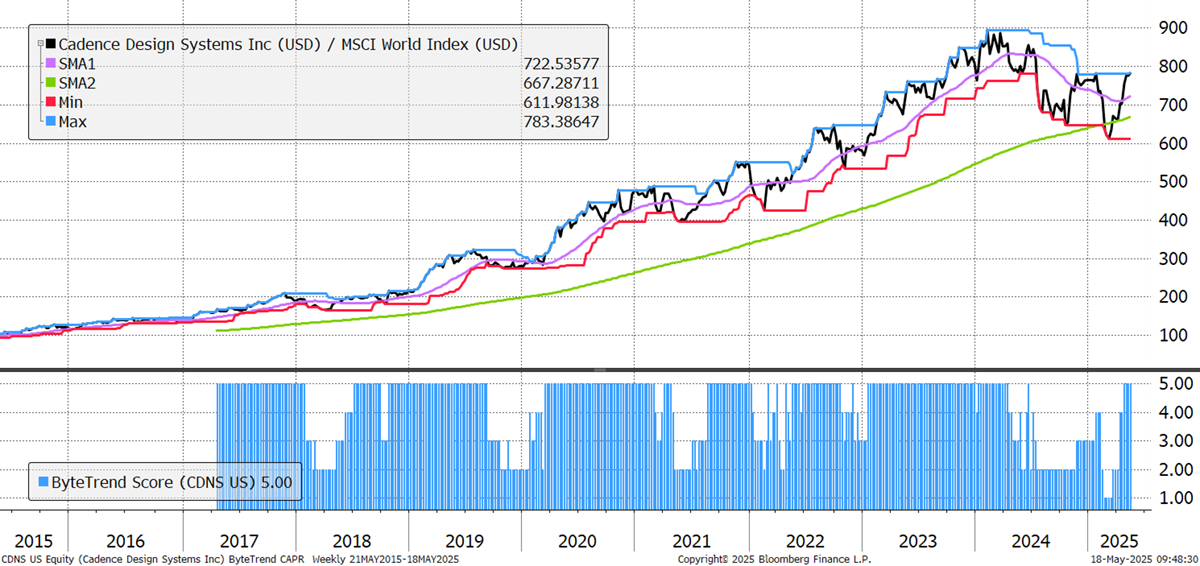
| CDNS | USD | Cadence Design | 5 | 0 | 28 | 40 | 88 | Tech | Software |
Before we start, the fact that a company’s share price is strong and has made a new high is not an implied recommendation. GTI works like a filter for stocks. Forecasting the winners is like finding a needle in a haystack. By searching among stocks that are already beating the market, the haystack becomes smaller. The greatest stocks of the next decade will frequently appear on this Leading Trends list, but being on the list doesn’t guarantee it will turn out to be a great stock. Studying market trends keeps us all better informed on the risks and opportunities that lie ahead.
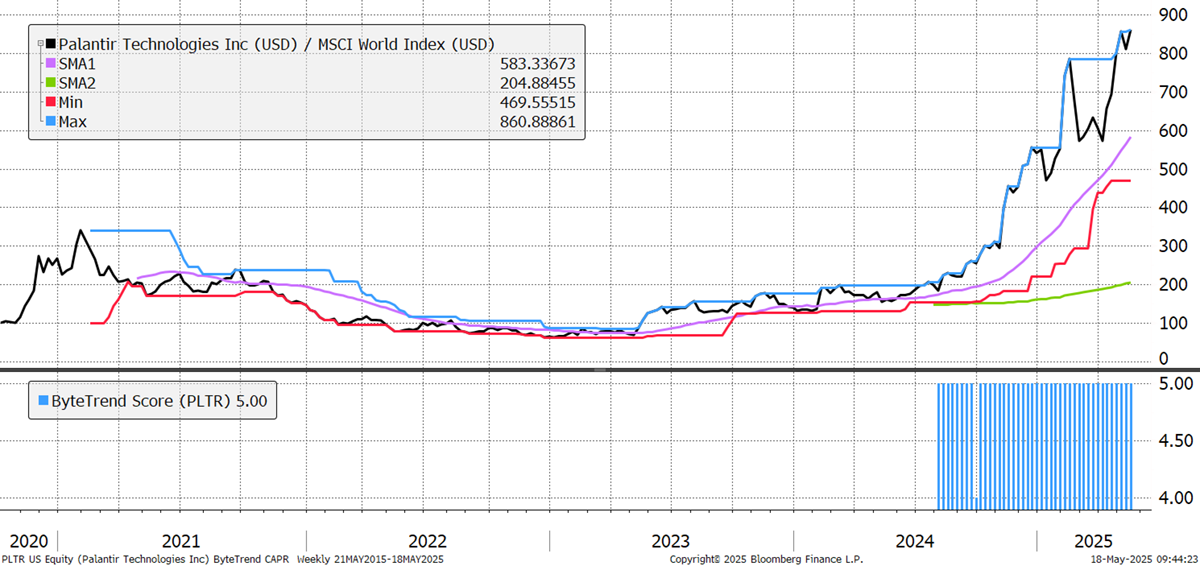
No one seems to know exactly what Palantir do, but whatever it is, they should keep on doing it. There is controversy over the use of its technology to support Trump’s recent deportations, with documents calling its software “mission critical”, but the company is denying the connection. It is widely used by police departments for surveillance, health organisations for data management, and by many other public services as well. It is close to breaking 100x on its EV/Sales ratio, currently at 96x.
Palantir
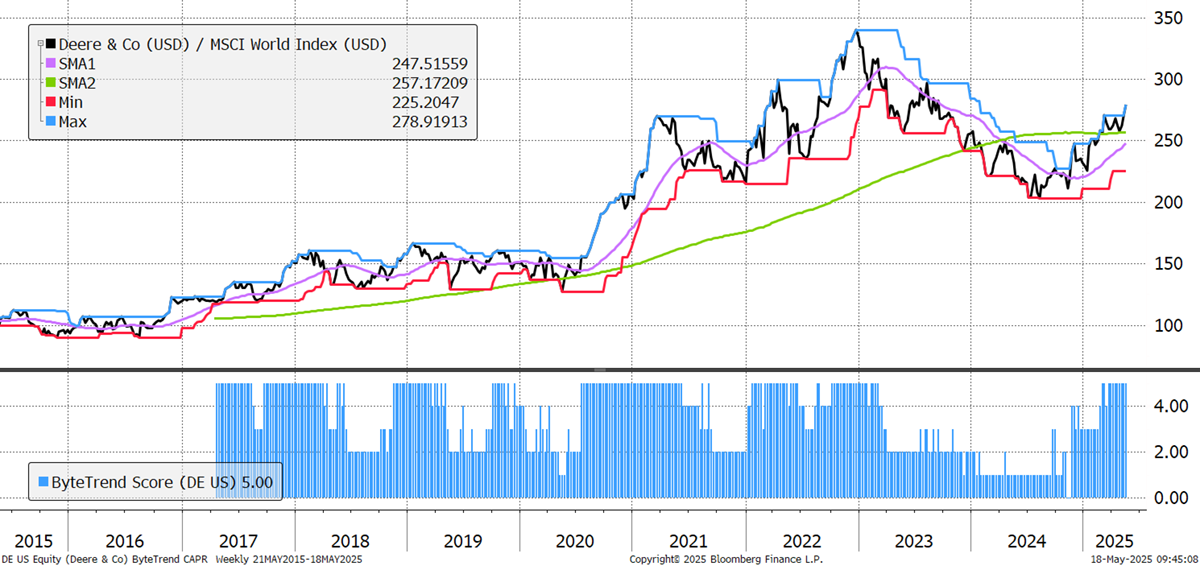
Soft commodity prices have improved, especially for soybeans, coffee, and meats. That is good news for market leader Deere & Co. Its revenue and net income fell in recent Q2 results, but EPS beat expectations thanks to an internal efficiency drive, and together with commodity prices, this saw it recently make its first ByteTrend score of 5 in two years.
Deere & Co
Amphenol, a leader in fibre optics, has been very steadily beating the market for a decade, but its volatility has recently increased. Revenue growth has accelerated to 30% YoY, with high returns on invested capital. This is a great company, but it now trades on its highest EV/Sales ratio (6.6x) and lowest FCF/EV Yield (2.0%) in over 25 years.
Amphenol Corp
Semiconductors are back in front, and KLA Corp is one example. It is a global leader in semiconductor process control and inspection equipment. It just beat financial guidance and raised its dividend by 12%. Its growth is fuelled by strong demand in advanced packaging and AI-related semiconductor investments. It just had its weakest patch in CAPR terms since 2017, but is back to a 5 for now.
KLA Corp
Cadence Design Systems is a global leader in electronic design automation (EDA) software, hardware, and IP, serving industries ranging from semiconductors to automotive and life sciences. This year, it raised its annual revenue and profit forecasts on strong demand for its chip design tools amid the AI boom, despite headwinds from China-related tariffs. It also reported robust financials, with a record backlog and continued innovation in AI-driven design and advanced system modelling.
Cadence Design Systems
There are 19 additional leading trends with new highs in the GTI universe, including Tencent Music, Hindustan Aeronautics and Cochin Shipyard. Indian defence stocks are soaring.
Emerging Trends
These stocks are trading at the 30-week CAPR highs with a ByteTrend Score of less than 5. They don’t have to be in an uptrend, just emerging. All charts shown are CAPR rebased to 100.
| Ticker | FX | Name | Score CAPR | % Dev from CAPR 30W High | % Dev from CAPR 30W Low | Annual. Vol. 30w | MCap Bn USD | Sector | Industry |
|---|---|---|---|---|---|---|---|---|---|
| SCHW | USD | Charles Schwab | 4 | 0 | 18 | 33 | 161 | Finance | Cap Mkts |
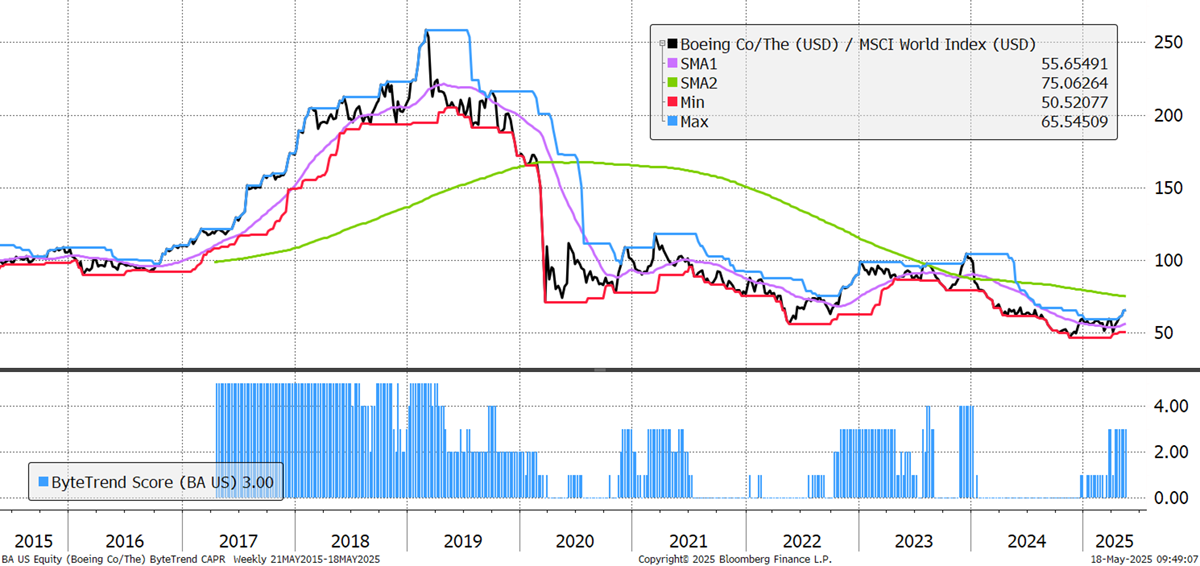
| BA | USD | Boeing | 3 | 0 | 41 | 50 | 155 | Indust | Aerospace |
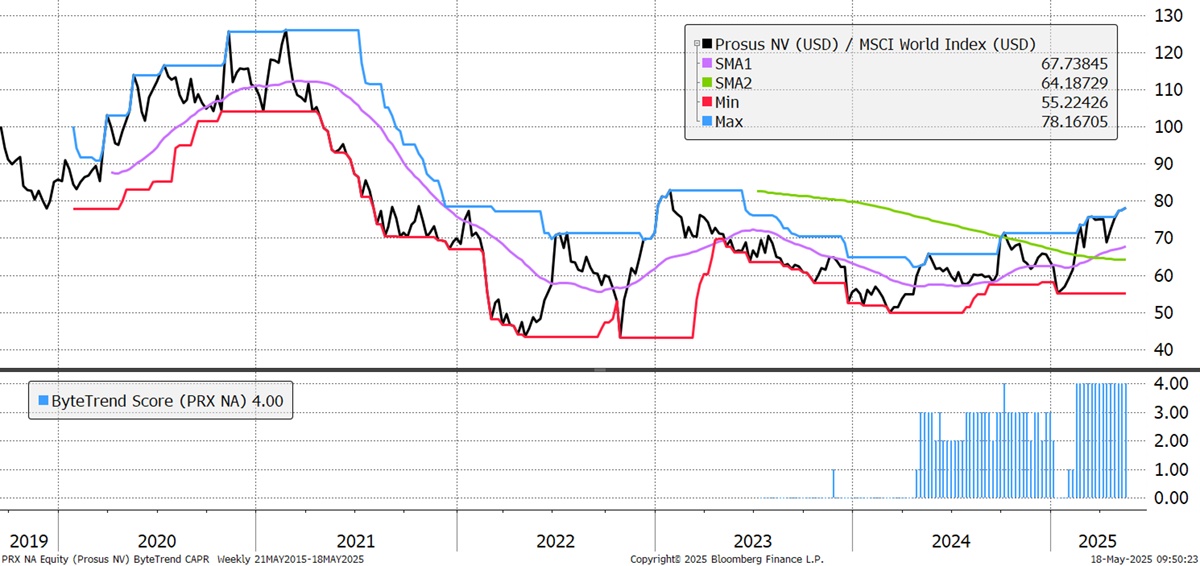
| PRX | EUR | Prosus | 4 | 0 | 42 | 38 | 112 | Comms | Internet |
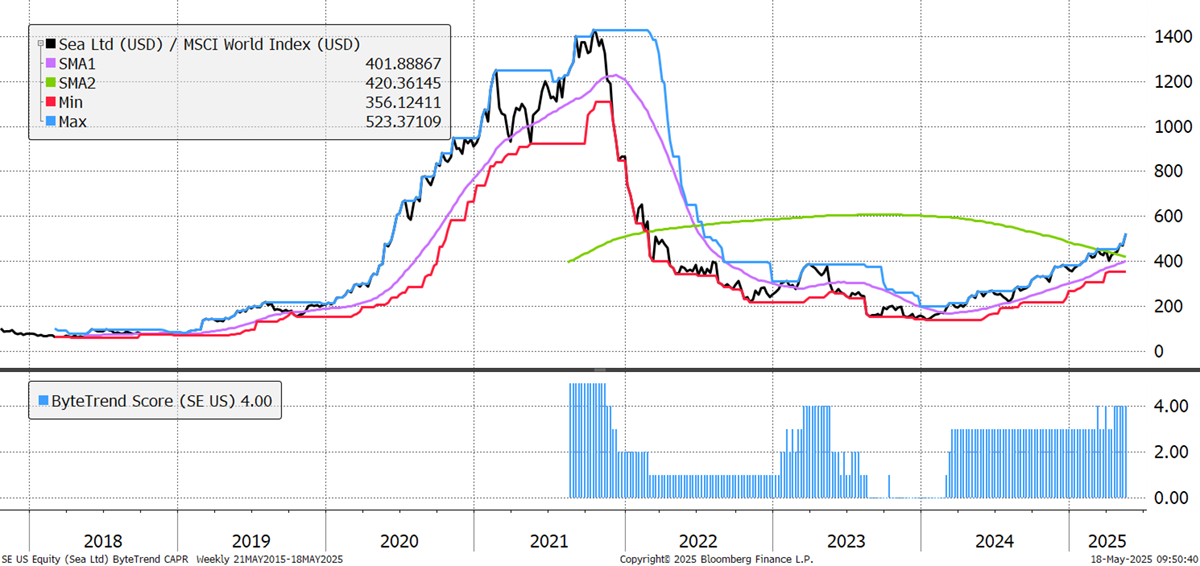
| SE | USD | Sea | 4 | 0 | 69 | 48 | 95 | Con Cycl | Spec Retail |
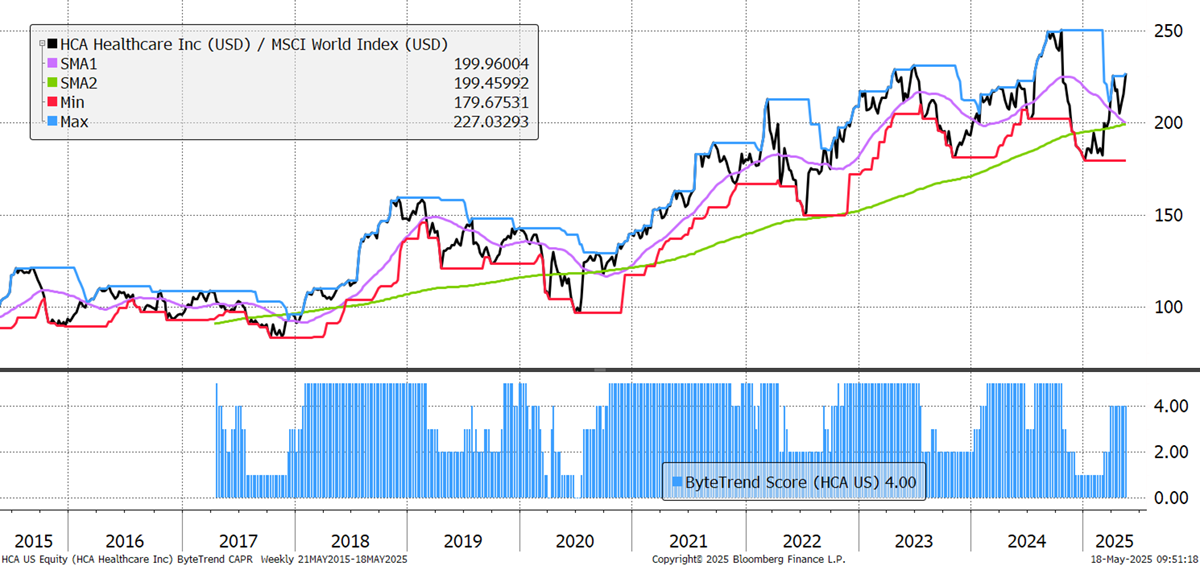
| HCA | USD | HCA Healthcare | 4 | 0 | 26 | 31 | 93 | Health | Med care |
| CVNA | USD | Carvana | 4 | 0 | 64 | 81 | 64 | Con Cycl | Spec Retail |
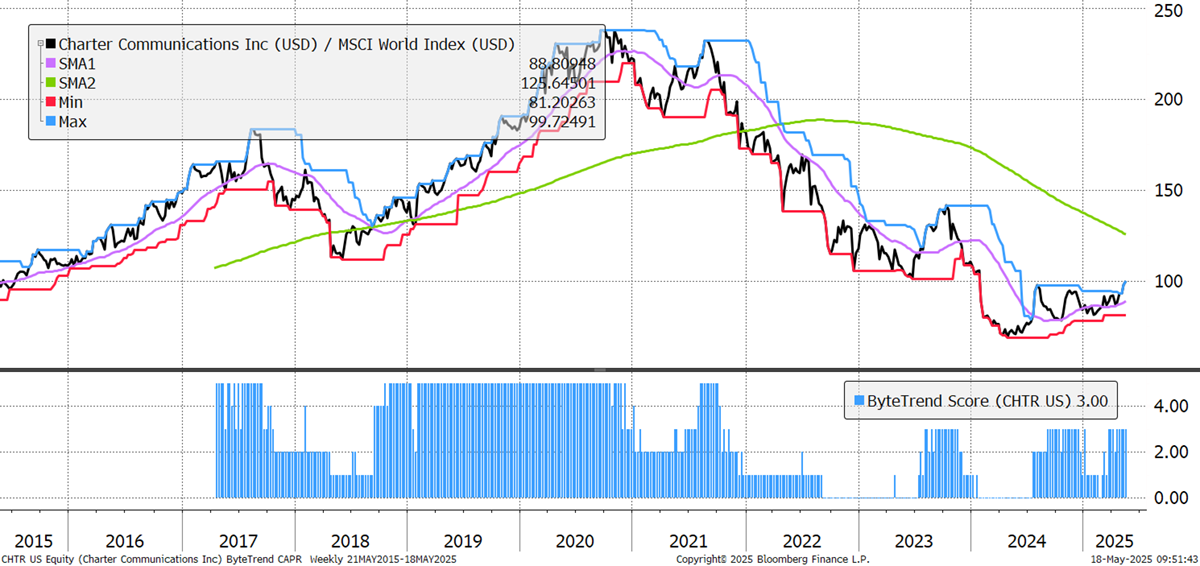
| CHTR | USD | Charter Comms | 3 | 0 | 23 | 35 | 60 | Comms | Telecoms |
Boeing is notable among the leaders, as is GE, an aircraft engine manufacturer. Aerospace is back, and Boeing had a good set of Q1 results, with large orders from the UK and the Middle East. Revenue rose 18% year-over-year to $19.5 billion, with improved operating performance and a reduced net loss. Commercial aeroplane deliveries surged, the backlog reached $545 billion, and cash flow usage narrowed, while operational improvements continued across divisions. Risks remain from the supply chain and regulations, but the outlook is more positive with further production increases planned.
Boeing
Prosus appears again, still scoring 4. Its most recent results were in December 2024, and it showed strong financial performance, with a 16% increase in revenue and a significant turnaround in operating profits. It’s running a large share buyback program, which continues at pace. In the last four years, 35% of shares have been retired, funded by orderly, on-market sales of Prosus’s Tencent shares.
Prosus NV
Singapore-based technology company Sea Ltd has significantly increased free cash flow per share from a negative figure over the last ten quarters. The share price took time to wake up to this, but by the time they flipped into positive territory in 2023, the stock was ready to outperform. The 200-week moving average is taking time to turn, but when it does, Sea will have a ByteTrend score of 5. It has seen strong revenue growth per employee since the COVID-19 pandemic, and recent results have shown strong results across the business, with e-commerce, digital financial services, and digital entertainment all posting record or near-record results.
Sea Ltd
HCA Health’s Q1 2025 results showed continued revenue and adjusted EBITDA growth, with strong demand driving higher admissions and emergency room visits. Net income and EPS increased year-over-year, excluding prior year gains on facility sales, while cash flow from operations declined. Full-year guidance was reaffirmed, but risks remain from economic, regulatory, and operational factors. Gross margins have risen to record levels (40.9%) since the start of 2024, and revenue/employee has grown in a nearly straight line since 2001.
HCA Healthcare
Charter Communications, a leading U.S. broadband and cable provider operating under the Spectrum brand, serves over 32 million customers. In Q1 2025, Charter reported a 1.2% revenue increase to $13.7 billion, despite facing a continued decline in video subscribers and rising capital expenditures for network upgrades, which is reflected in the four-year underperformance visible below. The company is investing heavily in rural broadband expansion and next-generation wireless services to drive future growth amid intensifying industry competition, and the chart is starting to reflect a bit more investor belief.
Charter Communications
There are 34 additional emerging trends in the GTI universe. Shipping companies such as Denmark’s Maersk, Taiwan’s Evergreen, and Yang Ming. Mosaic, an agricultural supplier, is also strong.
Weakening
These stocks are trading at the 30-week CAPR lows with a ByteTrend Score above 0. They are weakening trends but not yet downtrends. All charts shown are CAPR rebased to 100.
| Ticker | FX | Name | Score CAPR | % Dev from CAPR 30W High | % Dev from CAPR 30W Low | Annual. Vol. 30w | MCap Bn USD | Sector | Industry |
|---|---|---|---|---|---|---|---|---|---|
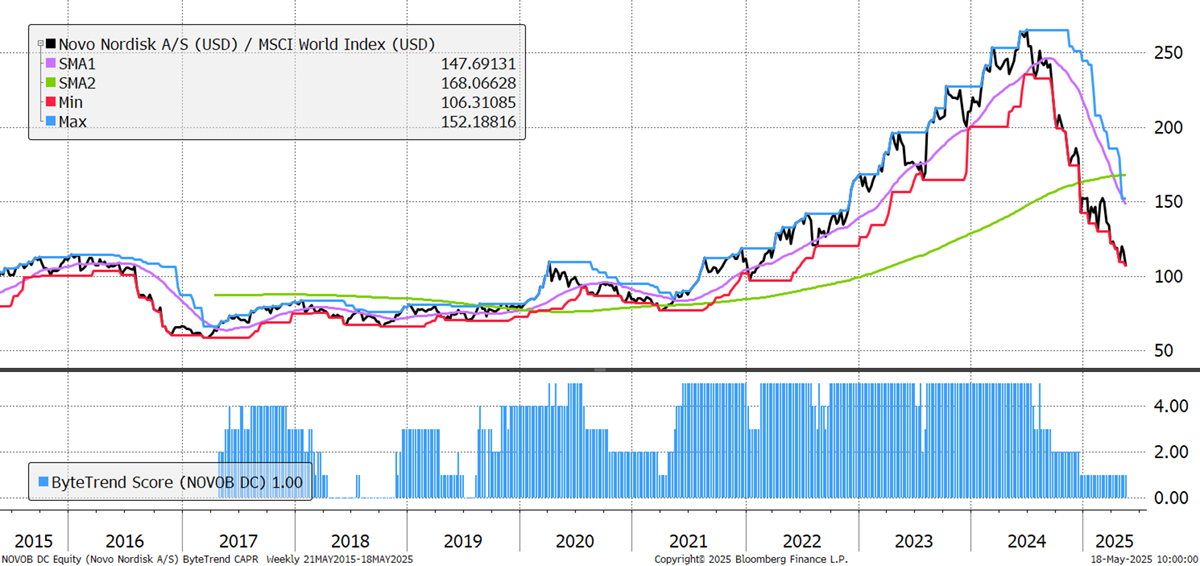
| NOVO-B | DKK | Novo Nordisk | 1 | -46 | 0 | 54 | 281 | Health | Biotech |
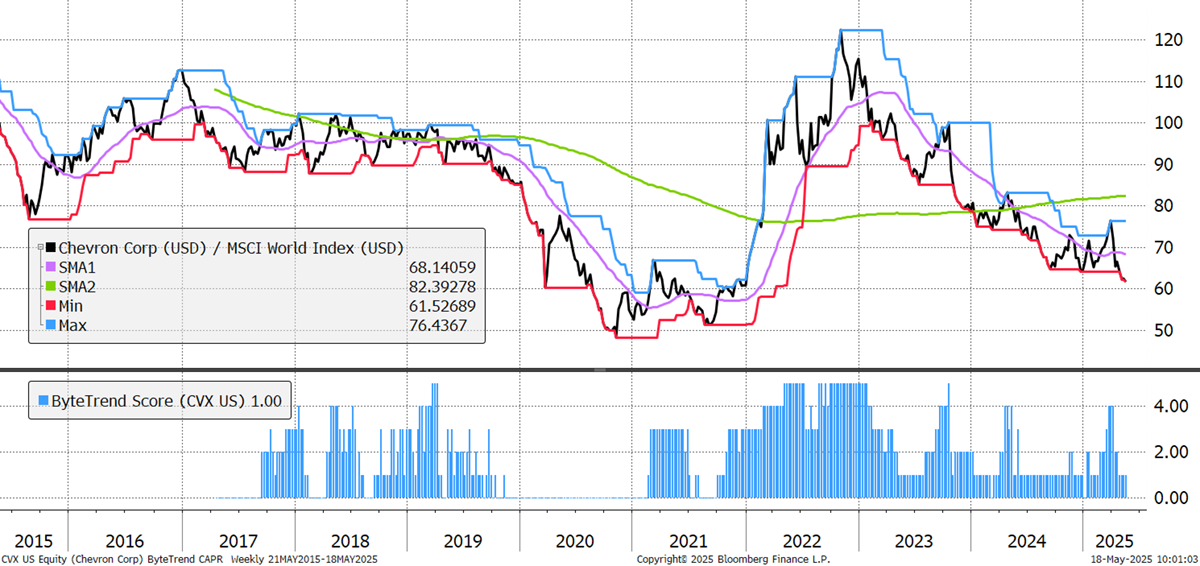
| CVX | USD | Chevron | 1 | -20 | 0 | 28 | 248 | Energy | O&G Int |
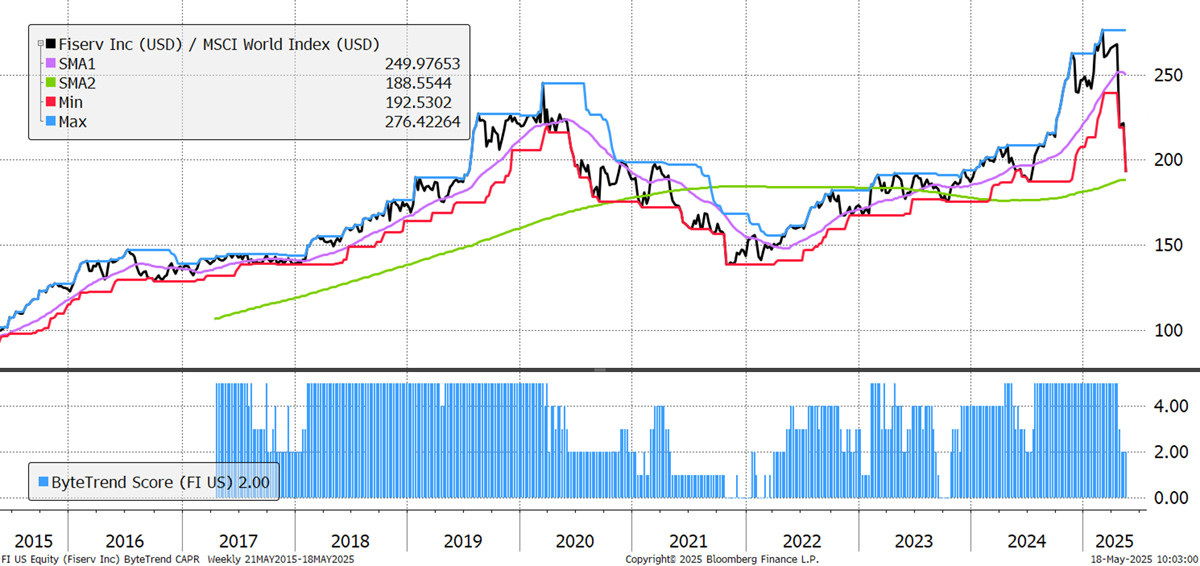
| FI | USD | Fiserv | 2 | -30 | 0 | 34 | 92 | Tech | IT |
| 2082 | SAR | ACWA POWER | 2 | -40 | 0 | 31 | 57 | Utility | Power prod |
| SLB | USD | Schlumberger | 1 | -21 | 0 | 37 | 49 | Energy | O&G Serv |
| SU | CAD | Suncor Energy | 1 | -16 | 0 | 30 | 44 | Energy | O&G Int |
| FANG | USD | Diamondback | 1 | -27 | 0 | 43 | 41 | Energy | O&G Exp |
Energy remains weak and is dominating this section. The oil price is languishing at $65 and seems unsustainably low, but Chinese electrification threatens the long-term pace of global oil demand growth.
Chevron is highlighted, but the picture is similar across most companies in the sector. It is cutting 15–20% of its global workforce (up to 8,000 jobs) by the end of 2026 to achieve $2–$3 billion in cost savings. The layoffs are mostly affecting U.S. operational staff, with buyouts offered through spring 2025. Operationally, Chevron began oil and gas production from its Ballymore project in the Gulf of Mexico in April 2025, advancing its goal to boost Gulf production to 300,000 barrels per day by 2026.
Chevron
Novo Nordisk has ousted its CEO as results worsen and the shares slump. How the mighty have fallen. Once valued at over 18x its annual sales, it’s now worth “just” 6.5x. Its GFC low point was 3.0x EV/Sales. Its capex has surged from 6% of sales to 17%, massively impacting cash flow generation, both current and forecast. It has lowered its revenue growth guidance to 13–21% due to intensifying competition in the U.S., and President Trump has publicly called out the extreme cost of its products there. The shares are down 57% in roughly one year.
Novo Nordisk
In a market recovery this strong, Fiserv stands out, and not in a good way. Cash flow has collapsed, and the analyst downgrades are coming in thick and fast. In its Q1 2025 results, adjusted EPS was up 14%, driven by margin expansion across both Merchant and Financial Solutions segments. Lower free cash flow and ongoing macroeconomic and competitive risks are concerns, and the stock declined after the release due to investor concerns over the pace of future growth.
Fiserv Inc
There are 21 additional weakening trends in the GTI universe. It is nice to see a shorter list. More energy stocks feature, as does Turkish Airlines, Bangkok Bank, and Dick’s Sporting Goods.
Bear Trends
These stocks are trading at the 30-week CAPR lows with a ByteTrend Score of 0. They are in a downtrend. All charts shown are CAPR rebased to 100.
| Ticker | FX | Name | Score CAPR | % Dev from CAPR 30W High | % Dev from CAPR 30W Low | Annual. Vol. 30w | MCap Bn USD | Sector | Industry |
|---|---|---|---|---|---|---|---|---|---|
| MC | EUR | LVMH | 0 | -27 | 0 | 30 | 281 | Con Cycl | Luxury |
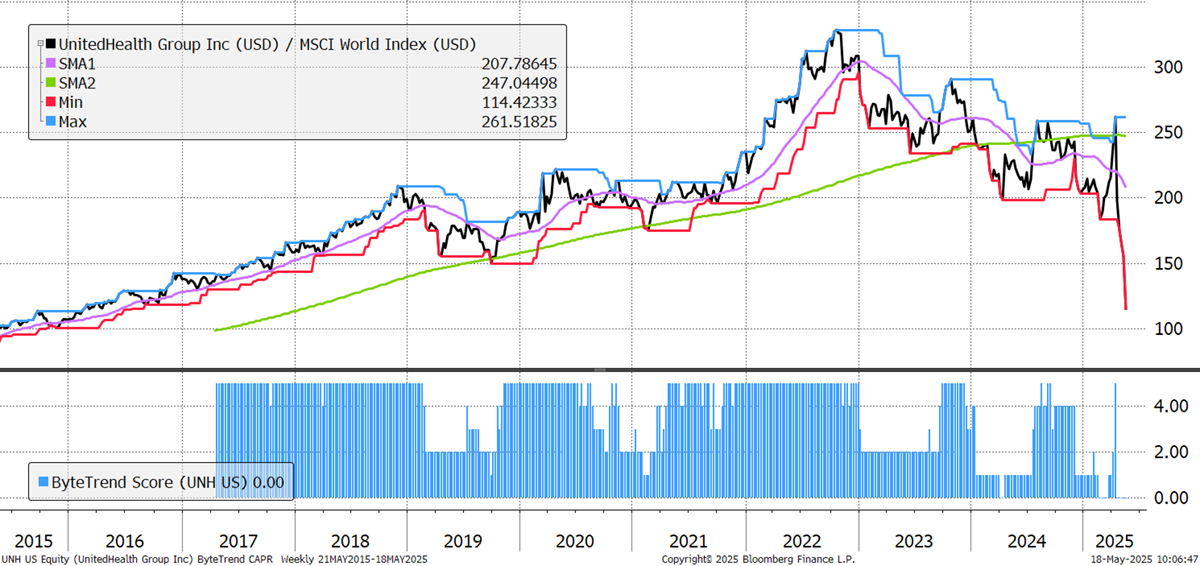
| UNH | USD | UnitedHealth Group | 0 | -56 | 0 | 57 | 265 | Health | Med Plans |
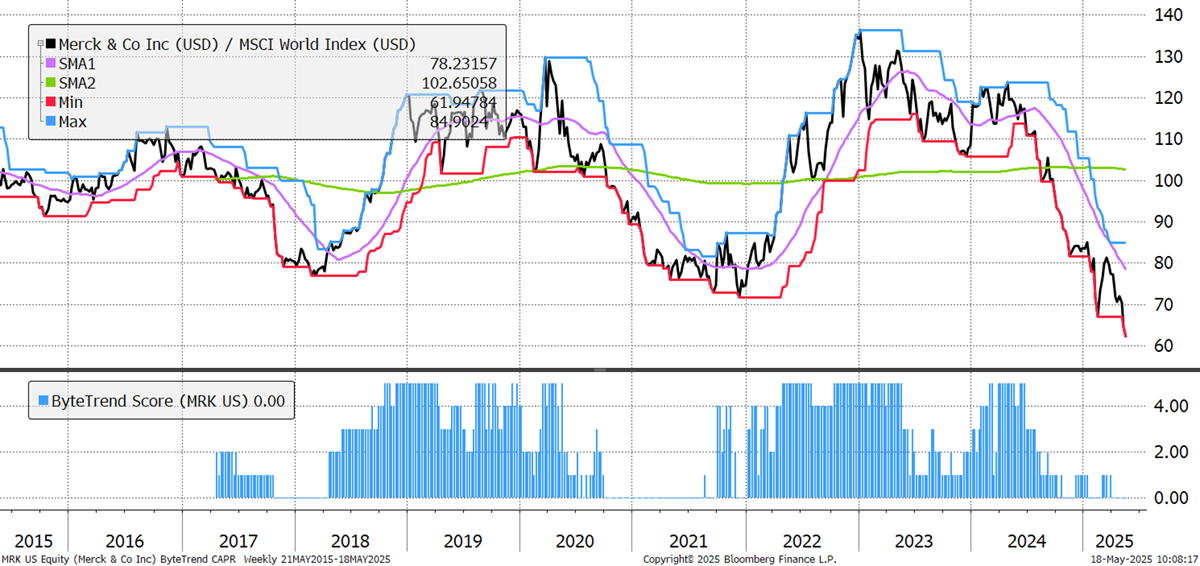
| MRK | USD | Merck & | 0 | -30 | 0 | 31 | 191 | Health | Drug Makers |
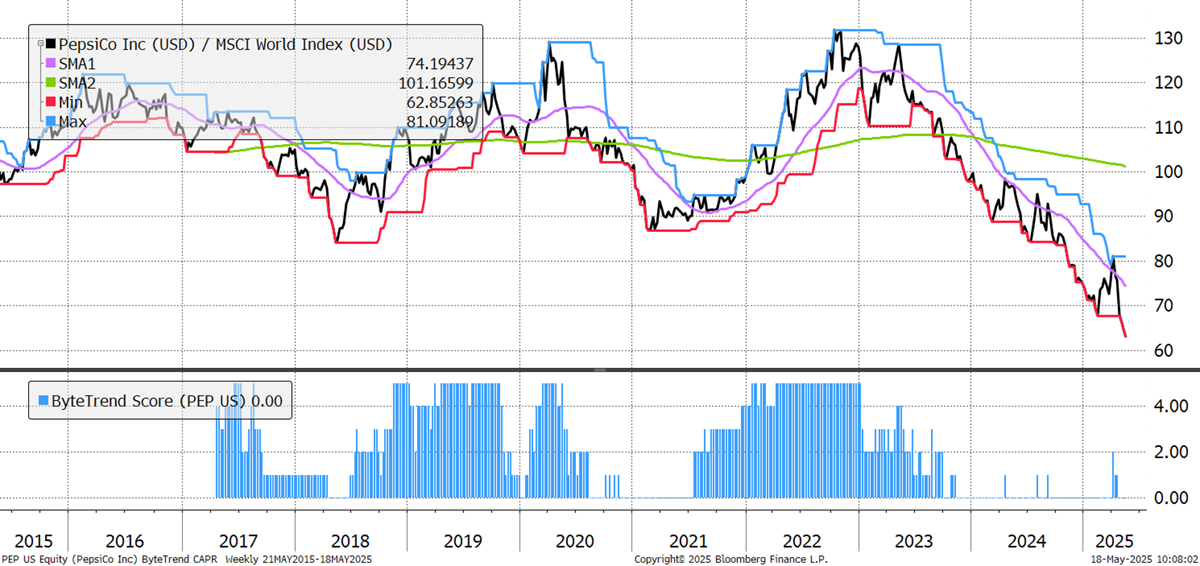
| PEP | USD | PepsiCo | 0 | -26 | 0 | 20 | 181 | Con Disc | Soft Drinks |
| TMO | USD | Thermo Fisher | 0 | -32 | 0 | 27 | 156 | Health | Med Diag |
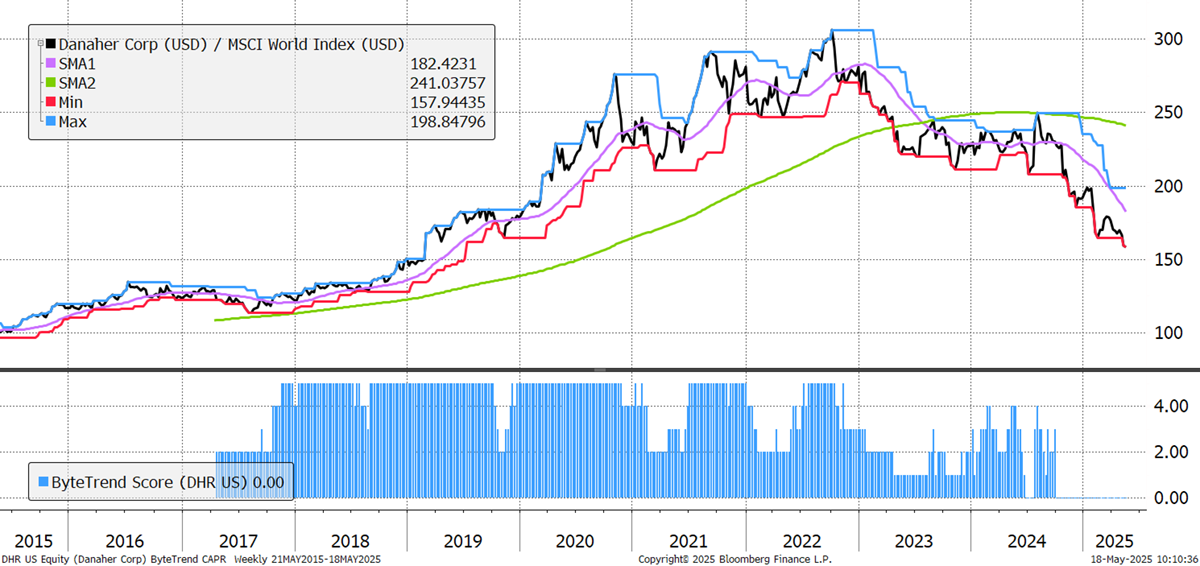
| DHR | USD | Danaher | 0 | -25 | 0 | 31 | 140 | Health | Med Diag |
| PFE | USD | Pfizer | 0 | -23 | 0 | 26 | 130 | Health | Drug Makers |
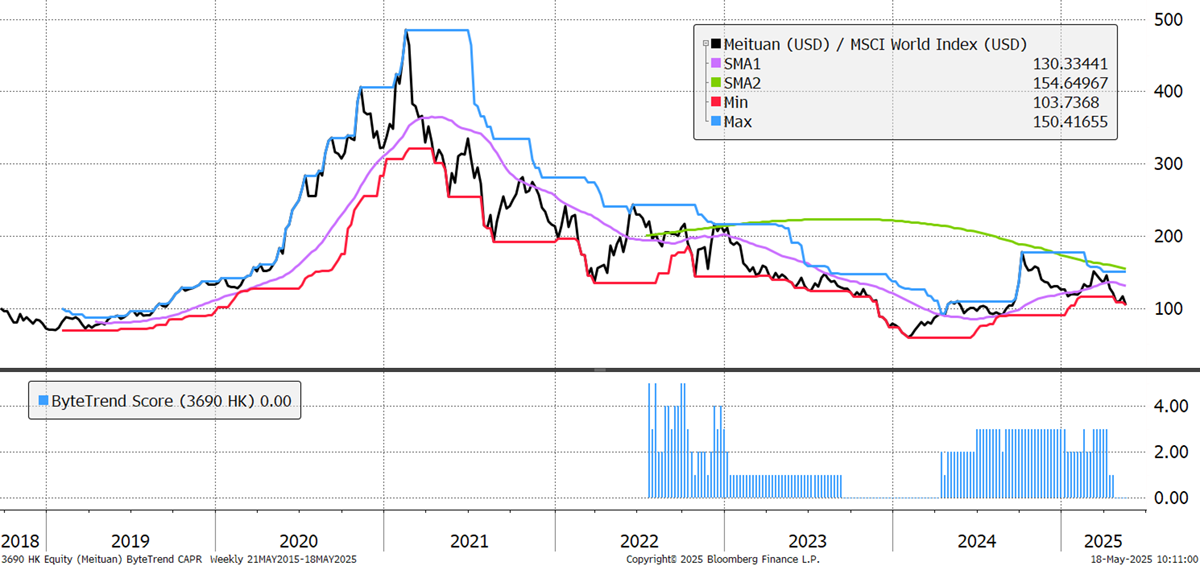
| 3690 | HKD | Meituan | 0 | -34 | 0 | 40 | 106 | Con Cycl | Spec Retail |
| BMY | USD | Bristol-Myers Sq | 0 | -27 | 0 | 31 | 95 | Health | Drug Makers |
| 386 | HKD | Ch Petrochem | 0 | -16 | 0 | 16 | 91 | Energy | O&G Int |
| CSL | AUD | CSL Limited | 0 | -23 | 0 | 22 | 75 | Health | Biotech |
| ITW | USD | Illinois Tool Works | 0 | -11 | 0 | 23 | 74 | Indust | Ind Mach |
| APD | USD | Air Products | 0 | -18 | 0 | 29 | 62 | Materials | Special Chem |
| MRK | EUR | Merck KGaA | 0 | -27 | 0 | 21 | 56 | Health | Spec Drugs |
| 6030 | HKD | CITIC Securities | 0 | -22 | 0 | 42 | 52 | Finance | Cap Mkts |
| 9618 | HKD | JD.com | 0 | -26 | 0 | 38 | 49 | Con Cycl | Spec Retail |
This is a rare chart pattern. UnitedHealth featured as an emerging trend not long ago, but swiftly turned as the company slashed its 2025 profit forecast by 12%, citing unexpectedly high medical costs in its Medicare Advantage plans. This triggered a 22% single-day drop, which has continued as it was followed by CEO Andrew Witty’s abrupt resignation and the suspension of its 2025 financial outlook.
UnitedHealth
Quality stocks are suffering, and Pepsi is a standout casualty. It recently cut its 2025 profit forecast, now expecting a 3% decline in core earnings per share, citing sharply higher supply chain costs from new U.S. and global tariffs, especially on Irish soda concentrate and packaging materials. The company’s Q1 earnings missed expectations for the first time in five years, as consumer spending weakened and snack promotions failed to boost demand. Pepsi is well into its third year of underperformance.
PepsiCo
Pharmaceuticals, another Quality sector, are facing the full force of Trump’s war on drug prices. Pfizer and Bristol Myers also feature on this list, but we focus on Merck. A 41% drop in Gardasil vaccine sales, largely due to reduced demand and halted shipments to China, has impacted it in 2025. It also lowered its full-year outlook, citing $200 million in new tariff costs and missing analyst expectations for total revenue guidance. Keytruda, its flagship drug, continues to grow, but not fast enough to placate the market.
Merck & Co
Another high-quality industrial stock, Danaher, continues to struggle. Returns on invested capital used to be solidly double-digit pre-2008; now they are mid-single-digit, and have fallen notably since 2022, which is visible in the CAPR chart below. Flat core revenue in Q1 2025, with earnings per share falling 2%, is a continuation of a longer-term malaise. Sales have been weak in China due to changes in diagnostic procurement, and it faces an estimated $350 million tariff impact too.
Danaher Corp
Once a Chinese internet darling, Meituan is a long way from its Covid bubble peak. Sales growth has declined but is still strong in absolute terms at 20% YoY. Meanwhile, returns on invested capital have steadily turned from negative to strongly positive, and it trades on 1.9x EV/Sales compared to over 20x at its peak. Perhaps there’s a brighter future ahead, but the CAPR chart says not yet.
Meituan
There are 137 additional bear trends in the GTI universe. The list is dominated by energy and healthcare. There are also more luxury stocks, such as Porsche, Kraft Heinz, and Kering.
Outlook
The market is strong and has seen a broad-based recovery. Of the big tech companies, only Microsoft has a ByteTrend score of 5, making this significantly different from what we have become used to. Financials may not have made many CAPR highs last week, but their trends remain strong, alongside utilities and communications. Consumer defensives (Quality) have turned down, and we suspect many of these are simply overvalued after years of good returns. Healthcare is under attack, and hopefully, there will be bargains to be found there in due course.
GTI: Region and Sector Analysis
But it’s not only healthcare. Seeing stocks like PepsiCo turn down alongside luxury goods and other branded goods companies is notable. These are supposed to be the must-own stocks, but they trade at high valuations without delivering sufficient growth. As the title says, Quality Slumps.
Thanks for reading GTI. Please leave your feedback in the comments section below.


