
Surge in Global Equity Breadth


Issue 48;
- Surge in Leading Trends.
- Rotation continues as mega-caps feel the pressure.
- Contrarians should have a look at UK REITs.
Global Trends is a deep dive into global equities. The aim of this analysis is to better understand which countries, sectors, industries, and stocks are driving market returns. Not only does it help investors identify opportunities, but it also highlights the risks. We try to condense as much important information as possible, focusing on what really matters each week. Embrace this as a weekly discipline, and you’ll soon have a much better understanding of global financial markets.
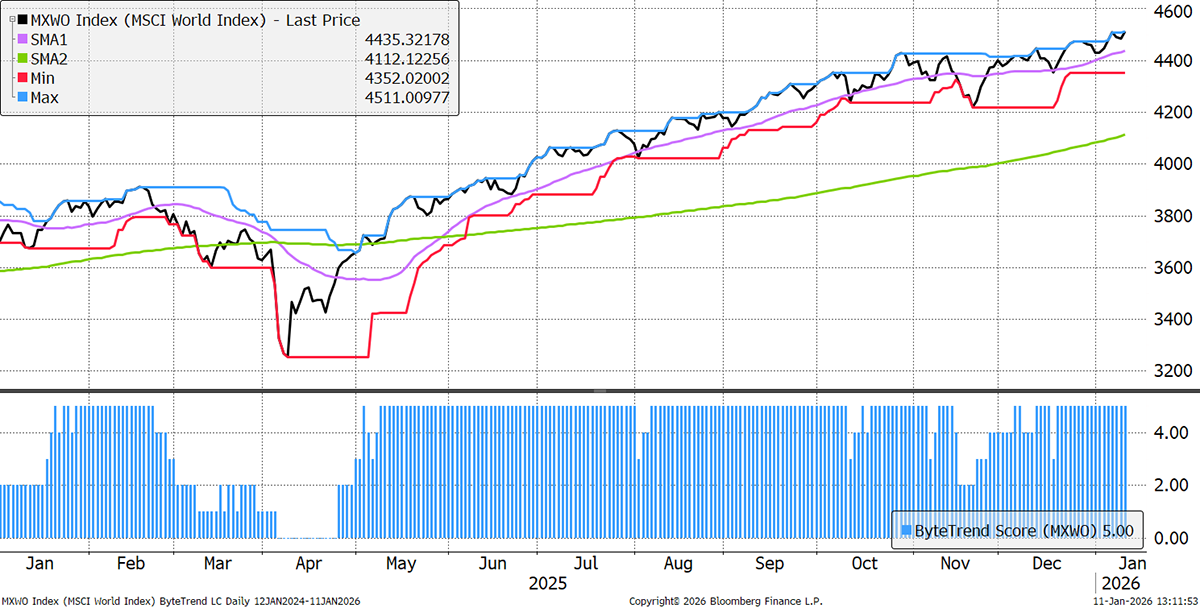
The World Index retains a ByteTrend Score of 5 and makes another all-time high.
World Index – Developed Markets – Daily
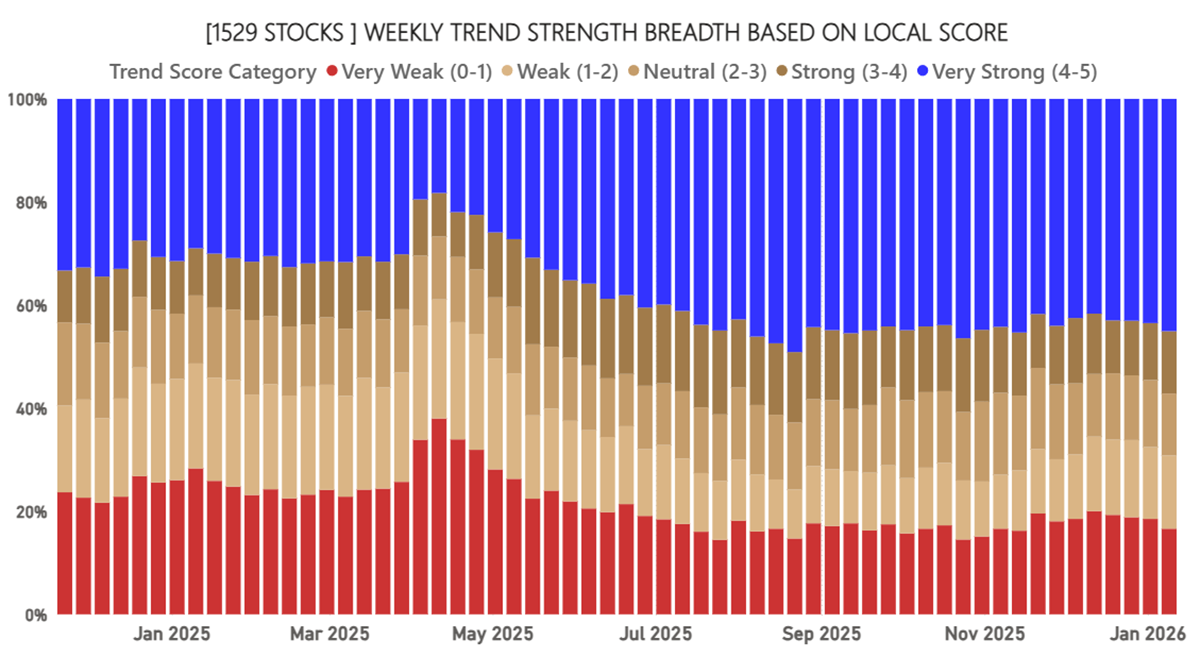
Market Breadth
Market breadth has improved, and global equities are looking strong. The number of stocks in bullish trends (blue) with ByteTrend Scores of 5 has risen, while the bear trends (red), with ByteTrend scores of 0, have retreated. This is a function of the mega-caps now lagging the market.
The top 10 stocks, Saudi Aramco excepted, saw Alphabet and Taiwan Semi make CAPR highs with a ByteTrend Score of 5. Microsoft has a score of 1 and is 18% below its CAPR high, making a 30-week low this week. META is down 23% in CAPR. NVIDIA is weaker too, with a score of 3. Apple fell from a 5 to a 3 last week. This list is collectively sliding from the dizzy heights reached in 2025. Berkshire Hathaway is in a bear trend.
Top Ten Stocks
| Name | ByteTrend Score in CAPR | % Dev from CAPR 30W High | % Dev from CAPR 30W Low |
| NVIDIA Corporation | 3 | -11 | 11 |
| Alphabet Inc. | 5 | 0 | 70 |
| Apple Inc. | 3 | -10 | 15 |
| Microsoft Corporation | 1 | -18 | 0 |
| Amazon.com, Inc. | 5 | -3 | 11 |
| Meta Platforms, Inc. | 2 | -23 | 3 |
| Broadcom Inc. | 4 | -16 | 19 |
| Tesla, Inc. | 5 | -10 | 31 |
| Taiwan Semiconductor | 5 | 0 | 33 |
| Berkshire Hathaway Inc. | 0 | -11 | 2 |
Source: GTI 200 Spreadsheet
As alpha shifts from these stocks, worth $30 trillion (or 26% of the world’s total market cap) to the rest of the world, expect to see high breadth in CAPR terms. We are seeing it in both CAPR and local currency. This stockmarket is well underpinned.
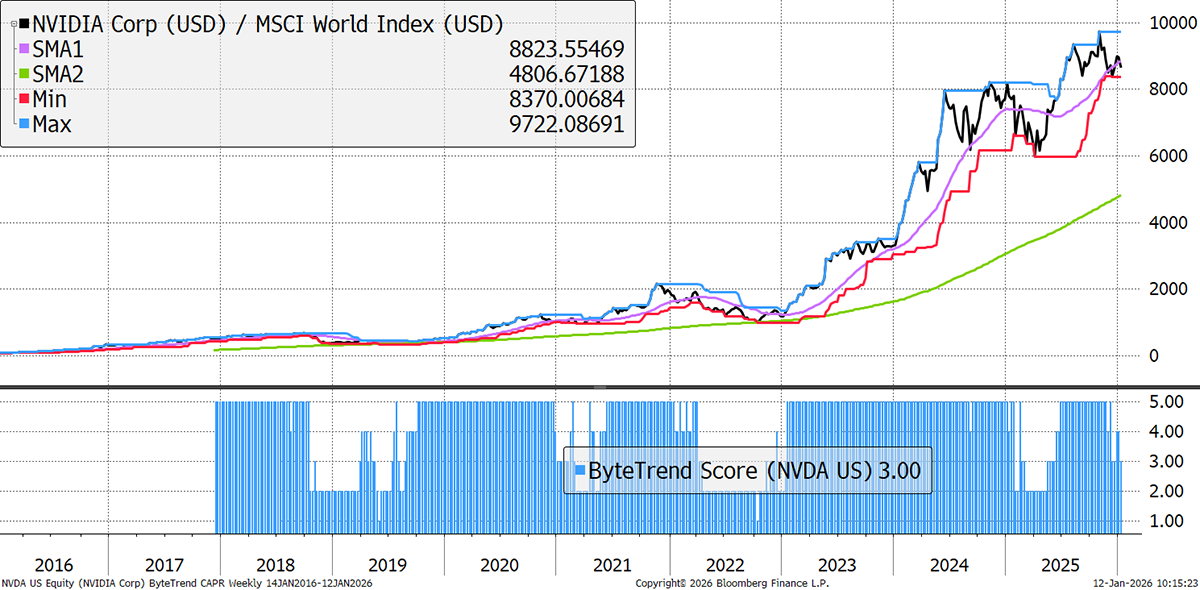
NVIDIA
This market darling now has a ByteTrend Score of 3 in CAPR terms. Alpha generation since June 2024 is slight. Sooner or later, investors will take note and shift exposure to new investment ideas.
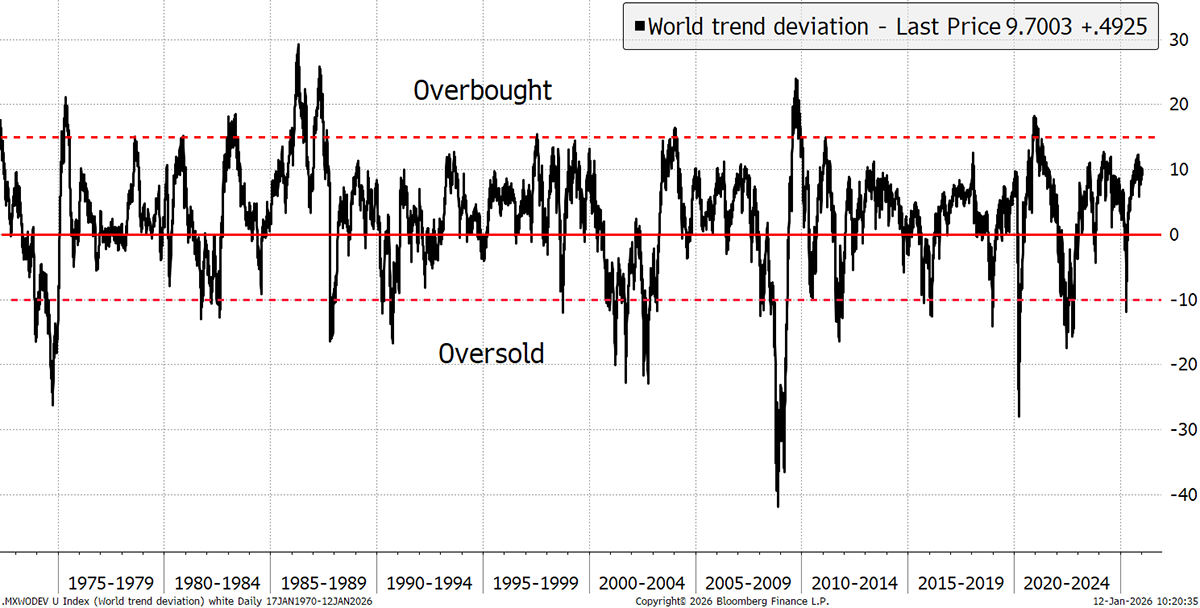
Are Equities Overbought?
Markets can have too much of a good thing, and when the market becomes overbought, a reversal becomes likely. The World Index trades 9.7% above its 200-day moving average, which is remarkably calm for this well-established bull market.
Global Equities Deviation from the 200-Day Moving Average
Surge in Bullish Trends
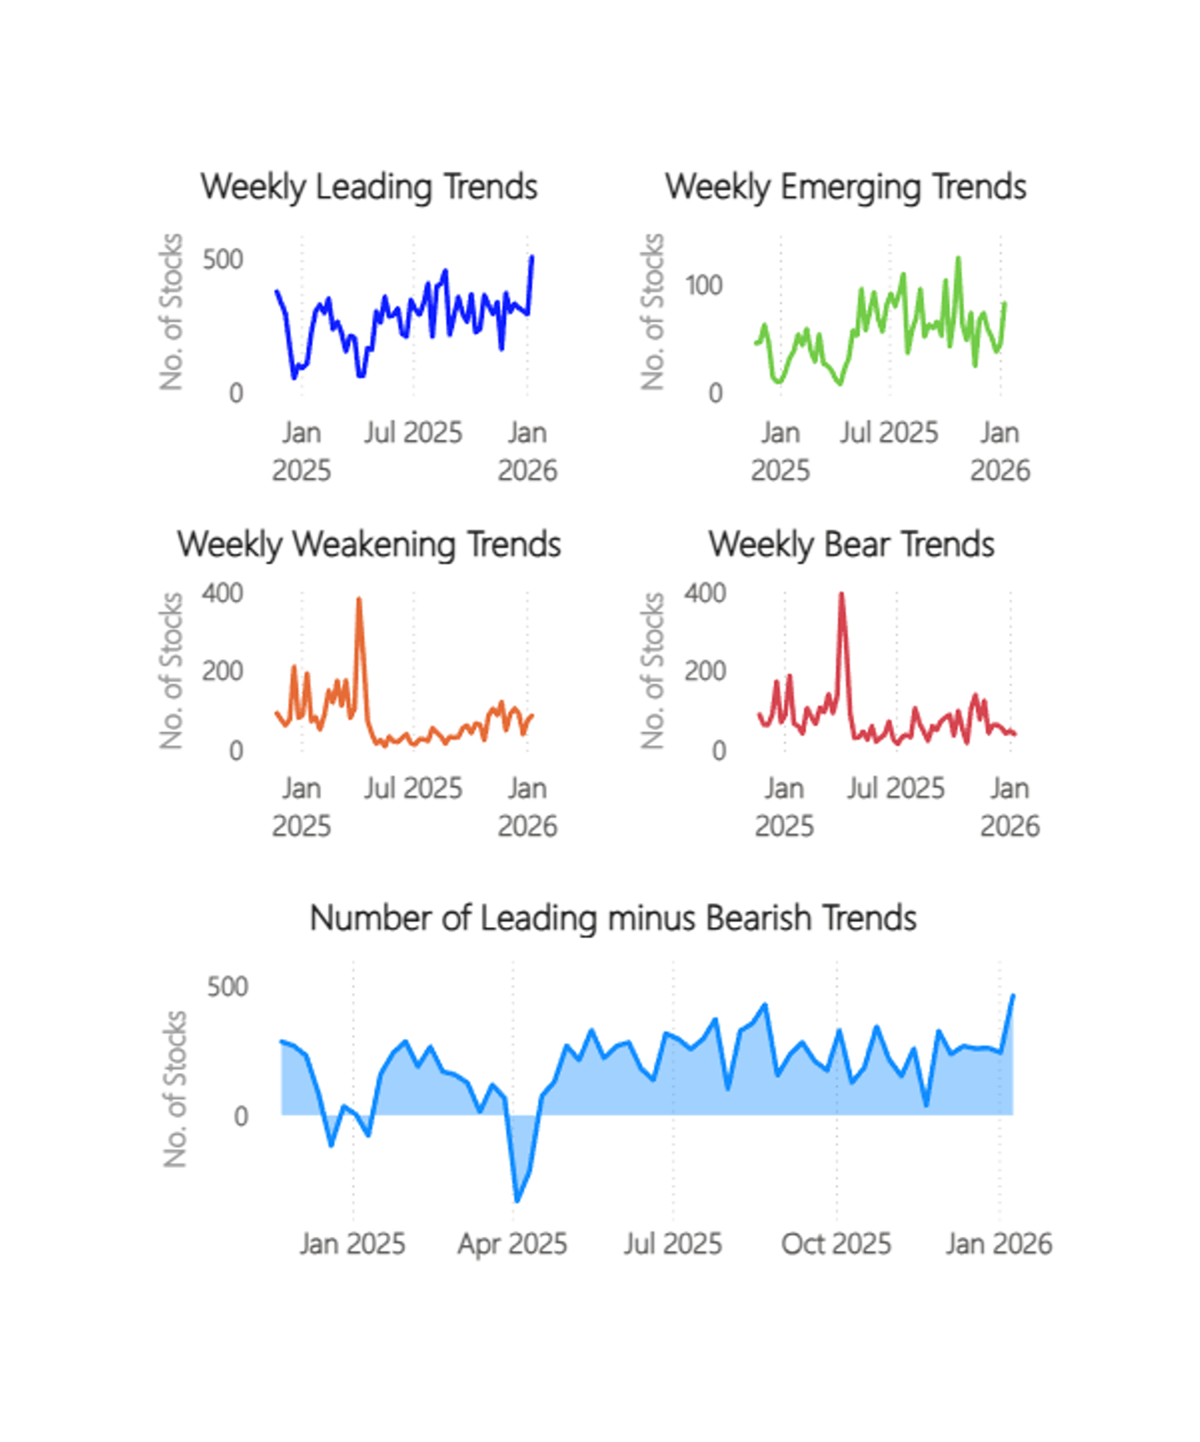
In local price terms, there was a boom in leading trends last week, with a decent uptick in emerging trends. In contrast, there were few bear trends but a few more weakening trends as the market rotation bites. The lower chart shows the leading trends minus bearish trends; this is a new high since we started tracking this data.
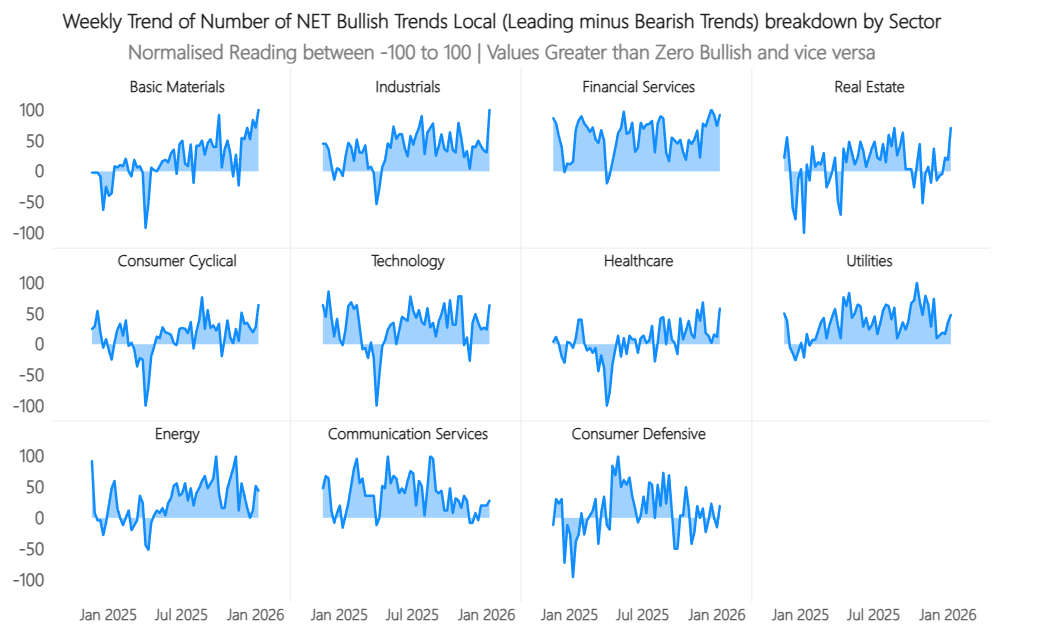
Net Bullish Trends by Sector
These trends have come from across the board, but the sectors are ranked left to right and top to bottom, strongest to weakest. Basic Materials and Industrials lead convincingly, with Real Estate as the newcomer. This is important because it had previously been a weak sector.
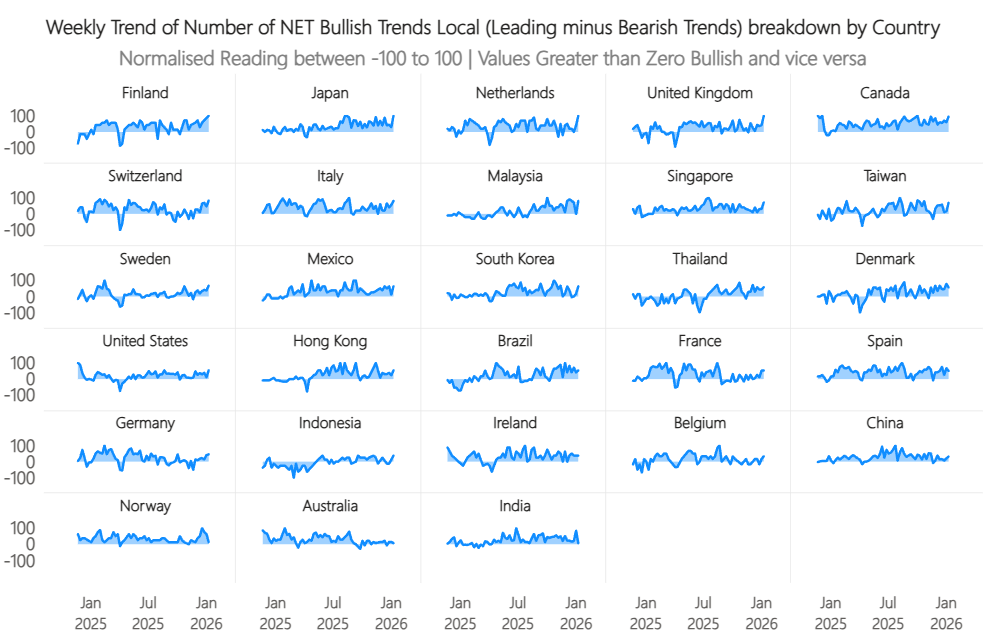
Net Bullish Trends by Country
By country, these bullish trends were more concentrated, led by Europe. Finland stands out, which is a country that is held in high regard at ByteTree. Japan also stood tall along with the Netherlands, the UK, Canada, Switzerland, and Malaysia. Five of those seven countries mentioned are positions held in ByteTree’s Multi-Asset Investor. Australia and India are on the sidelines, lagging the world.
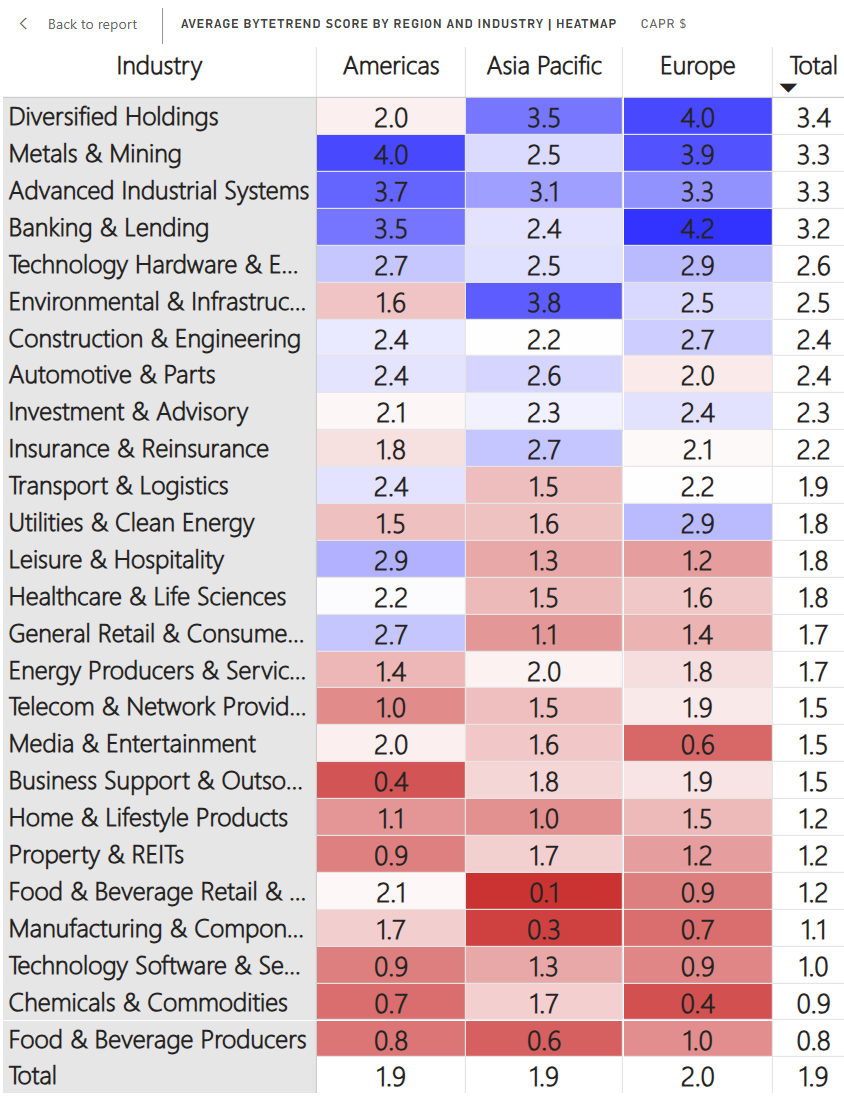
Regions and Industries Average CAPR Score
In the Americas, Manufacturing and Components companies are rising strongly off extreme lows, with companies like Stanley Black & Decker, International Paper, and Avery Dennison showing strength.
In Europe, REITs have jumped, with 37 stocks making 30-week highs last week. Six came from the USA, four from Japan, six from the EU and Switzerland, with a notable 13 from the UK. The driver was most likely the fall in the 10-year gilt yield.
Software is weak as AI investment prefers to focus on the data centres (hardware) for now. However, hardware is more vulnerable to the capital cycle of overinvestment and overcapacity, overshooting into a disappointing demand picture. AI is exciting, but the tech trend has slowed outside of semiconductors and has dropped to the bottom of the list.
Food and Beverage producers also sit at the bottom of the list. This is a defensive sector in a bull market, which keeps interest low, and it is the most obvious victim of the boom in GLP-1 (anti-obesity drug) stocks. Add to that the post-inflation hangover, where all their products rose in price a little too much for consumers to bear, and it has been a tough 24 months for the Food & Beverage sector.
The Value Composite Score (Value) is measured against the company’s own financial history and not in absolute terms. The columns are Cheap (Chp), Value (Val), Fair Value (FV), Overvalued (OV), and Expensive (Exp). The Growth Composite Score (Growth) is measured by sales, earnings cash flow, dividends, and book value on a per share basis. The columns are High, Good, Medium (Med), Low, and Negative (Neg).
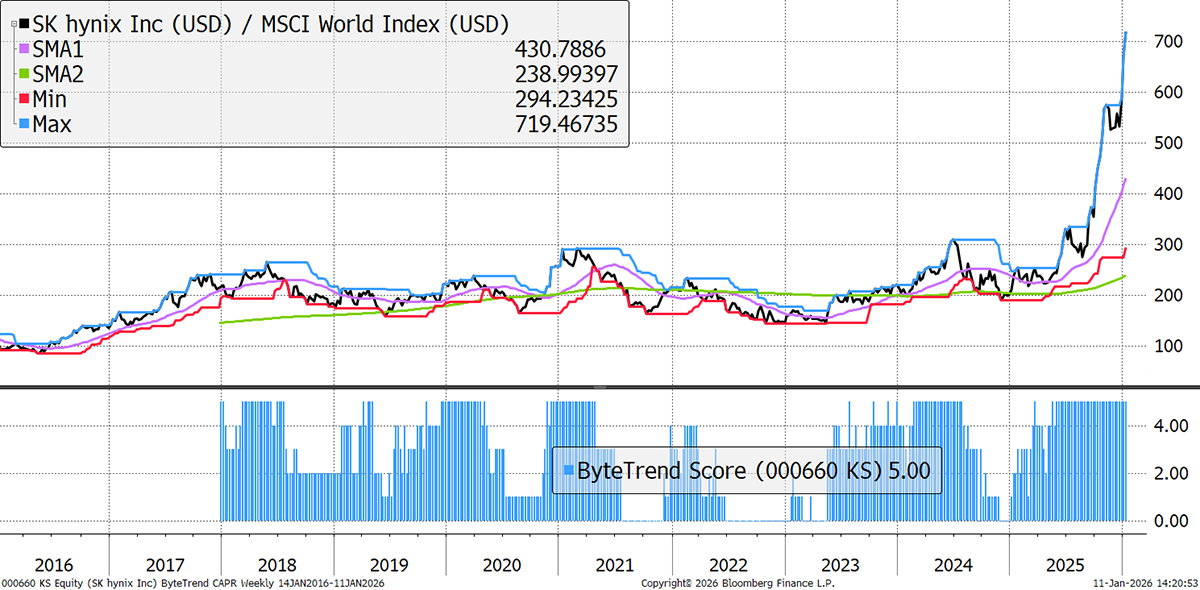
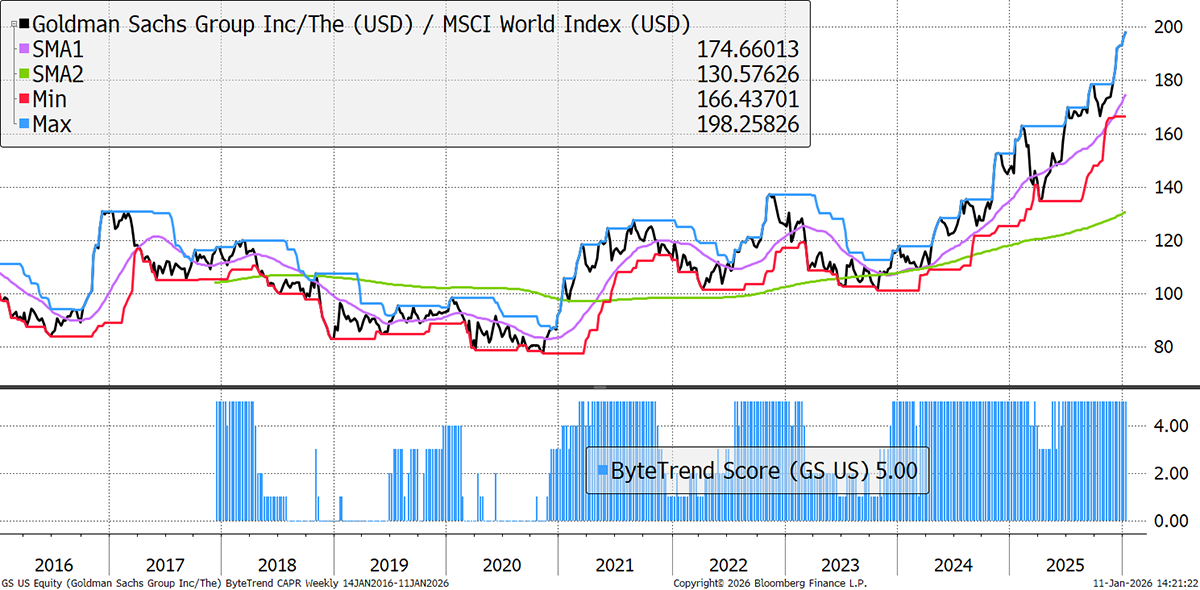
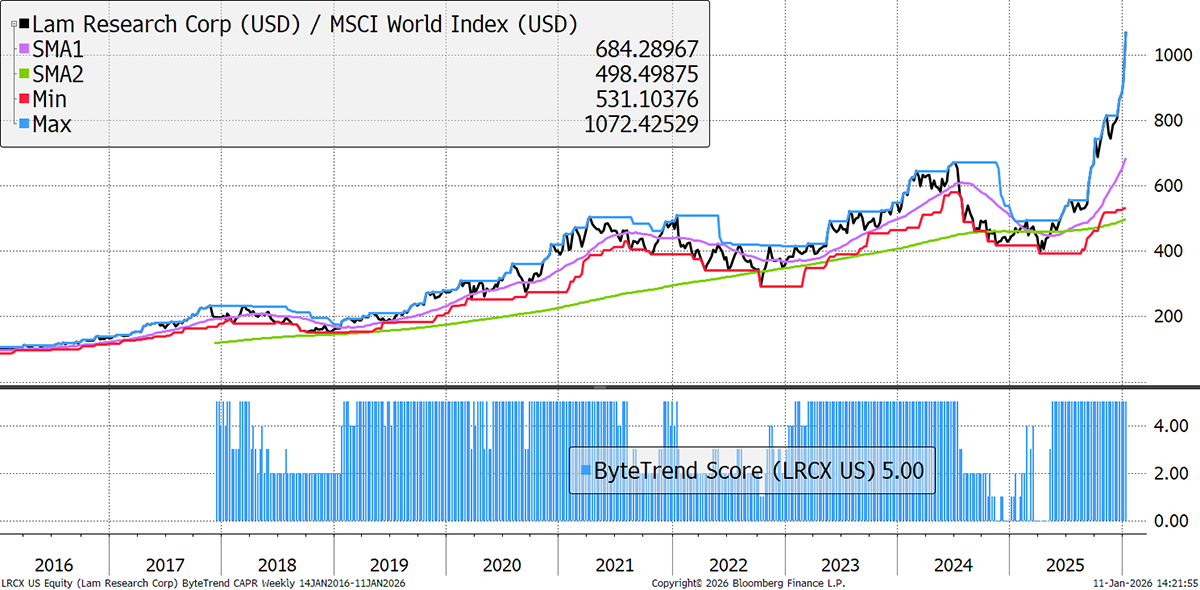
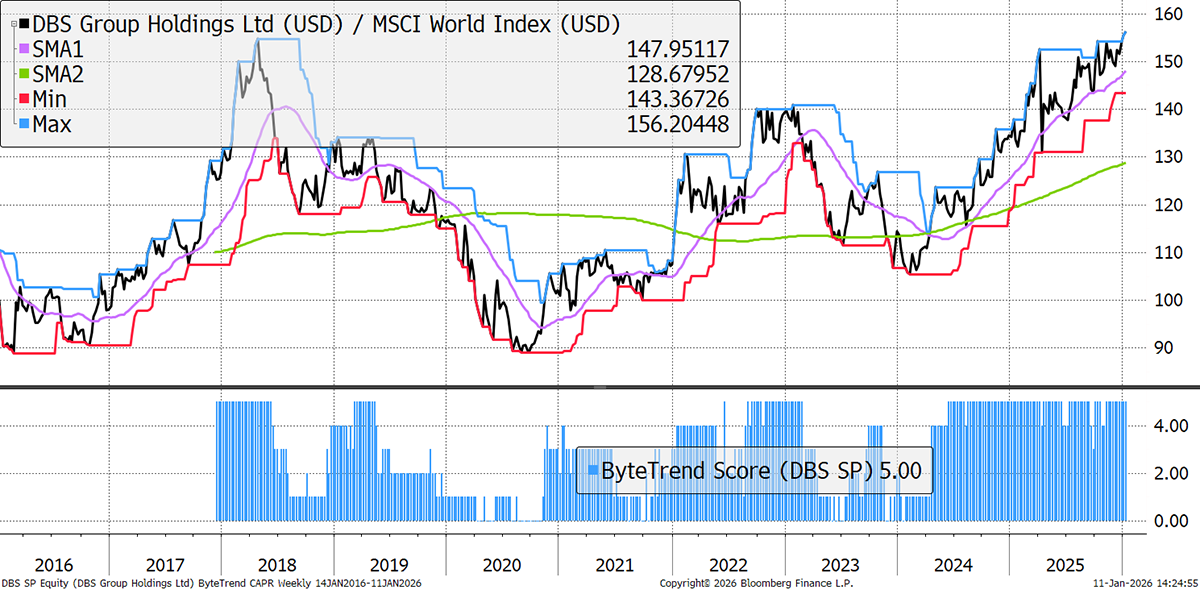
Leading Trends with New Highs
These stocks are trading at the 30-week CAPR highs with a ByteTrend Score of 5. All charts shown are CAPR rebased to 100.
| Name | 360-Day Vol | Mkt Cap $Bn | Value | Growth |
| Alphabet Inc. | 29 | 3965 | OV | Good |
| Taiwan Semiconductor Manufacturing | 22 | 1378 | OV | High |
| JPMorgan Chase & Co. | 18 | 896 | OV | Good |
| Samsung Electronics Co., Ltd. | 33 | 638 | Exp | Good |
| ASML Holding N.V. | 40 | 491 | OV | Med |
| Micron Technology, Inc. | 58 | 386 | Exp | Low |
| SK hynix Inc. | 55 | 352 | Exp | High |
| Morgan Stanley | 19 | 296 | OV | Good |
| The Goldman Sachs Group, Inc. | 21 | 295 | OV | Good |
| Caterpillar Inc. | 28 | 289 | Exp | Good |
| Lam Research Corporation | 43 | 274 | Exp | Good |
| Novartis AG | 20 | 273 | FV | Med |
| Applied Materials, Inc. | 40 | 240 | Exp | Med |
| Citigroup Inc. | 23 | 226 | OV | Med |
| KLA Corporation | 35 | 184 | Exp | Good |
| China Life Insurance Company | 34 | 181 | OV | Good |
| UBS Group AG | 24 | 152 | OV | Good |
| Analog Devices, Inc. | 33 | 149 | OV | Med |
| Rolls-Royce Holdings plc | 26 | 143 | Exp | Good |
| Southern Copper Corporation | 38 | 139 | OV | Low |
| Zijin Mining Group Company | 40 | 130 | Exp | High |
| Sumitomo Mitsui Financial | 26 | 128 | OV | High |
| DBS Group Holdings Ltd | 16 | 127 | OV | High |
| Siemens Energy AG | 34 | 125 | Exp | High |
| Newmont Corporation | 36 | 119 | OV | Neg |
| Parker-Hannifin Corporation | 21 | 118 | Exp | Good |
| Investor AB (publ) | 14 | 113 | OV | Good |
| Mizuho Financial Group, Inc. | 28 | 98 | OV | High |
| Agnico Eagle Mines Limited | 34 | 95 | OV | High |
| Marriott International, Inc. | 27 | 88 | OV | High |
| CRH plc | 30 | 88 | OV | Med |
| Howmet Aerospace Inc. | 24 | 88 | Exp | High |
| Mitsui & Co., Ltd. | 22 | 87 | OV | Med |
| Barrick Gold Corporation | 37 | 82 | OV | Good |
| Grupo México, S.A.B. de C.V. | 34 | 79 | OV | Neg |
| Cummins Inc. | 23 | 76 | OV | High |
| Western Digital Corporation | 54 | 70 | Exp | Neg |
| Engie S.A. | 17 | 67 | OV | High |
| Rocket Companies, Inc. | 49 | 66 | Exp | Neg |
| Seagate Technology Holdings plc | 50 | 65 | Exp | Neg |
| Manulife Financial Corporation | 15 | 63 | OV | Med |
| PACCAR Inc | 25 | 62 | OV | High |
| Ross Stores, Inc. | 20 | 62 | OV | Med |
| CMOC Group Limited | 54 | 60 | OV | High |
| Wheaton Precious Metals Corp. | 31 | 57 | Exp | Low |
| Suncor Energy Inc. | 23 | 56 | FV | High |
| Holcim Ltd | 36 | 55 | OV | Med |
| JAPAN POST BANK Co., Ltd. | 24 | 52 | OV | Med |
| Hyundai Motor Company | 50 | 52 | OV | High |
| HeidelbergCement AG | 30 | 48 | Exp | Good |
| Delta Air Lines, Inc. | 32 | 47 | FV | High |
| Cameco Corporation | 42 | 47 | Exp | High |
| AngloGold Ashanti Plc | 43 | 46 | Exp | High |
| Antofagasta plc | 35 | 46 | Exp | Neg |
| ASSA ABLOY AB (publ) | 17 | 44 | FV | Good |
| Sumitomo Corporation | 19 | 43 | OV | High |
| Sandvik AB (publ) | 17 | 43 | OV | Med |
| Carnival Corporation & plc | 40 | 42 | OV | High |
SK Hynix
South Korea is the fourth-strongest country in average CAPR score terms, and SK Hynix, one of its largest memory chip manufacturers, was part of the reason why. It became a client of Nvidia and the hyperscalers, while NAND and DRAM (memory chips) prices rose. Milestones like completing HBM4 development for 2026 mass production and breakthroughs in next-gen chips drove investor enthusiasm further.
Goldman Sachs
The global investment banking giant is enjoying President Trump’s second term. Fees from M&A advisory and underwriting surged as deal volumes recovered sharply, fuelled by lower interest rates, deregulatory hopes, and pent-up corporate activity. It led the banking league tables in major transactions, and policy volatility and AI enthusiasm supported its trading revenues.
LAM Research
Data centre giants like Nvidia and TSMC poured billions into new factories to churn out next-gen chips (e.g. 2-nanometre technology), and they needed Lam's etch and deposition tools more than ever. In simple terms, the company sells high-tech machines that carve and stack tiny circuits onto silicon wafers; the core step in making advanced chips for phones, servers, and AI systems.
DBS Bank
DBS dominates Southeast Asian banking, with the top market share in Singapore (over 40% of deposits/loans) and growing footprints in high-growth markets such as Indonesia, India, and China. It is particularly strong in digital banking, and wealth advisory fees were strong in 2025 as Asia’s growing millionaire class continued to expand. AUM grew 18% YoY in Q3, making it the envy of Western peers.
New Leading Trends
These stocks are trading at the 30-week CAPR highs with a ByteTrend Score of 5, except they are new trends this week, having previously had a score below 5. All charts shown are CAPR rebased to 100.
| Name | 360-Day Vol | Mkt Cap $Bn | Value | Growth |
| Ping An Insurance China | 24 | 174 | FV | Med |
| Fast Retailing Co | 34 | 122 | OV | Good |
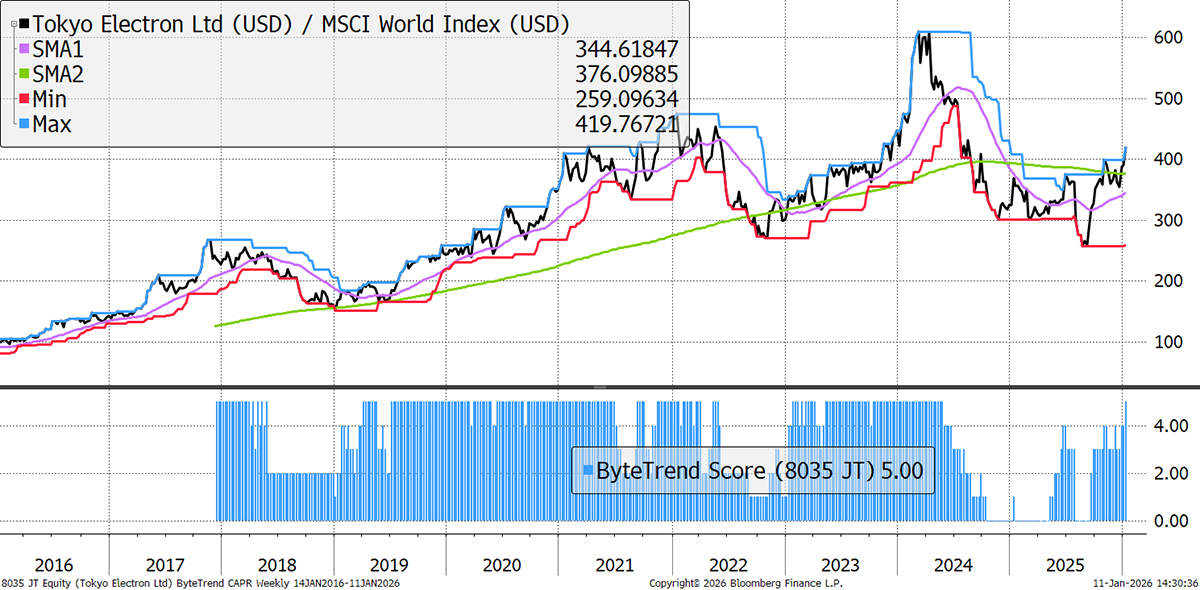
| Tokyo Electron Limited | 52 | 110 | Exp | Good |
| Hanwha Aerospace Co | 59 | 43 | Exp | High |
Tokyo Electron
Japanese semiconductor leader Tokyo Electron generates 90% of its revenues abroad, so the weak yen materially reduces its earnings. It also has high exposure to China (40% of sales), where tariffs and bans have increased uncertainty. It has tripled sales of its advanced packaging (next-gen chip construction) to ¥30bn over the last two years, making it a key growth driver in an important market.
Emerging Trends
These stocks are trading at the 30-week CAPR highs with a ByteTrend Score of less than 5. They don’t have to be in an uptrend, just emerging. All charts shown are CAPR rebased to 100.
| Name | 360-Day Vol | Mkt Cap $Bn | Value | Growth |
| Roche Holding AG | 30 | 339 | FV | Neg |
| Merck & Co., Inc. | 32 | 278 | FV | High |
| Intel Corporation | 64 | 217 | FV | Neg |
| BHP Group Limited | 22 | 162 | OV | Neg |
| Safran S.A. | 18 | 155 | OV | High |
| Lockheed Martin | 25 | 127 | FV | Low |
| Bristol-Myers Squibb | 25 | 114 | Val | Low |
| GSK plc | 23 | 102 | FV | Low |
| Atlas Copco AB | 23 | 94 | FV | Med |
| U.S. Bancorp | 22 | 86 | FV | Med |
| Freeport-McMoRan Inc. | 44 | 81 | OV | Neg |
| FedEx Corporation | 29 | 74 | FV | Med |
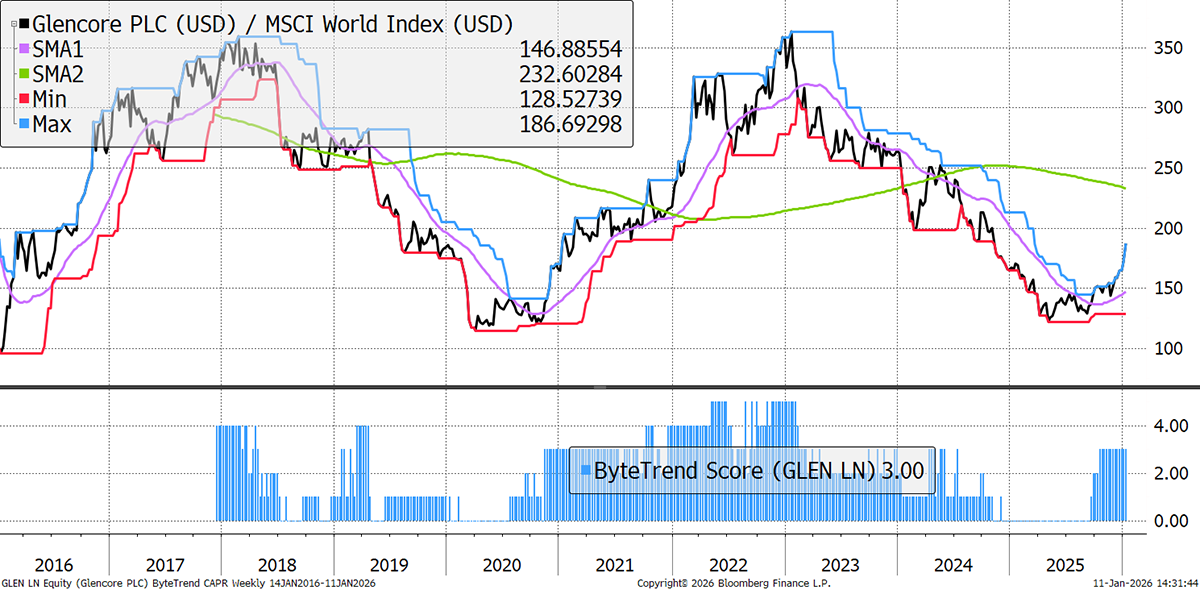
| Glencore plc | 31 | 72 | Exp | Neg |
| SLB N.V. | 38 | 68 | FV | High |
| Merck KGaA | 28 | 65 | Val | Neg |
| L3Harris Technologies, Inc. | 20 | 63 | OV | Low |
| Vale S.A. | 18 | 59 | OV | Neg |
| Ford Motor Company | 36 | 56 | FV | Med |
| Anglo American plc | 32 | 46 | Exp | Neg |
| Bayer AG | 35 | 44 | Val | Neg |
| Franco-Nevada Corporation | 31 | 44 | OV | Good |
| IQVIA Holdings Inc. | 44 | 41 | FV | Med |
| The Estée Lauder Companies Inc. | 39 | 41 | OV | Neg |
| RWE AG | 20 | 41 | OV | High |
| GE HealthCare Technologies Inc. | 28 | 40 | FV | Med |
Glencore
The Glencore-Rio Tinto mega-deal is back on the menu. GLEN surged 10% on the news, adding to what was already a strong run in 2025. As discussed, the metals rally is broadening beyond gold and silver, into copper, a large contributor to Glencore. Its battery metals portfolio (zinc, cobalt, nickel) is benefitting too, while coal production is strong, offsetting weaker prices. The deal would make the entity a top-three global copper producer. There is a February 5 deadline in the UK for Rio to submit a formal bid or withdraw.
Weakening
These stocks are trading at the 30-week CAPR lows with a ByteTrend Score above 0. They are weakening trends but not yet downtrends. All charts shown are CAPR rebased to 100. Microsoft
| Name | 360-Day Vol | Mkt Cap $Bn | Value | Growth |
| Microsoft Corporation | 17 | 3562 | OV | Med |
| Netflix, Inc. | 28 | 379 | FV | Good |
| T-Mobile US, Inc. | 24 | 224 | OV | High |
| Shell plc | 15 | 202 | FV | Good |
| Commonwealth Bank of Australia | 22 | 171 | OV | Good |
| AT&T Inc. | 16 | 170 | FV | Neg |
| Eaton Corporation plc | 23 | 126 | Exp | Good |
| Xiaomi Corporation | 34 | 126 | OV | High |
| Spotify Technology S.A. | 36 | 110 | FV | High |
| Trane Technologies plc | 21 | 85 | OV | Good |
| Bank of Communications Co., Ltd. | 17 | 82 | FV | Low |
| Dell Technologies Inc. | 39 | 81 | OV | Neg |
| Münchener Rückversicherungs-Gesellschaft | 17 | 79 | OV | Med |
| Johnson Controls International plc | 23 | 73 | Exp | Med |
| Republic Services, Inc. | 15 | 66 | OV | Good |
| Cloudflare, Inc. | 42 | 64 | OV | High |
| Wesfarmers Limited | 20 | 62 | OV | High |
| Aflac Incorporated | 17 | 59 | OV | Med |
| Roblox Corporation | 48 | 50 | FV | Low |
| Swiss Re AG | 20 | 47 | OV | High |
| Hess Corporation | 12 | 46 | ||
| Deutsche Börse AG | 20 | 45 | FV | High |
| Strategy Inc | 51 | 45 | Exp | Neg |
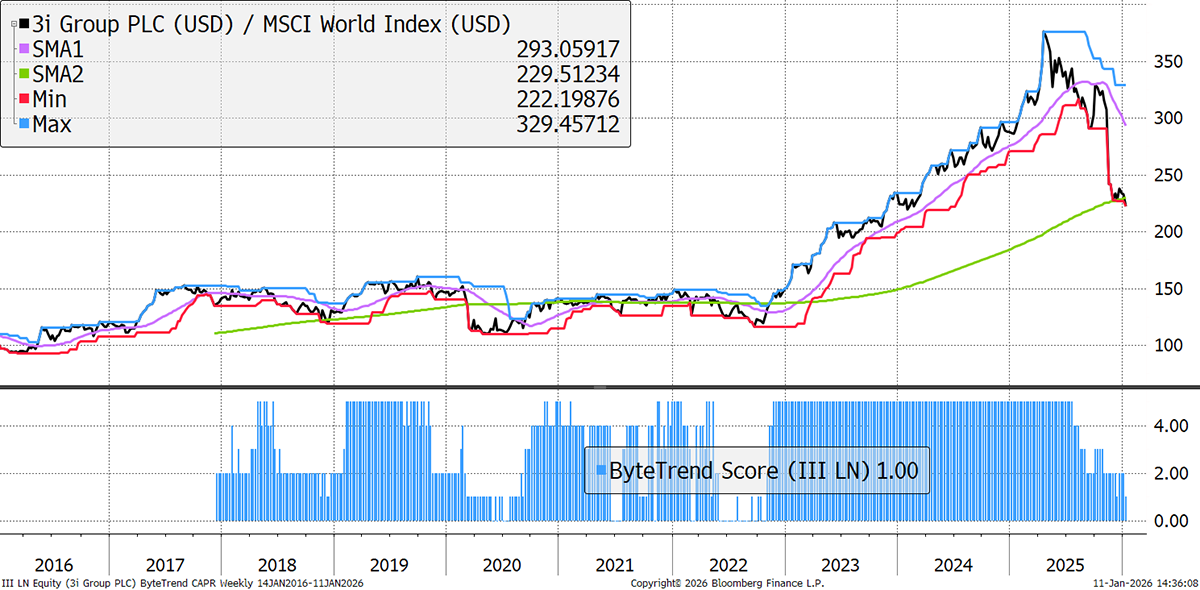
| 3i Group plc | 36 | 41 | FV | Good |
| Coca-Cola Europacific Partners PLC | 18 | 41 | FV | Good |
III Plc
There is trouble in retail, especially in Europe, following AB Foods’ profit warning over its Primark business. III was a diversified holding company, but it is now 80% dominated by Action, a European non-food multi-category retailer that focuses on the low-end of the price curve. Action operates 3,000 stores in 12 countries, with €11.3bn of sales in FY2025. However, slowing growth dented investor confidence last year, and its high premium to NAV (60%) has disappeared.
Bear Trends
These stocks are trading at the 30-week CAPR lows with a ByteTrend Score of 0. They are in a downtrend. All charts shown are CAPR rebased to 100.
| Name | 360-Day Vol | Mkt Cap $Bn | Value | Growth |
| Saudi Arabian Oil Company | 14 | 1525 | Val | Med |
| The Procter & Gamble Company | 13 | 332 | FV | Med |
| Nestlé S.A. | 25 | 242 | FV | Low |
| Abbott Laboratories | 16 | 219 | FV | Med |
| PepsiCo, Inc. | 19 | 191 | FV | Med |
| HDFC Bank Limited | 14 | 160 | Val | High |
| Sony Group Corporation | 30 | 148 | OV | Good |
| ServiceNow, Inc. | 29 | 147 | Val | High |
| BYD Company Limited | 31 | 114 | Val | High |
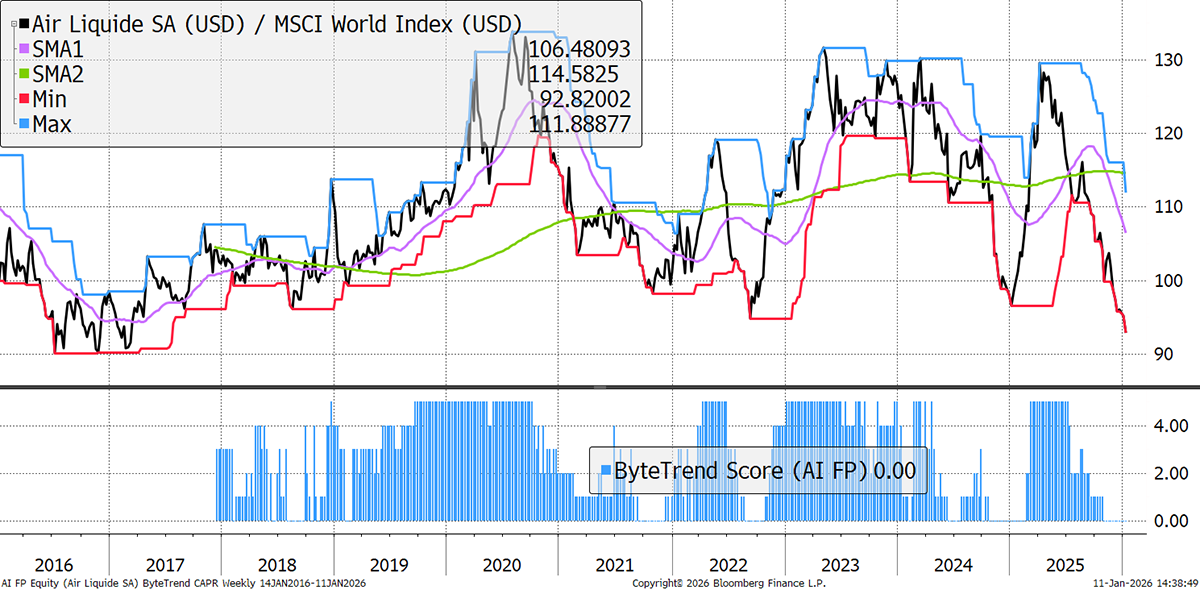
| L'Air Liquide S.A. | 12 | 107 | OV | Med |
| Enbridge Inc. | 13 | 100 | FV | High |
| CME Group Inc. | 16 | 95 | FV | Med |
| Duke Energy Corporation | 12 | 91 | FV | Med |
| NTT, Inc. | 14 | 84 | Exp | Neg |
| American Tower Corporation | 20 | 79 | Val | Med |
| Meituan | 37 | 76 | Chp | High |
| Nintendo Co., Ltd. | 37 | 75 | OV | Neg |
| Postal Savings Bank of China Co., Ltd. | 21 | 69 | FV | Low |
| Canadian Pacific Kansas City Ltd. | 17 | 66 | FV | Med |
| Deutsche Post AG | 63 | FV | Neg | |
| Fortinet, Inc. | 41 | 61 | Exp | High |
| Autodesk, Inc. | 27 | 59 | Val | Good |
| Saudi Telecom Company | 14 | 57 | FV | High |
| CSL Limited | 40 | 56 | Chp | Good |
| Workday, Inc. | 27 | 55 | Chp | Good |
| PayPal Holdings, Inc. | 29 | 54 | Chp | Good |
| Compass Group PLC | 16 | 53 | FV | Good |
| Constellation Software Inc. | 33 | 51 | FV | Good |
| Dominion Energy, Inc. | 17 | 50 | FV | Neg |
| Universal Music Group N.V. | 25 | 47 | Val | Good |
| Kotak Mahindra Bank Limited | 19 | 47 | Val | High |
| ITC Limited | 21 | 47 | FV | Good |
| Roper Technologies, Inc. | 16 | 47 | Val | High |
| Kuwait Finance House K.S.C.P. | 12 | 45 | FV | High |
| Datadog, Inc. | 51 | 44 | Val | High |
| Exelon Corporation | 15 | 44 | OV | Med |
| Waste Connections, Inc. | 15 | 43 | FV | Med |
| Coupang, Inc. | 34 | 42 | FV | Good |
| Saudi Basic Industries Corporation | 22 | 41 | FV | Neg |
| American International Group, Inc. | 25 | 41 | FV | Neg |
Air Liquide
FX weakness (USD exposure) was enough to put revenue growth into negative territory in Q3, with notable weakness in Europe and Asia, as well as in hydrogen and helium. Having reached a record set of valuation multiples in mid-2025, there was no room for error.
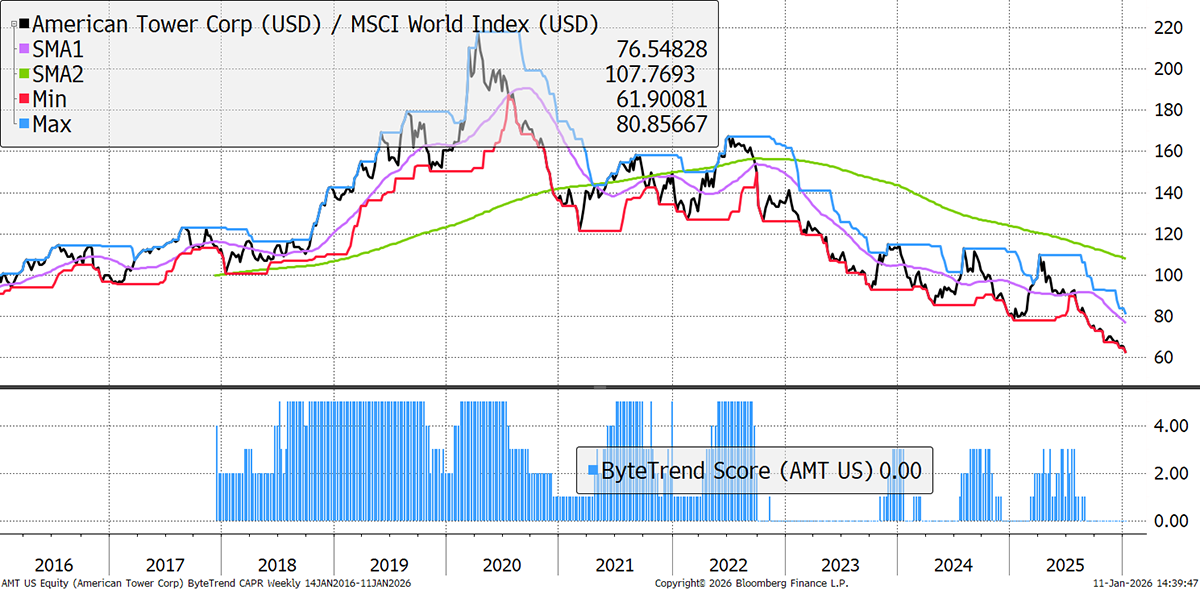
American Tower
American Tower is a REIT focused on global wireless infrastructure. It rose 15x during the 210s bull market before reaching record valuation levels in 2021. It is embroiled in a legal case against Dish Wireless, which drags on, and 5G growth has slowed as higher rates deterred investment.
GTI 200 Spreadsheet
We are pleased to share the GTI 200 spreadsheet. Download the spreadsheet below to view the CAPR and local currency scores, and more, for the world’s largest 200 stocks. Have a look at the different groups and the main list “All stocks”. The Insights tab is interesting, and don’t forget to expand the columns by clicking on the “+” at the top of the page if you want to see more trend data.
Outlook
This is a bullish market being fed by the rotation out of the mega-cap concentration, which is probably the largest concentration in the history of stockmarkets. There has been a notable surge in bullish trends, which underpins price levels. The strength in REITs perhaps shows confidence in bond markets, especially in the UK. Who’d have thought?
Thanks for reading GTI.


