Issue 3;
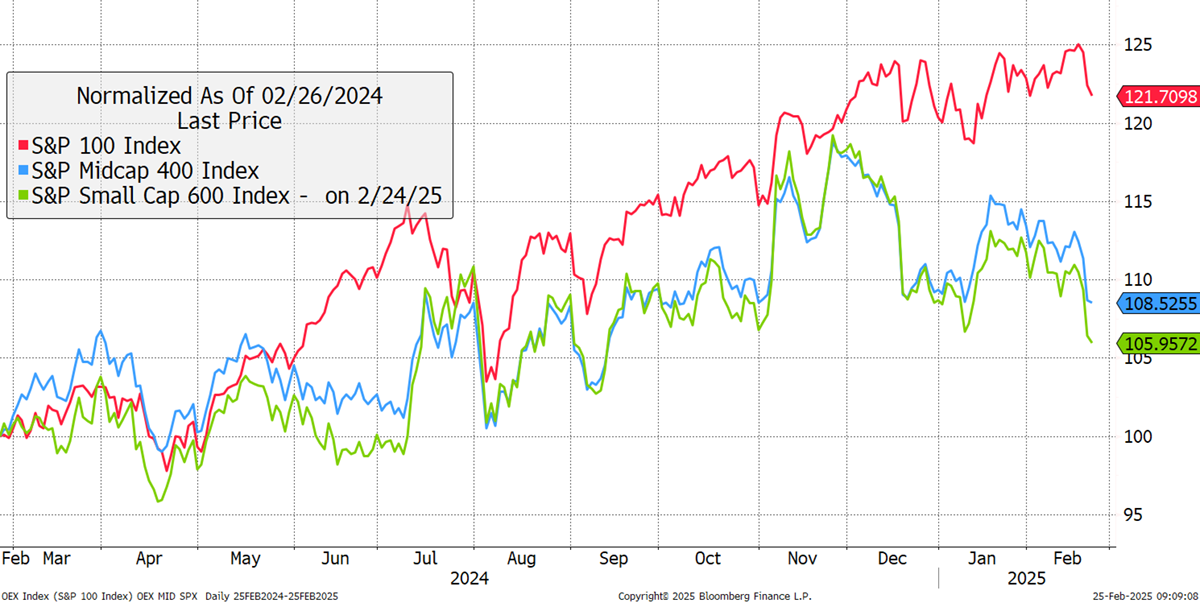
The great rotation is here, and that is why it is such an important time to launch GTI. It is well known that the largest US companies have done well, but spare a thought for the mid and small caps. I show that over the past year, but note how they were in line in late November.
US Mega, Mid and Small Cap Indices
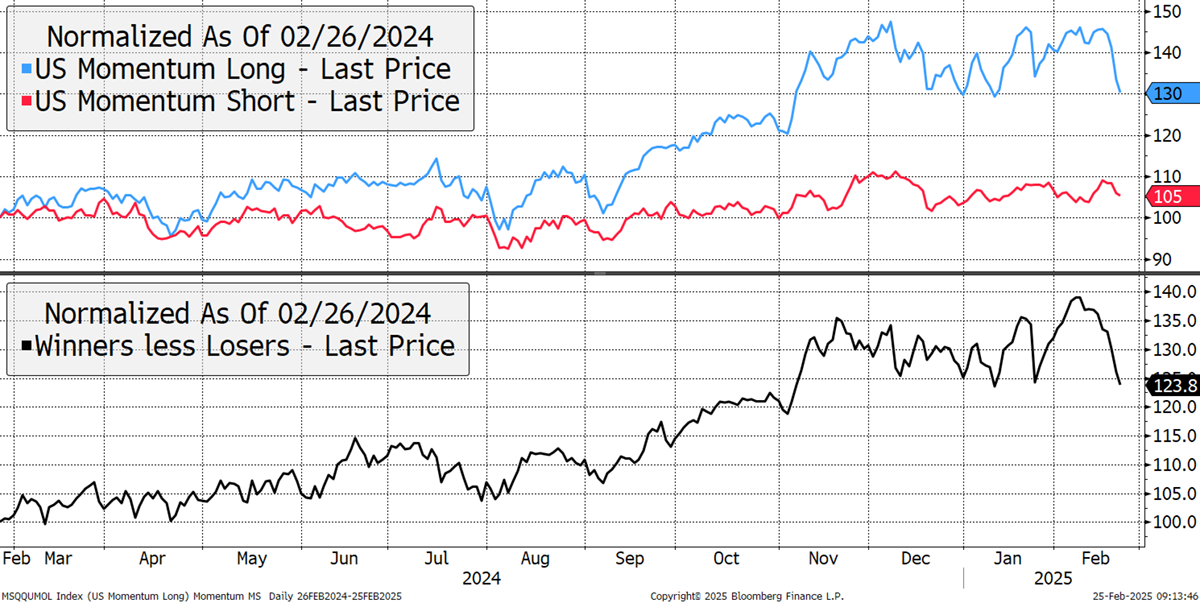
The story is better told through momentum than market cap, which captures the current disparity more accurately. The blue past winners, the stocks that were already doing well, surged higher in November on the Trump trade and are now giving background. The red losers are stable, which indicates we are looking at a market rotation of leadership as opposed to a bear market at this point in time. The lower black line shows winners less losers and appears to have broken.
US Momentum Winners vs Losers – Past Year
That black line over 25 years has risen with a trend rate of 4.3% p.a. It is currently at the top of the range and signalling a reversal. It is impossible to say whether the correction will be mild or severe, but it is very likely underway.
US Momentum Winners Relative to Losers – Past 25 Years
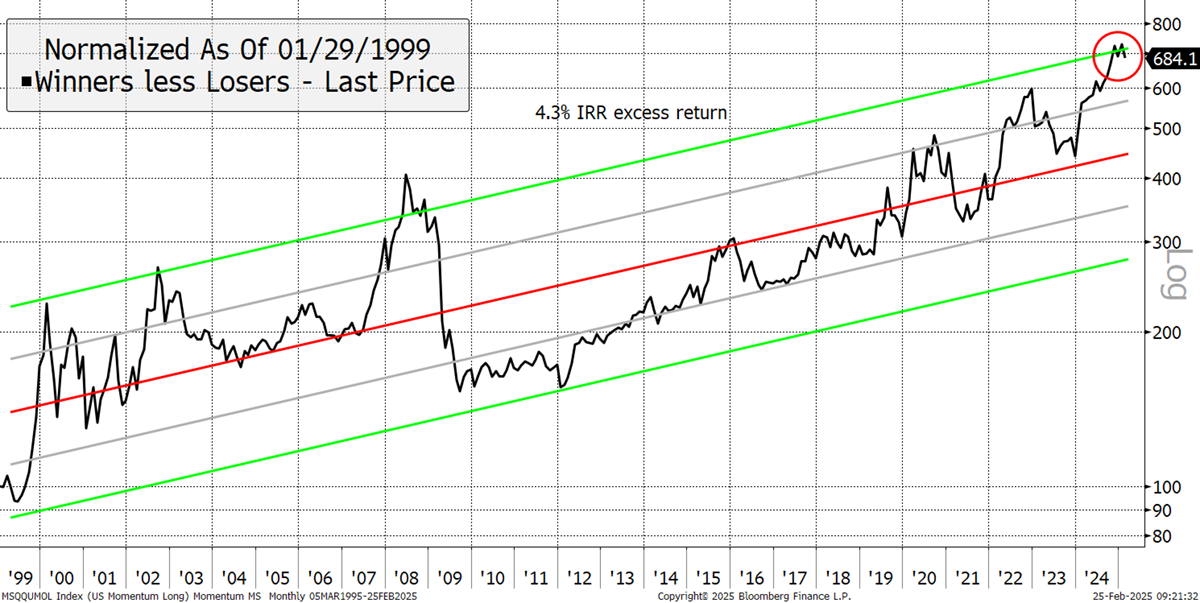
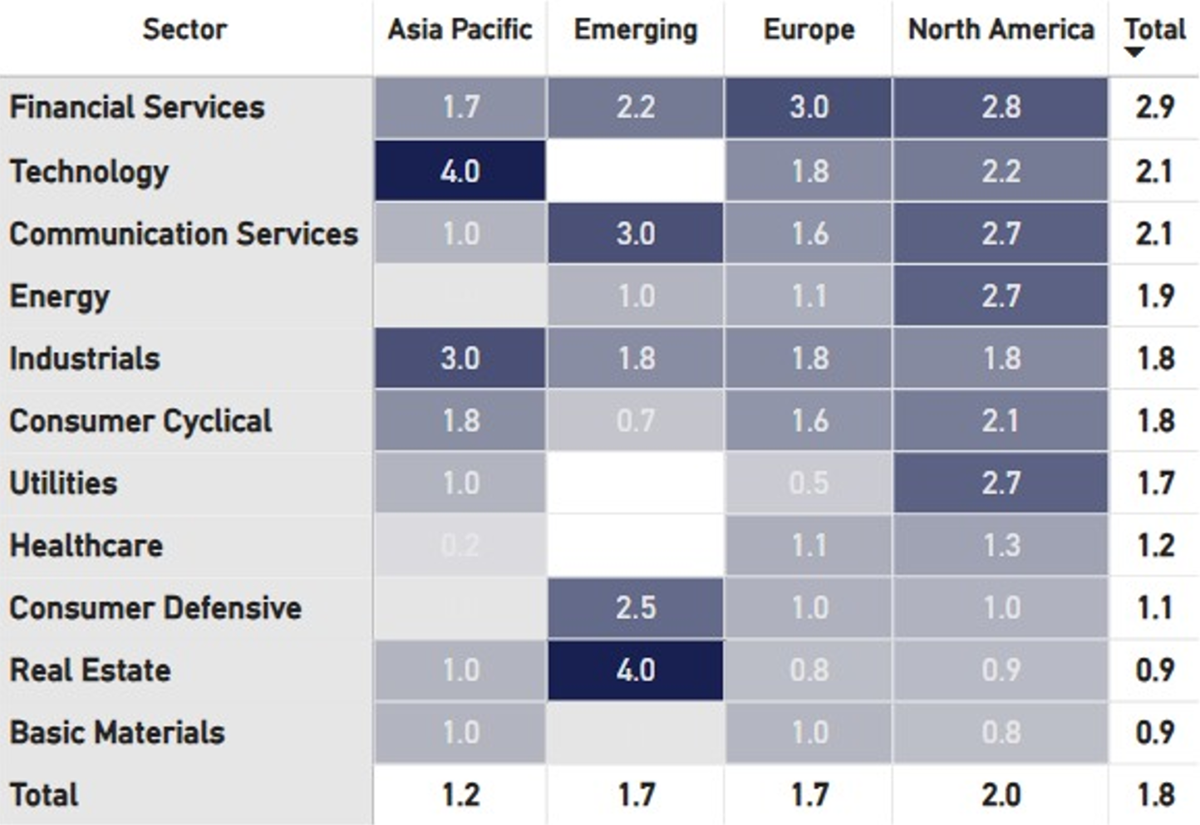
The momentum trend is back to levels last seen in 2000 and 2008. Looking at the stock level, 6 of the largest 7 stocks are down this year, with only META still up. The earnings season is underway, and expectations for next year are clearly too high. That becomes clearer when we compare the global markets. The US is easing back, while Europe and the emerging markets are catching up. Japan is lagging as the yen finally begins its long-overdue appreciation. A strong currency is normally positive for a stockmarket, but not when the make-up is heavily export-driven.
Key Global Markets – Past Year
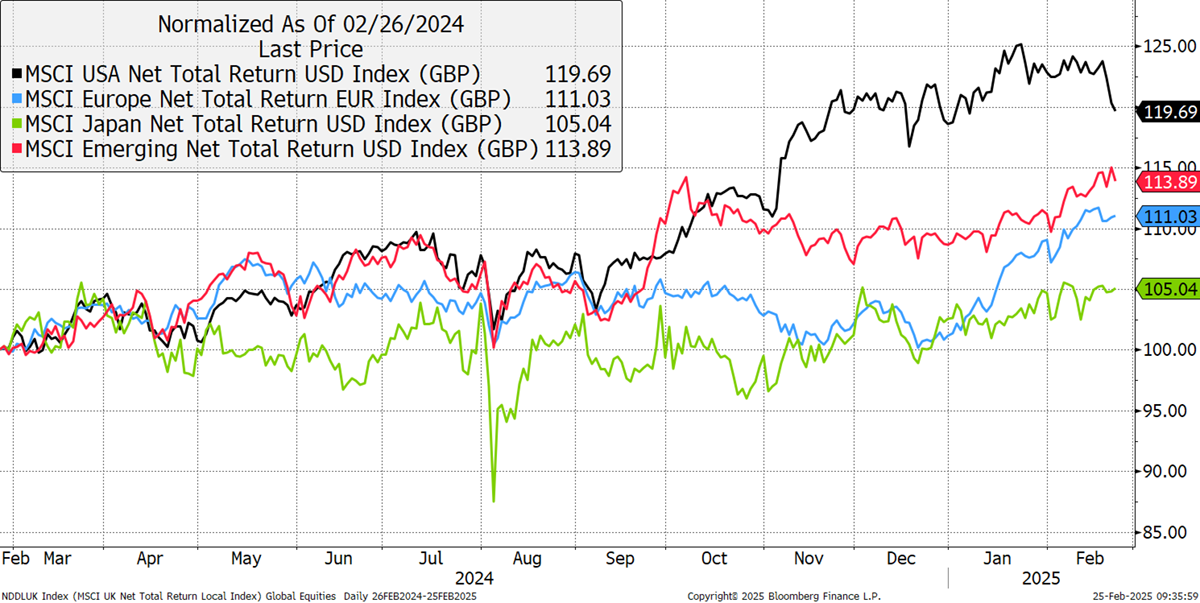
European momentum has taken off just as US momentum has cooled. The best bit for me is that the losers are rising as well. This means a stockmarket downturn in Europe is unlikely at this point. The excess return has also been calm so far, with the winners just 10% ahead this year.
European Momentum Winners vs Losers – Past Year
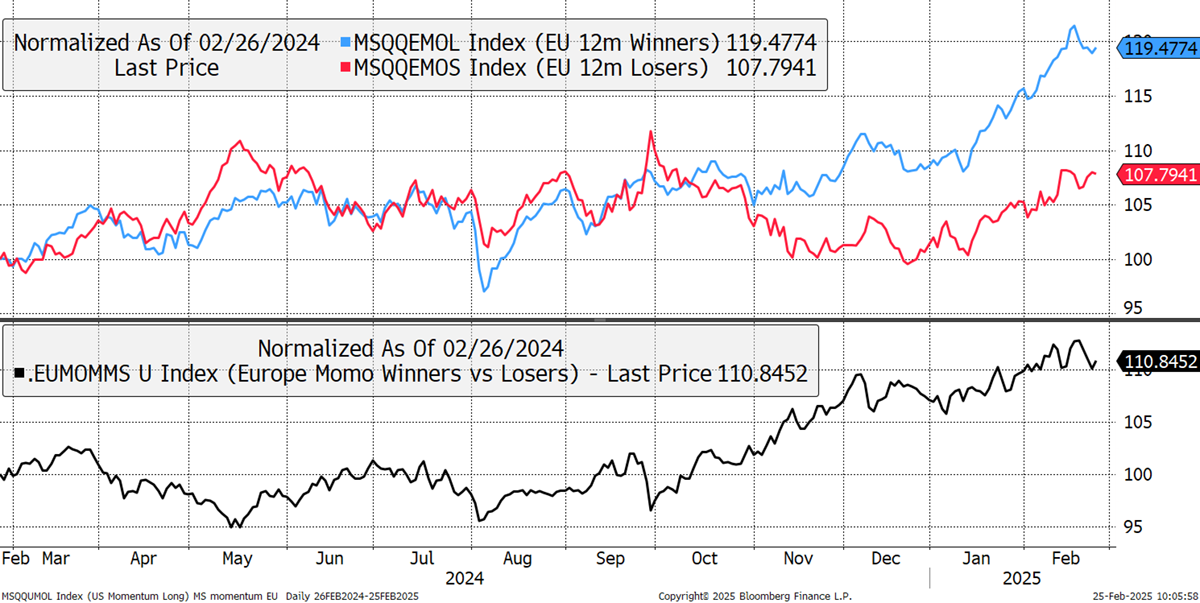
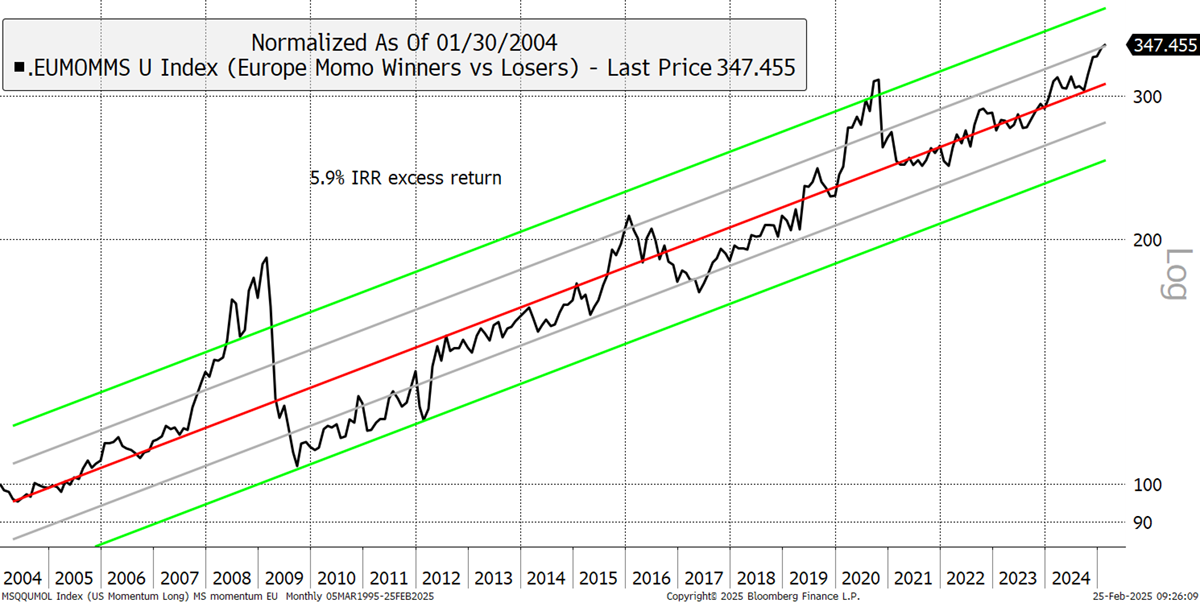
Longer-term, the European momentum effect is above the mean (red line) but much less so than in the US market. That means it’s less risky and has more to give.
European Momentum Winners Relative to Losers - Past 20 Years
A major rotation is underway, and GTI identifies the trends as they evolve.