
The Trouble with Data Centres


Issue 45;
- Past Winners are in trouble, yet past losers are resilient.
- Transport finds strength.
- Data centre credit woes.
Global Trends is a deep dive into global equities. The aim of this analysis is to better understand which countries, sectors, industries, and stocks are driving market returns. Not only does it help investors identify opportunities, but it also highlights the risks. We try to condense as much important information as possible, focusing on what really matters each week. Embrace this as a weekly discipline, and you’ll soon have a much better understanding of global financial markets.
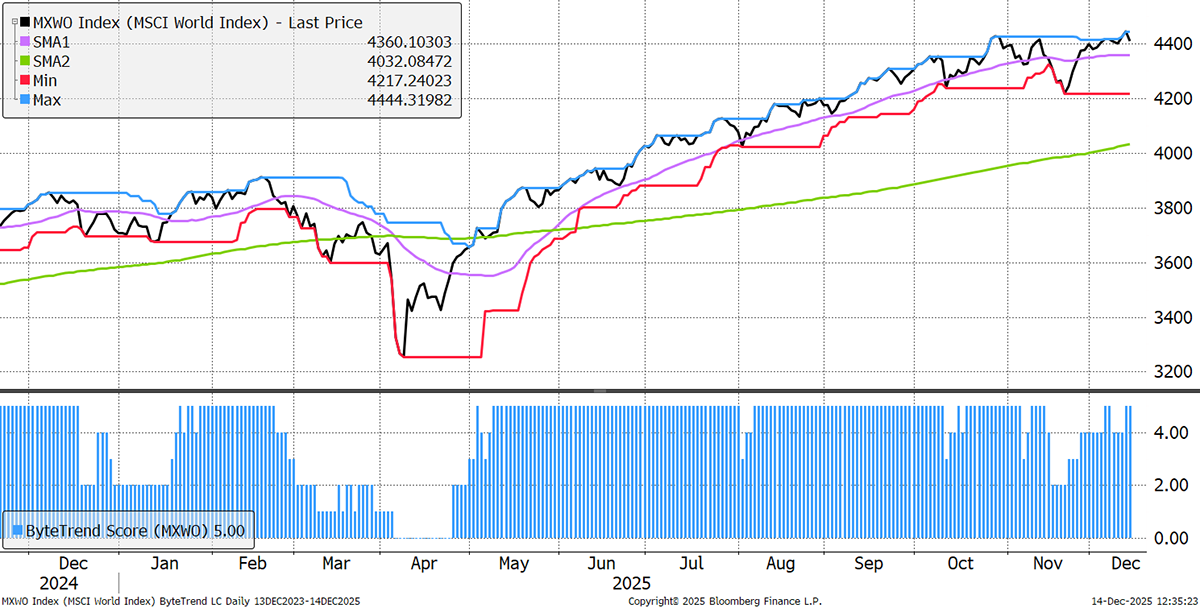
The World Index regained a ByteTrend Score of 5 and made a new all-time high. The pace has slowed, but never mock a new high.
World Index – Developed Markets – Daily
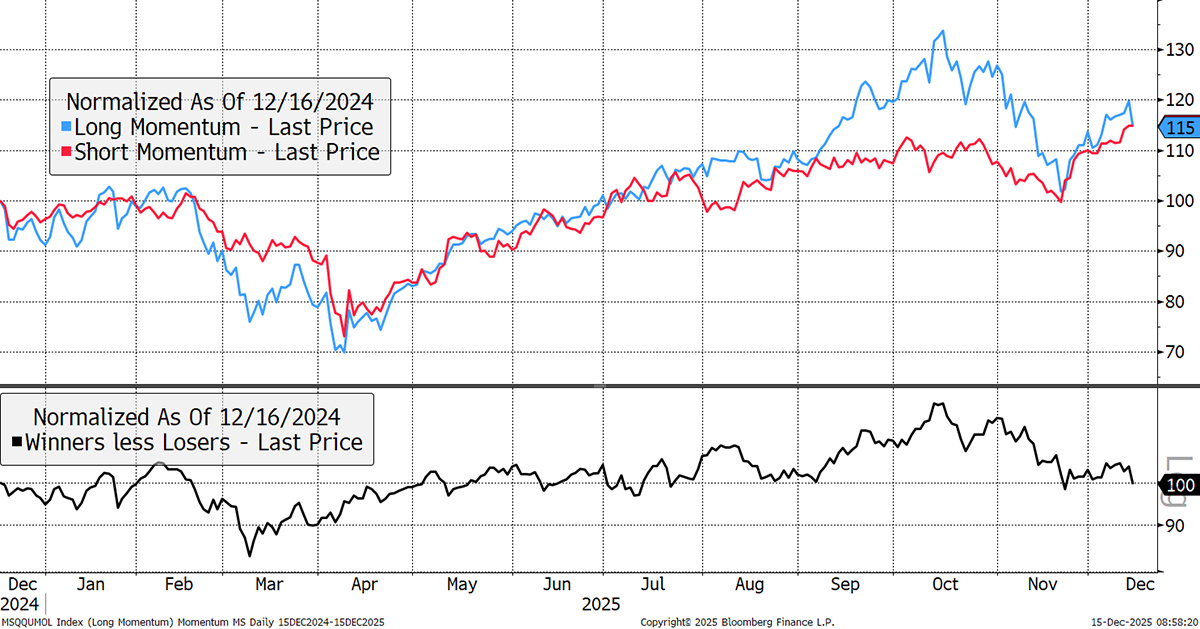
Momentum Effect – Daily Past Year
Checking in on the momentum indices, the past winners (blue) have rallied and reversed last week, while the past losers (red) have gained. The momentum line (black) has eased back.
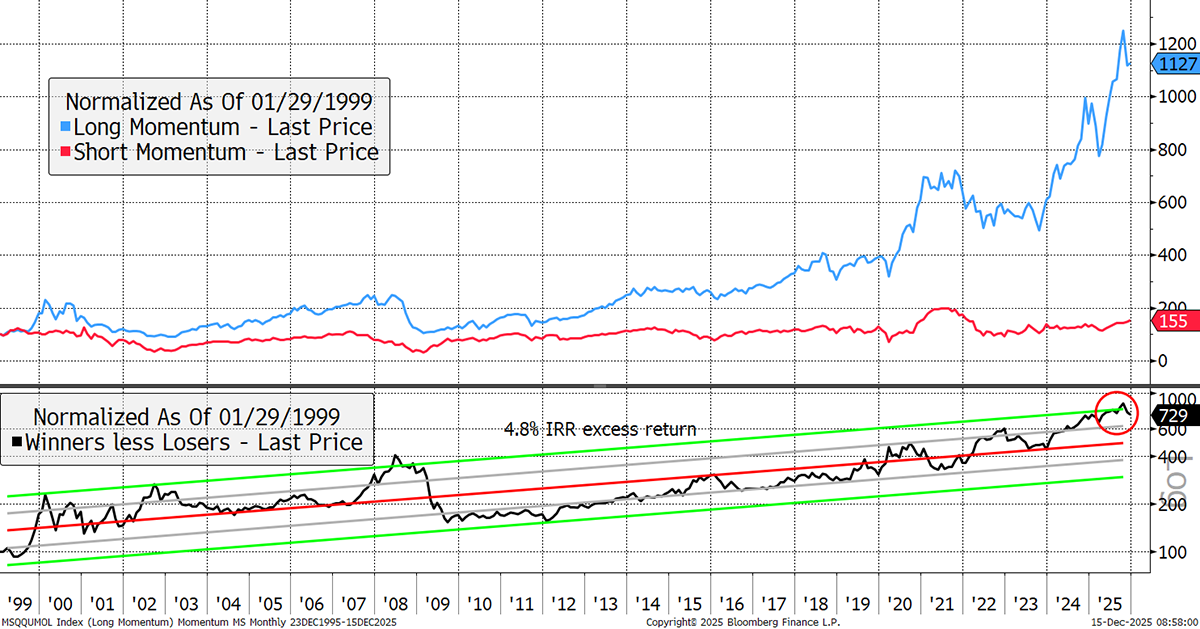
Momentum Effect – Monthly since 1999
Past winners have beaten the losers by 4.8% p.a. over 25 years. The momentum line was recently two standard deviations above the trend and is starting to retreat. We do not know how this will play out, just that it will. It has the potential to be disruptive and potentially painful for markets. A momentum retreat will favour value over growth.
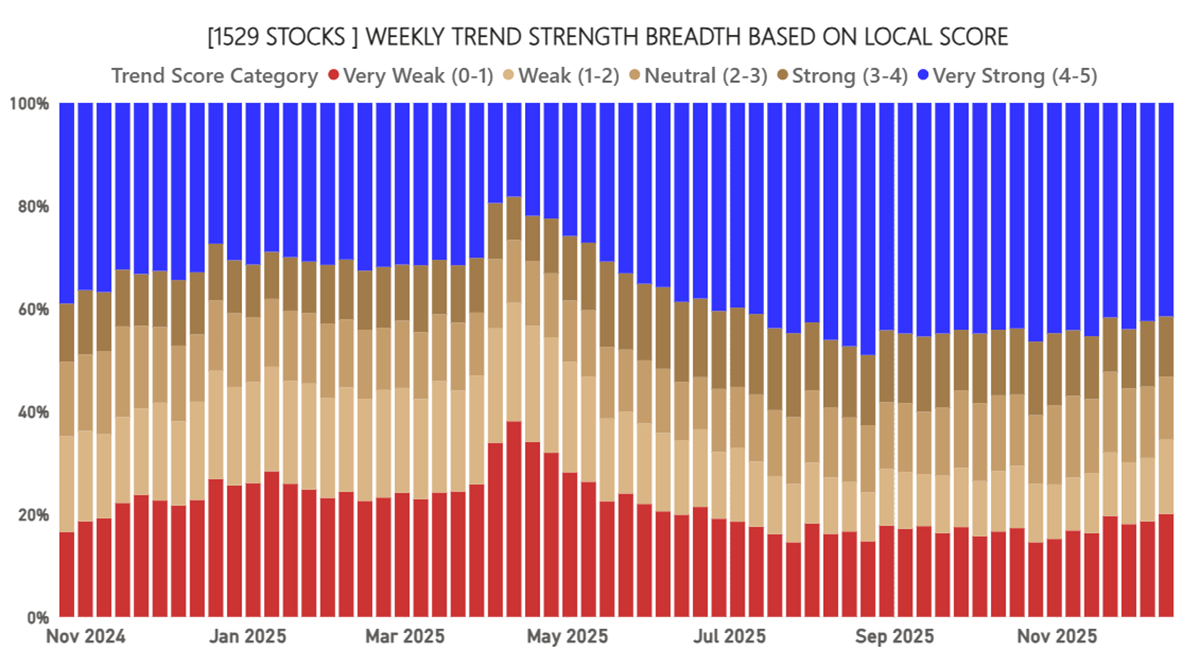
Market Breadth
Market breadth has been declining in recent weeks, as the red bars have risen. There are fewer strong blue trends in comparison. This is not yet serious, but it suggests a soft patch lies ahead.
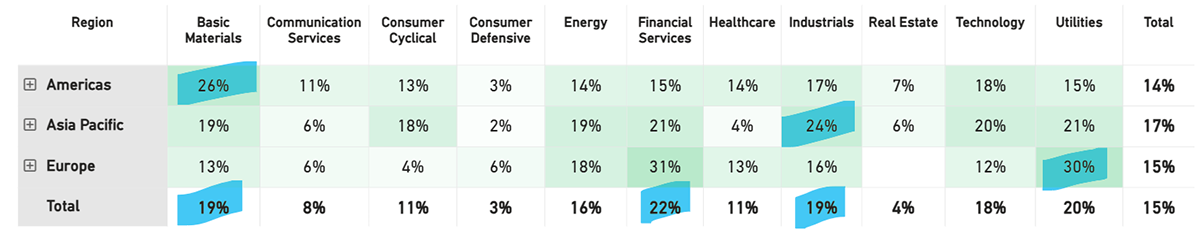
Global Winners
The world’s strongest stocks comprise 15% of all stocks, which are in trends that are beating the market. Not shown is that 41% are “going up” in local currency terms, but they are not necessarily beating the market. Basic materials, financial services, and industrials are stronger than last week, but the overall list remains similar.
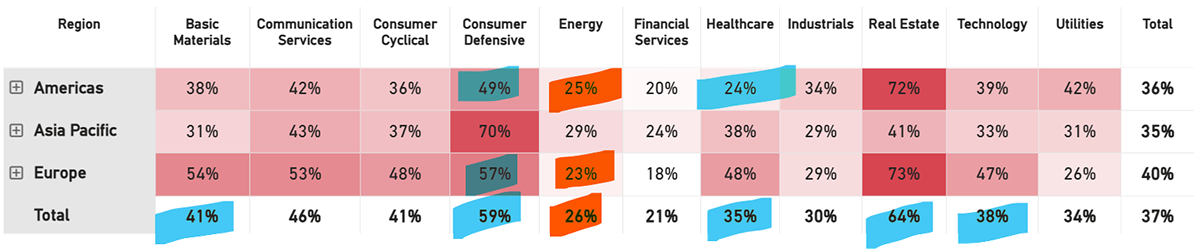
Global Losers
In contrast, a portfolio of the weakest relative trends comprises 37% of all stocks, yet only 13% in local currency terms. It means lots of stocks are lagging the market, but few are actually going down. When more stocks go down, a problem for the market will follow. Energy has pulled back, while most other areas, such as Consumer Defensives and Healthcare, are less weak than previously. That reflects the market rotation that is underway.
Industry Groups Relative Performance
Mining, Auto, and Banks have been strong in recent reports.
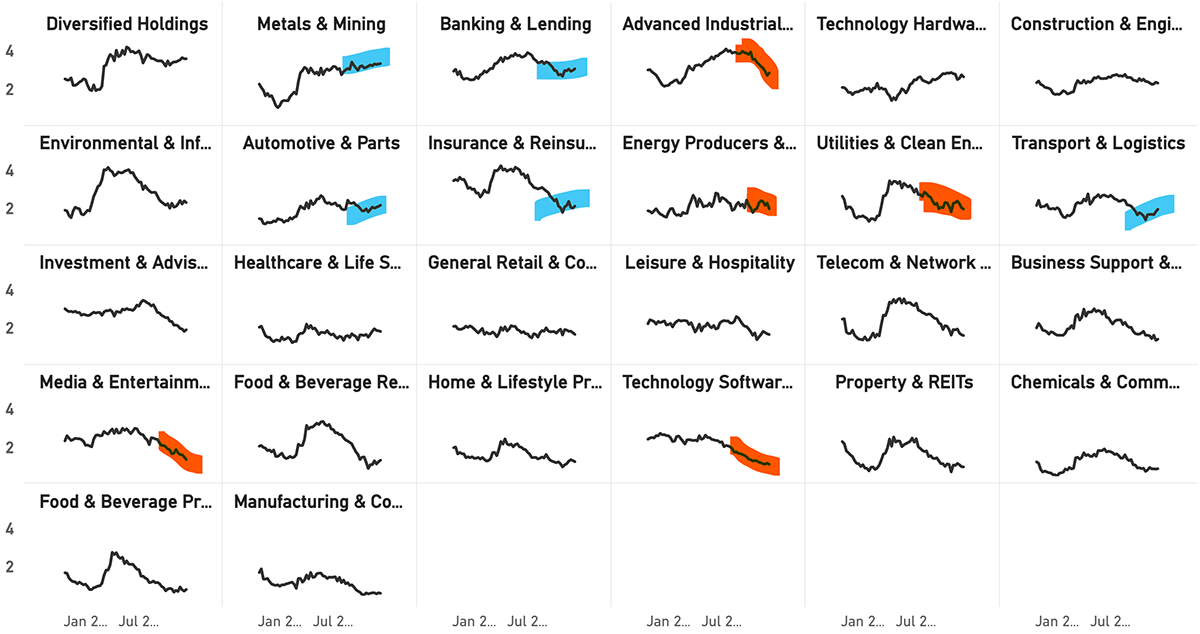
Transport
Shipping, Air Freight, and Logistics have lagged in recent years, just as they did in the late 1990s. They are picking up, and that is another sign of the great rotation. We highlight FedEx among the Emerging Trends below.

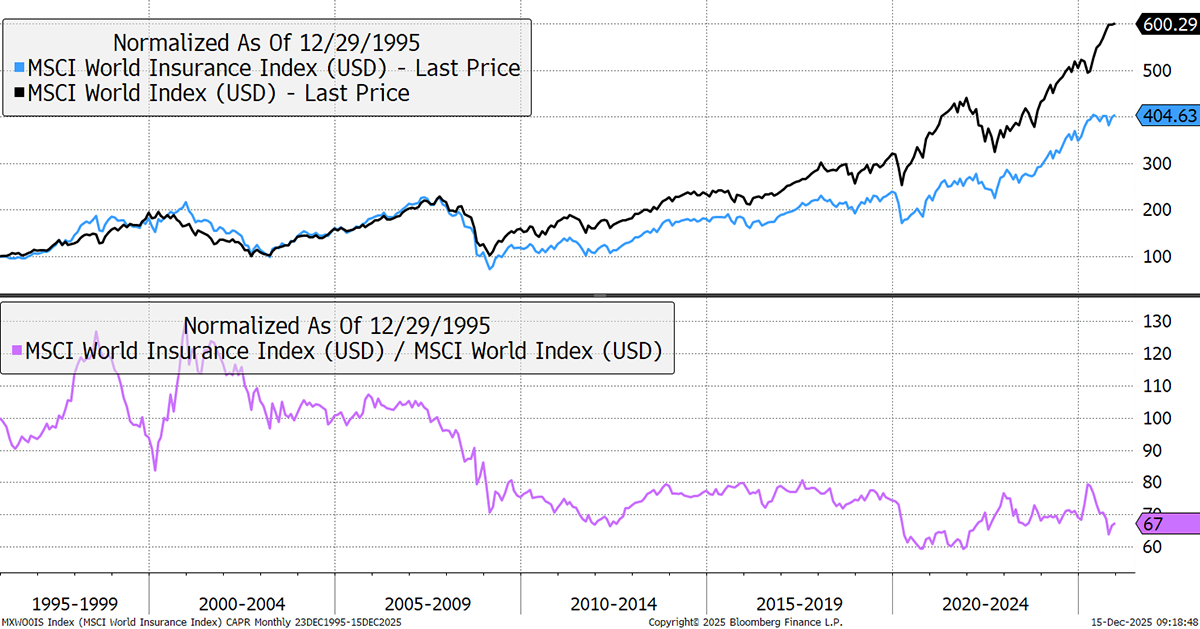
Insurance
The insurance industry has been thriving thanks to higher interest rates. These have allowed pension plans to re-attain a stable funding position, allowing them to “sell” management of the assets and liabilities to insurance firms. The growth of these “Pension Risk Transfers” has driven sales growth for the industry. It’s early days, but the sector has started to pick up.
Globally, during the 2010s, low rates hurt the life insurers who profited from the spread between the premiums they charged and the interest they could earn. Worse-than-expected natural disaster damage and the growth of cyber have also challenged the industry.
The Value Composite Score (Value) is measured against the company’s own financial history and not in absolute terms. The columns are Cheap (Chp), Value (Val), Fair Value (FV), Overvalued (OV), and Expensive (Exp). The Growth Composite Score (Growth) is measured by sales, earnings cash flow, dividends, and book value on a per share basis. The columns are High, Good, Medium (Med), Low, and Negative (Neg).
Leading Trends with New Highs
These stocks are trading at the 30-week CAPR highs with a ByteTrend Score of 5. All charts shown are CAPR rebased to 100.
| Name | Mkt Cap Bn USD | 360-Day Vol | Value | Growth |
| Walmart Inc. | 20 | 930 | Exp | Med |
| Wells Fargo & Company | 28 | 302 | OV | Good |
| Morgan Stanley | 21 | 284 | OV | Good |
| The Goldman Sachs Group, Inc. | 22 | 279 | OV | Good |
| American Express Company | 27 | 267 | OV | Good |
| HSBC Holdings plc | 21 | 256 | OV | High |
| Royal Bank of Canada | 11 | 233 | OV | Good |
| Citigroup Inc. | 24 | 208 | FV | Med |
| Industria de Diseño Textil, S.A. | 31 | 204 | OV | Good |
| Banco Santander, S.A. | 24 | 167 | OV | High |
| Banco Bilbao Vizcaya Argentaria | 26 | 130 | Exp | High |
| Sumitomo Mitsui Financial Group | 26 | 123 | OV | High |
| Southern Copper Corporation | 34 | 116 | OV | Low |
| Parker-Hannifin Corporation | 22 | 113 | Exp | Good |
| Siemens Energy AG | 36 | 110 | Exp | High |
| Newmont Corporation | 37 | 107 | OV | Neg |
| Mizuho Financial Group, Inc. | 27 | 91 | OV | High |
| Canadian Imperial Bank | 13 | 86 | OV | Good |
| Mitsui & Co., Ltd. | 22 | 85 | OV | Med |
| CRH plc | 31 | 85 | Exp | Med |
| Barclays PLC | 25 | 83 | OV | Good |
| CaixaBank, S.A. | 17 | 82 | OV | High |
| The Bank of New York Mellon | 16 | 82 | OV | High |
| ING Groep N.V. | 22 | 80 | OV | High |
| General Motors Company | 33 | 75 | FV | Good |
| Grupo México, S.A.B. de C.V. | 32 | 75 | OV | Neg |
| Barrick Gold Corporation | 36 | 74 | OV | Good |
| Oversea-Chinese Banking | 15 | 67 | OV | High |
| Mitsubishi Electric Corporation | 23 | 64 | OV | Good |
| Nordea Bank Abp | 17 | 62 | FV | High |
| Western Digital Corporation | 54 | 61 | Exp | Neg |
| Seagate Technology Holdings plc | 49 | 61 | Exp | Neg |
| Ross Stores, Inc. | 27 | 59 | FV | Med |
| PACCAR Inc | 25 | 59 | OV | High |
| Société Générale S.A. | 25 | 57 | OV | Good |
| Wheaton Precious Metals Corp. | 31 | 53 | Exp | Low |
| Standard Chartered PLC | 28 | 53 | OV | High |
| National Bank of Canada | 13 | 49 | OV | Good |
| Marubeni Corporation | 24 | 48 | Exp | Good |
| Galderma Group N | 27 | 48 | OV | High |
| Ferrovial SE | 17 | 48 | OV | High |
| Delta Air Lines, Inc. | 35 | 46 | FV | High |
| Rockwell Automation, Inc. | 18 | 46 | OV | Med |
| Great-West Lifeco Inc. | 14 | 45 | OV | Neg |
| Erste Group Bank AG | 24 | 44 | OV | High |
| AngloGold Ashanti Plc | 45 | 43 | Exp | High |
| Sumitomo Corporation | 20 | 42 | OV | High |
| Gold Fields Limited | 45 | 40 | Exp | Good |
| Skandinaviska Enskilda Banken | 13 | 40 | FV | High |
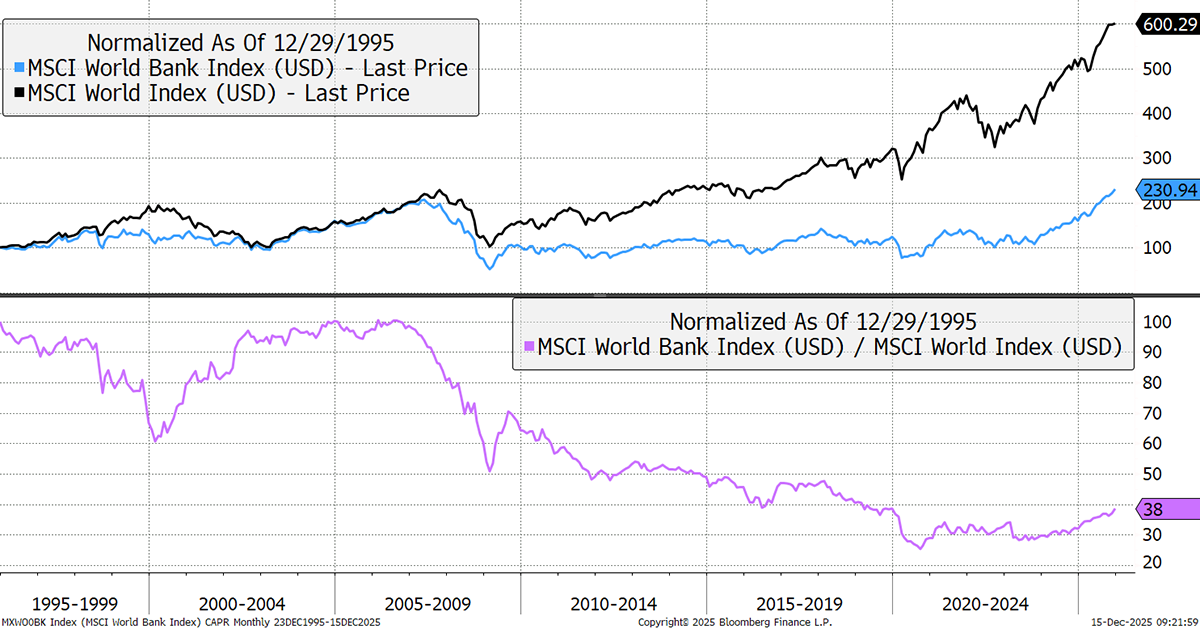
World Banks
Banks are strong on this week’s list. It’s easy to forget that the banks are in a privileged position in the economy, where they sit at the top of the food chain, with the ability to not only print money but also get a slice of all transactions. They have lagged the world since 2007, and although they have had a great year, this recent outperformance still has a long way to go.
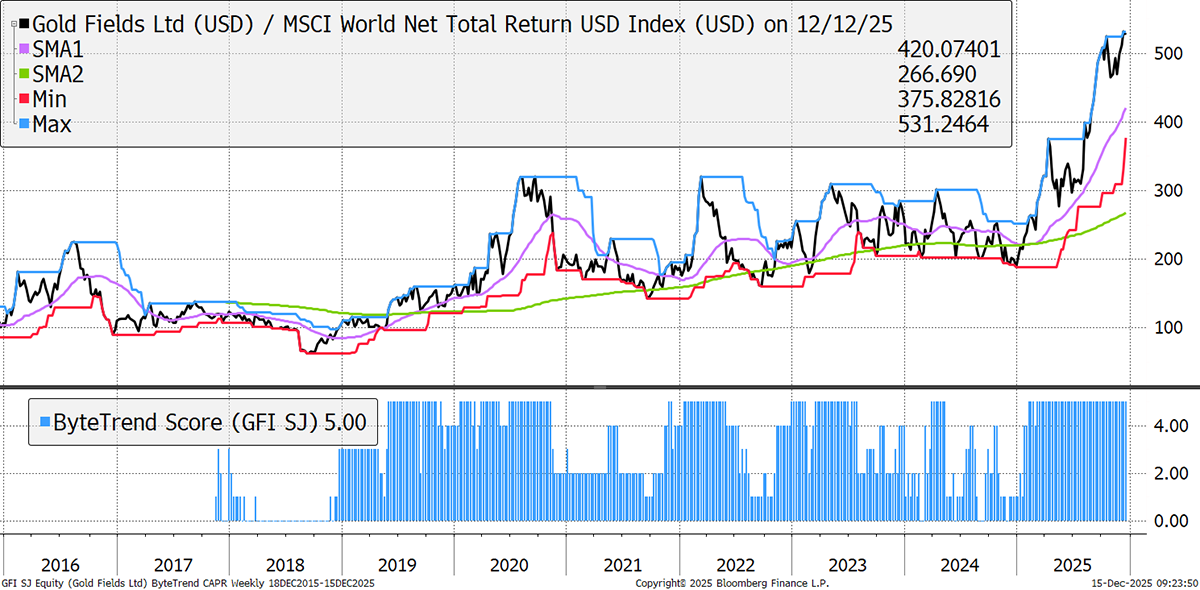
Gold Fields
South Africa’s Gold Fields has been outperforming the gold sector since 2016. With operations in Australia, South Africa, Ghana, Chile, and Peru, and a development project in Canada, it has become a major force in the sector. The analysts still see more upside.
New Leading Trends
These stocks are trading at the 30-week CAPR highs with a ByteTrend Score of 5, except they are new trends this week, having previously had a score below 5. All charts shown are CAPR rebased to 100.
| Name | Mkt Cap Bn USD | 360-Day Vol | Value | Growth |
| Investor AB (publ) | 16 | 106 | OV | Good |
| Carvana Co. | 54 | 99 | Exp | Med |
| Ryanair Holdings plc | 26 | 37 | FV | High |
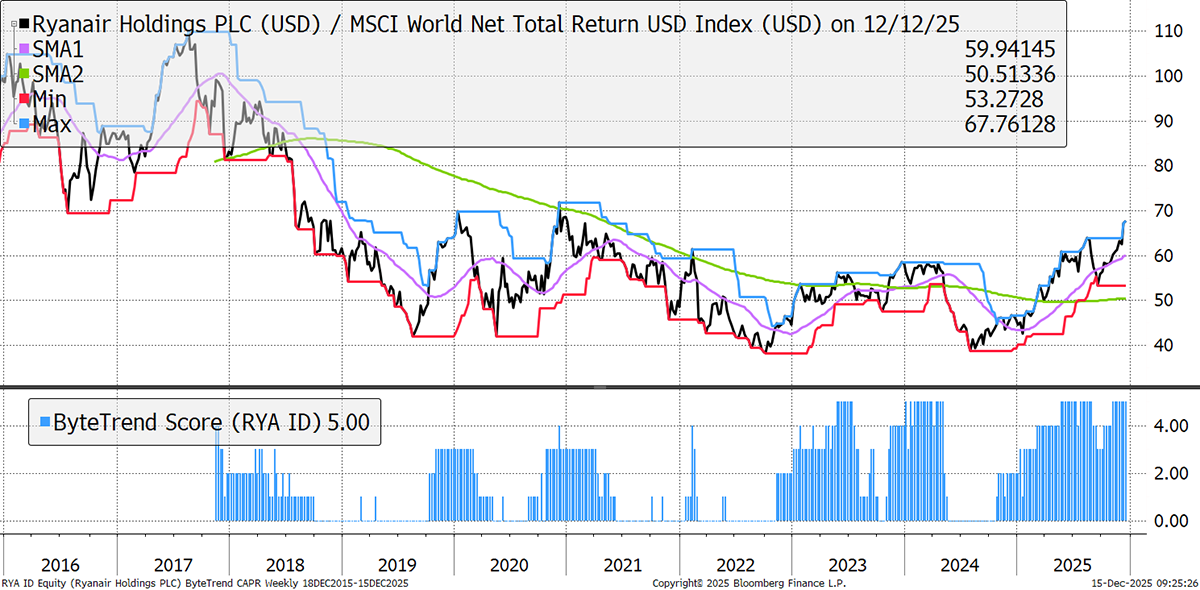
Ryanair (RYA)
Led by the charismatic Michael O’Leary, Ryanair is Europe’s lowest-cost and most punctual airline. While its average ticket price is two-thirds lower than its main peers, it still generates double their margins. O’Leary leaves no stone unturned when it comes to cutting costs for Ryanair’s customers and buys planes when the rest of the industry is panicking, to get the best prices. Free cash flow per share has grown to record highs recently, driven by double-digit sales growth, while the valuation is undemanding.
Emerging Trends
These stocks are trading at the 30-week CAPR highs with a ByteTrend Score of less than 5. They don’t have to be in an uptrend, just emerging. All charts shown are CAPR rebased to 100.


