The US Market Fights Back


Issue 22;
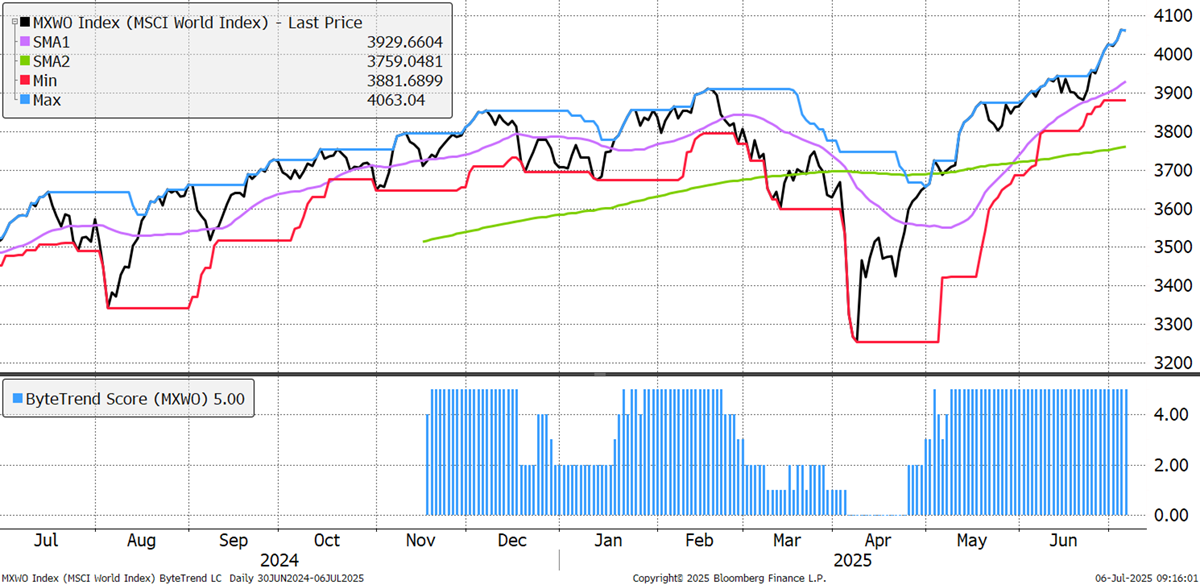
The world Index made another all-time high, helped by the largest stocks, and the lowest print for the dollar this year. The ByteTrend Score remains a healthy 5.
World Index – Developed Markets - Daily
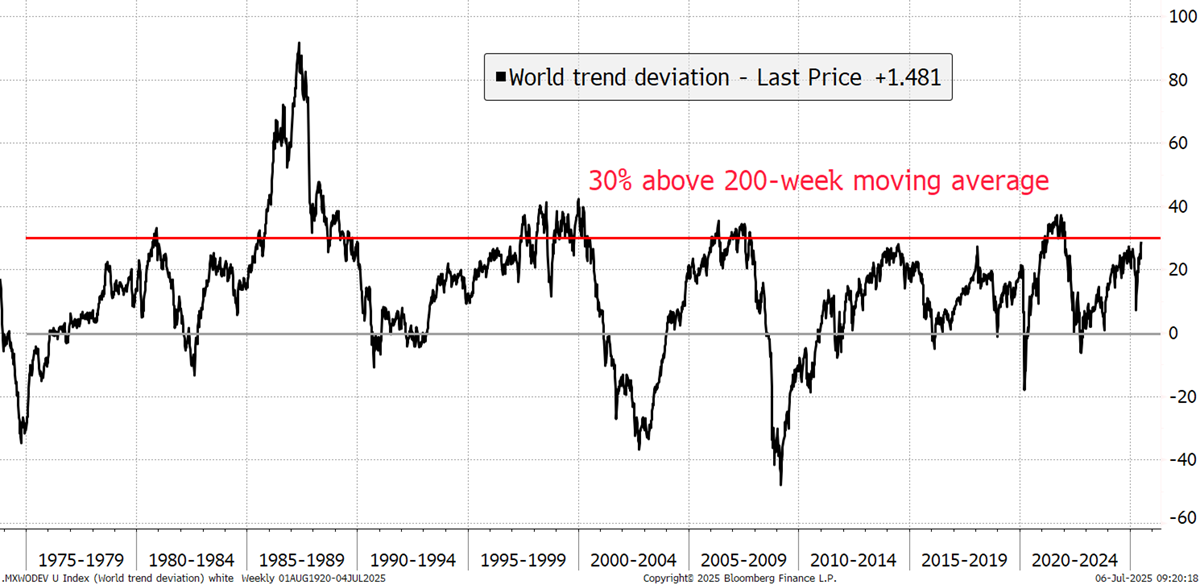
All rallies eventually become tired, and that’s why it is now important to monitor the “temperature” of the market. The world index is 28% above its 200-week moving average, which is hot, but not red hot. As per the below chart, 1987 stands out, but a normal high reading would be above 30%. This is manageable, but something to keep an eye on should the market surge higher.
World Index – Developed Markets – Trend Deviation weekly
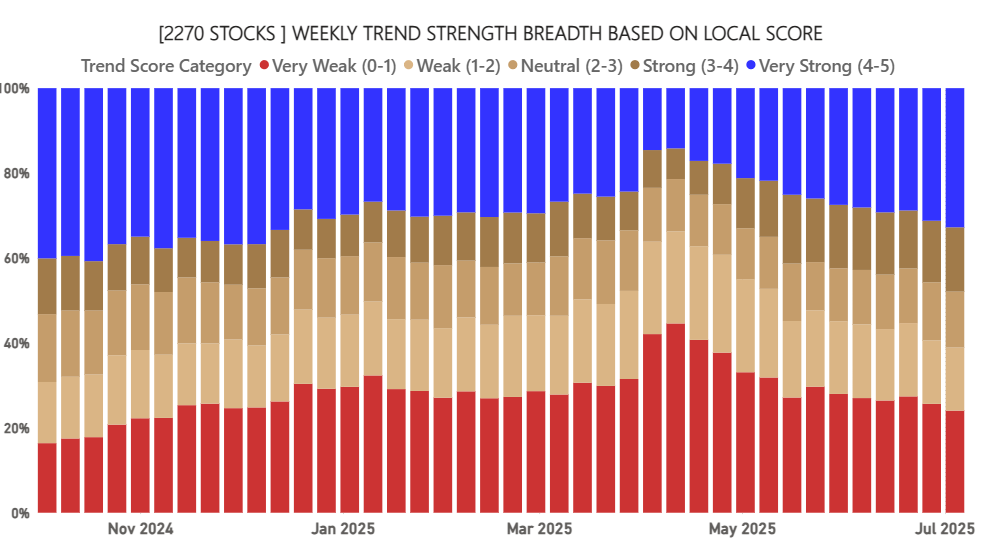
Breadth improves again, with another increase in bullish trends (blue) in local currency terms. The bearish (red) trends continue to be in retreat. This is healthy and underpins the bull market.
ByteTrend: Weekly Breadth Signal
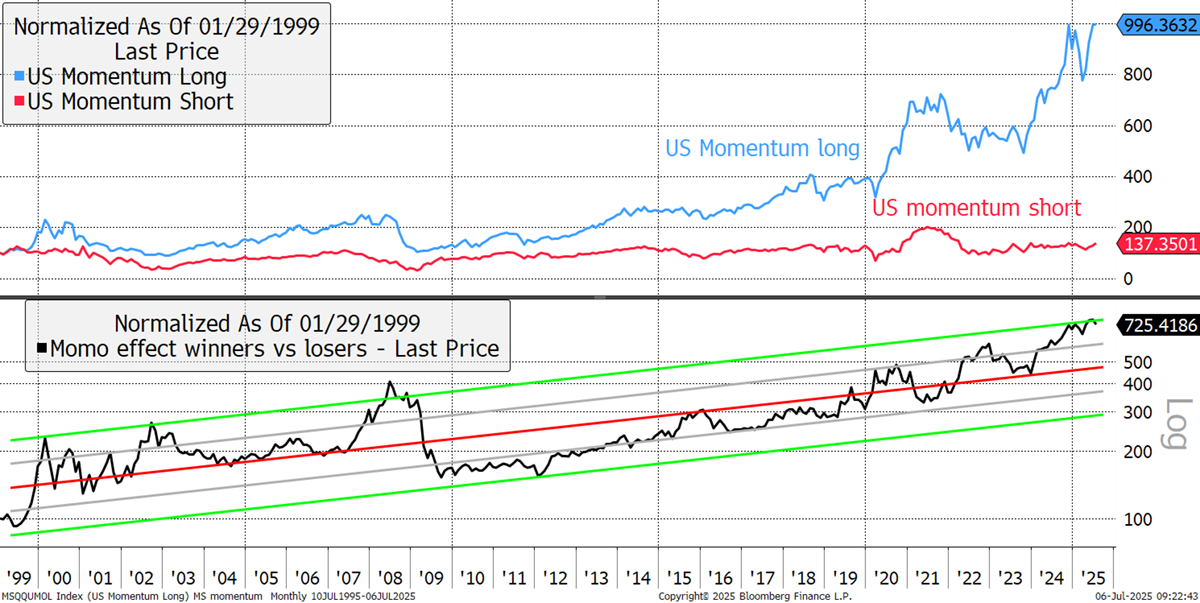
The momentum effect is back in the news. The US market leaders are at an all-time high, but only a few are beating the world index. The long-term outperformance of the strongest momentum stocks is around 5% ahead of the weakest stocks. Yet the winners are in stretched territory, implying a major momentum crash is coming at some point. Crucially, these normally occur after bear markets, so it may not happen anytime soon, as the market remains bullish. Momentum had a modest setback last week.
US Momentum Effect
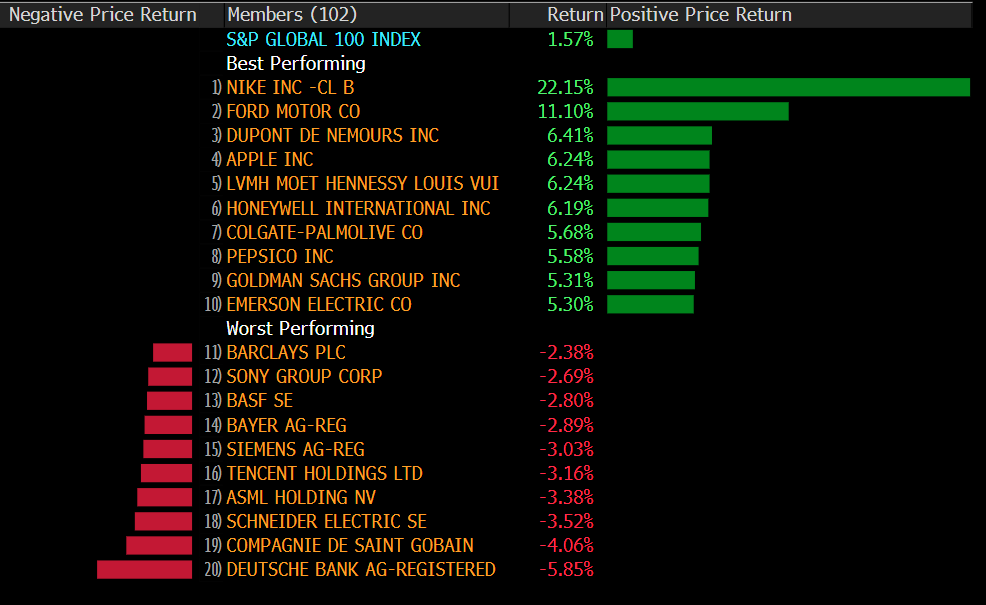
Leaders and Laggards Last Week
Nike has appeared on the bear list several times since 2023, but with a 22% rally, the squeeze has begun. Other previously weak stocks, such as Colgate, Pepsi and LVMH, also rallied. Maybe Quality is fighting back. Some European leaders gave back some ground, especially the banks. The falls were not material.
Developed Markets Leaders and Laggards
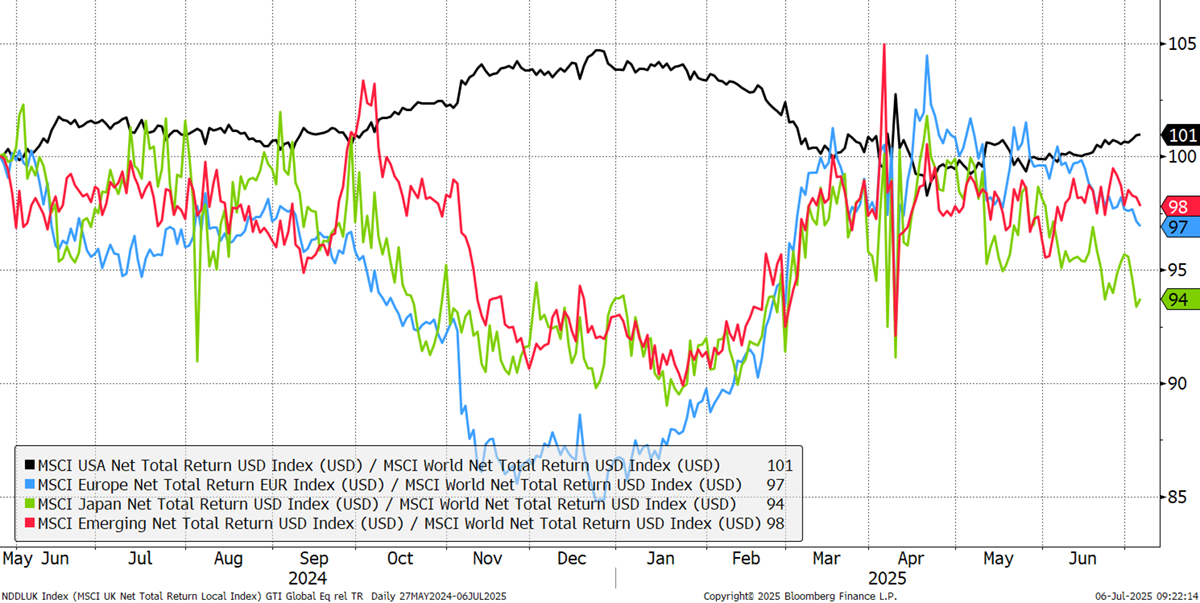
The regional CAPR chart has reawakened, with the US market once again showing leadership. Europe and EM have eased back, with Japan the standout decliner.
CAPR: Europe, USA, Emerging Markets and Japan - Past Year
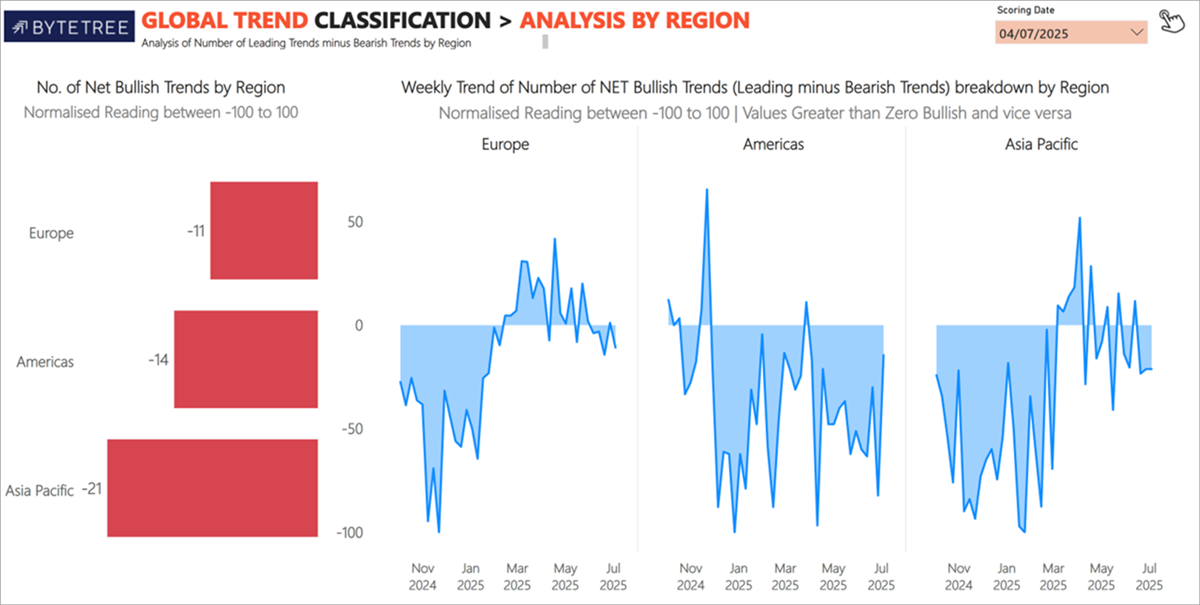
The net trends for each region are shown (find this and more in the spreadsheet). Last week saw a weakening in European bullish trends and a pickup in the Americas. Could this be the start of a major new trend? Anything is possible in financial markets.
Bullish Trends by Region
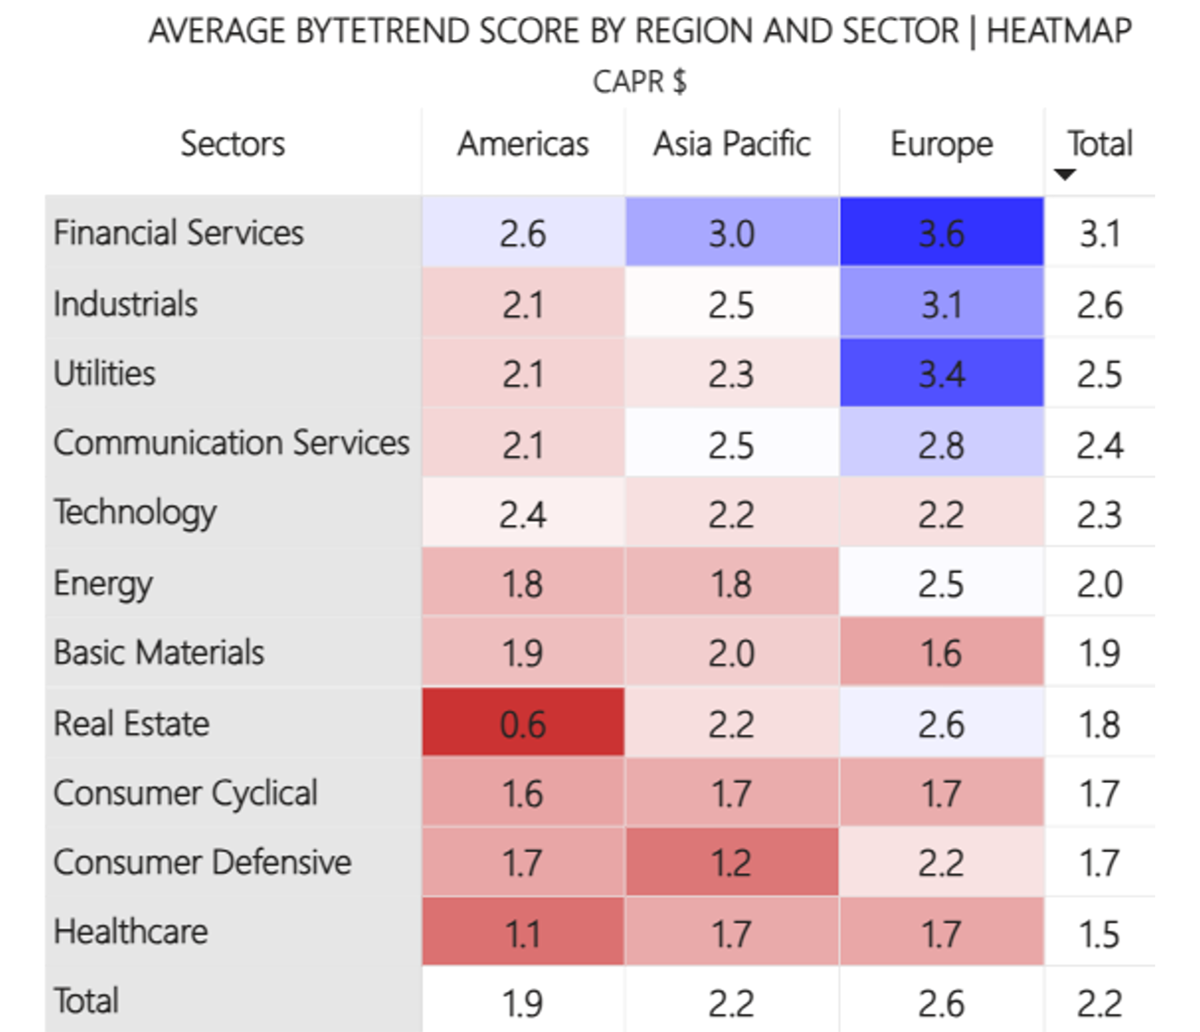
The world matrix sees European financials, previously the strongest group, down a notch, and US real estate, previously the weakest, up a notch. The Americas overall are up from 1.8 to 1.9. Asia is down from 1.3 to 2.2, and Europe from 2.8 to 2.6, which confirms the point made earlier. Utilities are slightly weaker, and energy slightly stronger.
CAPR: Average ByteTrend Score by Region and Sector Heatmap
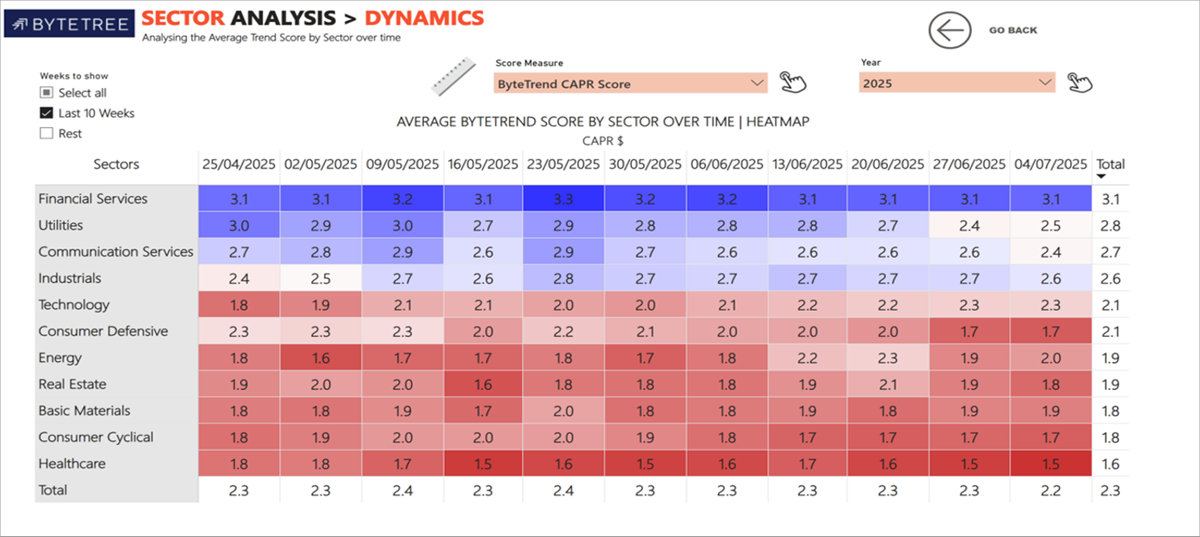
We can follow the global sector changes where financials are easing, with technology improving. Healthcare remains weak along with consumer cyclicals.
Sector Dynamics
Leading Trends with New Highs
These stocks are trading at the 30-week CAPR highs with a ByteTrend Score of 5. All charts shown are CAPR rebased to 100.
| Ticker | FX | Name | Sector CAPR | % Dev from CAPR 30W High | % Dev from CAPR 30W Low | Annual Vol 30W | MCap Bn USD | Sector | Industry |
|---|---|---|---|---|---|---|---|---|---|
| AVGO | USD | Broadcom Inc. | 5 | 0 | 54 | 64 | 1294 | Tech | Semis |
| JPM | USD | JPMorgan Chase & Co. | 5 | 0 | 16 | 34 | 823 | Finance | Banks |
| ORCL | USD | Oracle Corporation | 5 | 0 | 58 | 54 | 667 | Tech | Software Infra |
| GS | USD | The Goldman Sachs Group, Inc. | 5 | 0 | 26 | 38 | 222 | Finance | Cap Mkts |
| COF | USD | Capital One Financial Corporation | 5 | 0 | 20 | 40 | 141 | Finance | Credit |
| CRWD | USD | CrowdStrike Holdings, Inc. | 5 | 0 | 42 | 47 | 128 | Tech | Software Infra |
| LRCX | USD | Lam Research Corporation | 5 | 0 | 37 | 48 | 126 | Tech | Semis |
| KLAC | USD | KLA Corporation | 5 | 0 | 35 | 44 | 122 | Tech | Semis |
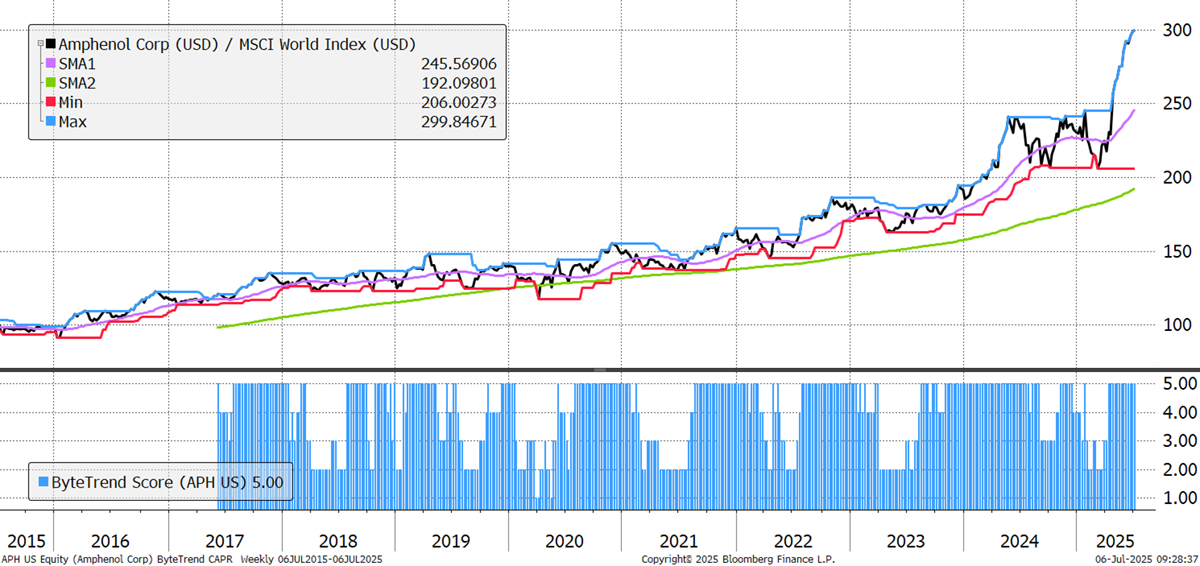
| APH | USD | Amphenol Corporation | 5 | 0 | 46 | 41 | 120 | Tech | Hardware |
| 9984 | JPY | SoftBank Group Corp. | 5 | 0 | 40 | 50 | 106 | Comms | Telecoms |
| RCL | USD | Royal Caribbean Cruises Ltd. | 5 | 0 | 54 | 54 | 91 | Con Cycl | Trav Serv |
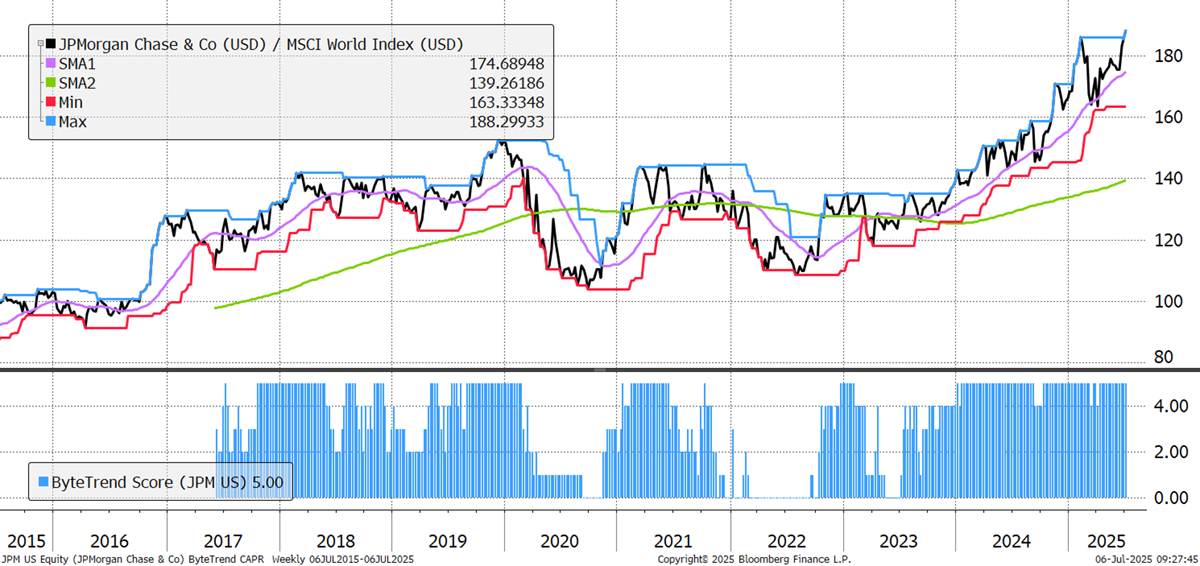
JPMorgan has led the way for decades under the stewardship of Jamie Dimon, whose annual letters are nearing must-read status among market watchers. It is well-run and takes advantage of market panic (such as buying First Republic Bank after its failure) and has a reputation for being a step ahead. It is the first US bank to make the leaders list in a while. Rates stay higher for longer, perhaps, or just a good bank?
JPMorgan
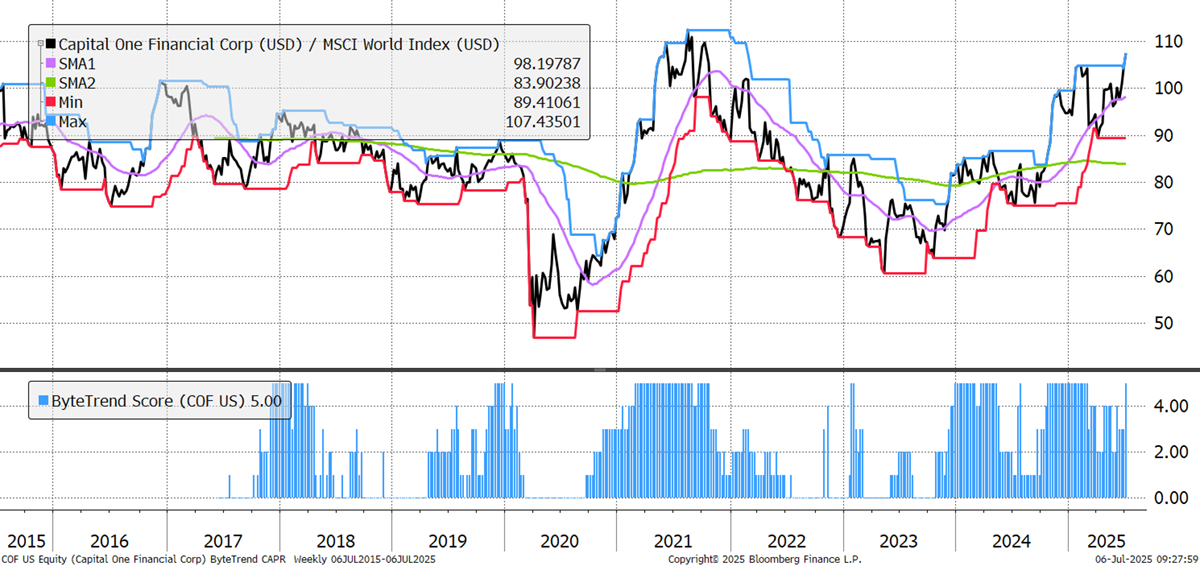
Capital One offers credit cards as well as consumer and commercial banking. It completed a $35 billion acquisition of Discover Financial Services in May 2025. This made it the largest credit card issuer by loan volume in the US and gave it ownership of the Discover payments network. In one stroke, it has become a serious competitor to Visa and Mastercard, and it has added three Discover executives to its board. The underlying business is solid and digitally focused, a combination that is well-received by investors.
Capital One
Amphenol designs and makes electrical and fibre optic connection systems, as well as antennas, sensors, and high-speed speciality cables. Its products are critical to numerous end markets. It works closely with major clients, operates globally, and spends generously on R&D, which currently means AI, to support the hyperscale data centre rollout. Management is decentralised and entrepreneurial, and they’ve delivered steady revenue growth and high returns on capital over the long term.
Amphenol
Robinhood Markets (recently also highlighted in ByteFolio) doesn’t always live up to its name. The delivery of low-cost investing capabilities to retail investors is gamified to encourage trading. Seen as a zippy outsider for many years, it is now entering the mainstream, offering a no-fee ISA in the UK, as well as margin trading. It lost 80% of its value post-IPO, poorly timed during the meme stock bubble. However, three years later, it has come roaring back as revenues have surged and net income has reached positive territory. A sign of the times and how speculative this rally has become.
Robinhood Markets

There are 43 additional leading trends with new highs in the GTI universe. Banks in Korea and Israel are a theme, along with tech hardware and semis. Plus, some gold mining in China.
Emerging Trends
These stocks are trading at the 30-week CAPR highs with a ByteTrend Score of less than 5. They don’t have to be in an uptrend, just emerging. All charts shown are CAPR rebased to 100.
| Ticker | FX | Name | Sector CAPR | % Dev from CAPR 30W High | % Dev from CAPR 30W Low | Annual Vol 30W | MCap Bn USD | Sector | Industry |
|---|---|---|---|---|---|---|---|---|---|
| DIS | USD | The Walt Disney Company | 3 | 0 | 25 | 37 | 223 | Comms | Entertain |
| TXN | USD | Texas Instruments Incorporated | 3 | 0 | 25 | 37 | 196 | Tech | Semis |
| C | USD | Citigroup Inc. | 4 | 0 | 25 | 41 | 166 | Finance | Banks |
| TD | CAD | The Toronto-Dominion Bank | 3 | 0 | 32 | 15 | 131 | Finance | Banks |
| BMO | CAD | Bank of Montreal | 3 | 0 | 8 | 18 | 82 | Finance | Banks |
| FCX | USD | Freeport-McMoRan Inc. | 3 | 0 | 29 | 51 | 66 | Materials | Copper |
| IFX | EUR | Infineon Technologies AG | 3 | 0 | 27 | 43 | 56 | Tech | Semis |
| TEL | USD | TE Connectivity Ltd. | 3 | 0 | 17 | 33 | 52 | Tech | Hardware |
| F | USD | Ford Motor Company | 3 | 0 | 21 | 25 | 46 | Con Cycl | Automakers |
| MCHP | USD | Microchip Technology Incorporated | 3 | 0 | 65 | 64 | 39 | Tech | Semis |
| ROK | USD | Rockwell Automation, Inc. | 3 | 0 | 29 | 37 | 39 | Indust | Ind Mach |
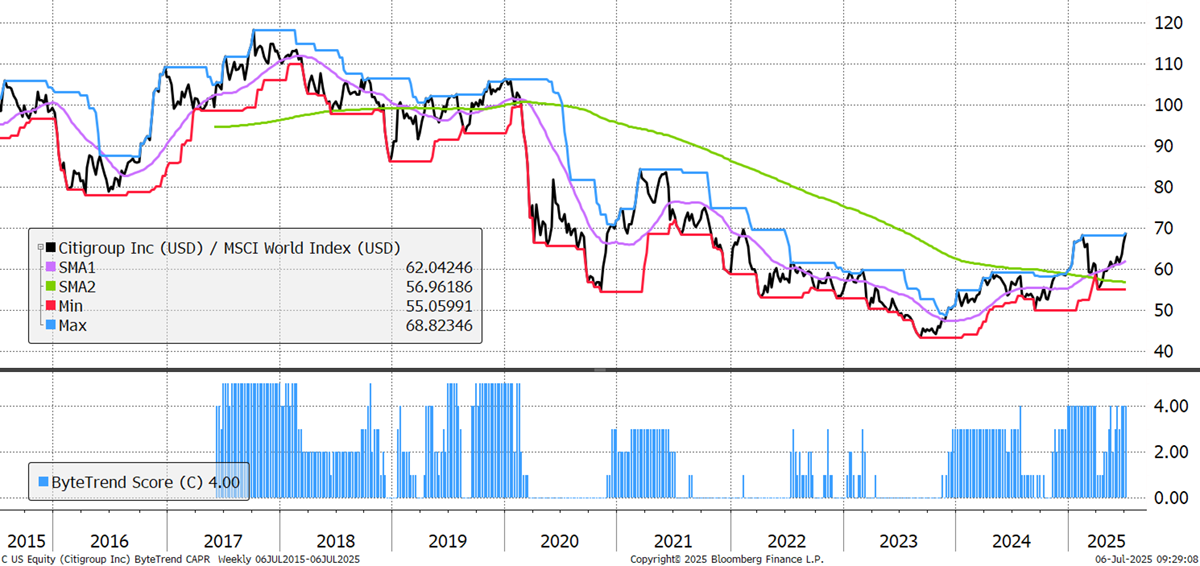
Citigroup is another global banking giant showing strength. So much for death-by-fintech; there’s room for all in the financials space, it would seem. It is exiting consumer banking in 14 international markets to focus on higher-margin institutional and wealth management businesses, while trying to simplify and digitalise its operations. After a long run of underperformance, the strategy is starting to bear fruit with solid first-quarter results in 2025, including a record performance in its Services and Wealth segments.
Citigroup