
Trump Crash


Issue 9;
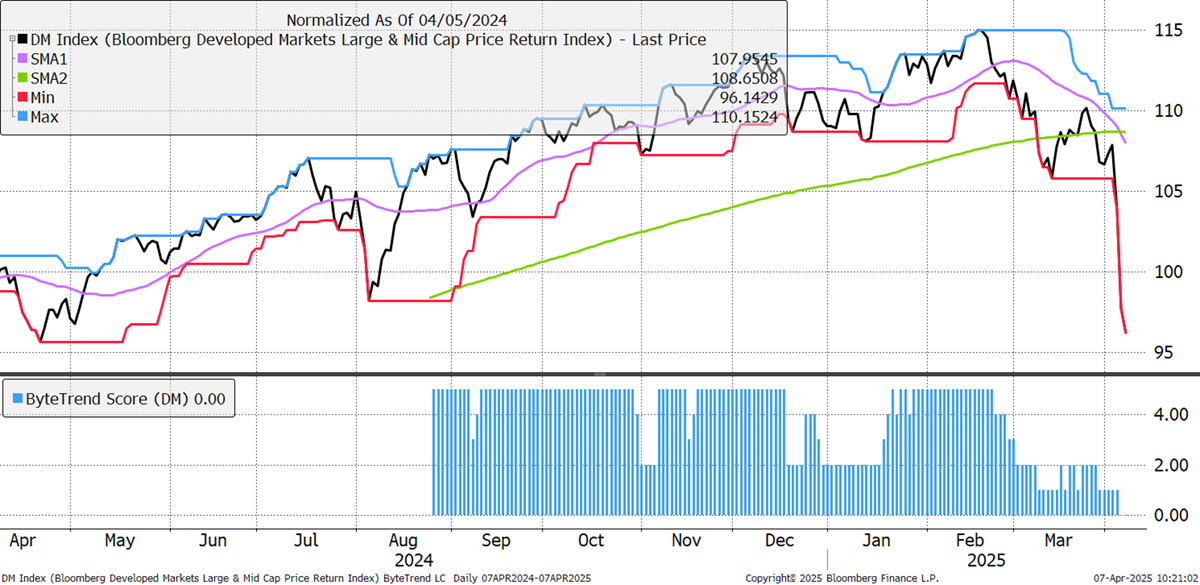
The World Index drops back from a ByteTrend Score of 5 in February to a 0 on the daily chart. The price is testing the year’s lows. This feels more like the 1987 crash than any of the recent bear markets.
World Index – Developed Markets - Daily
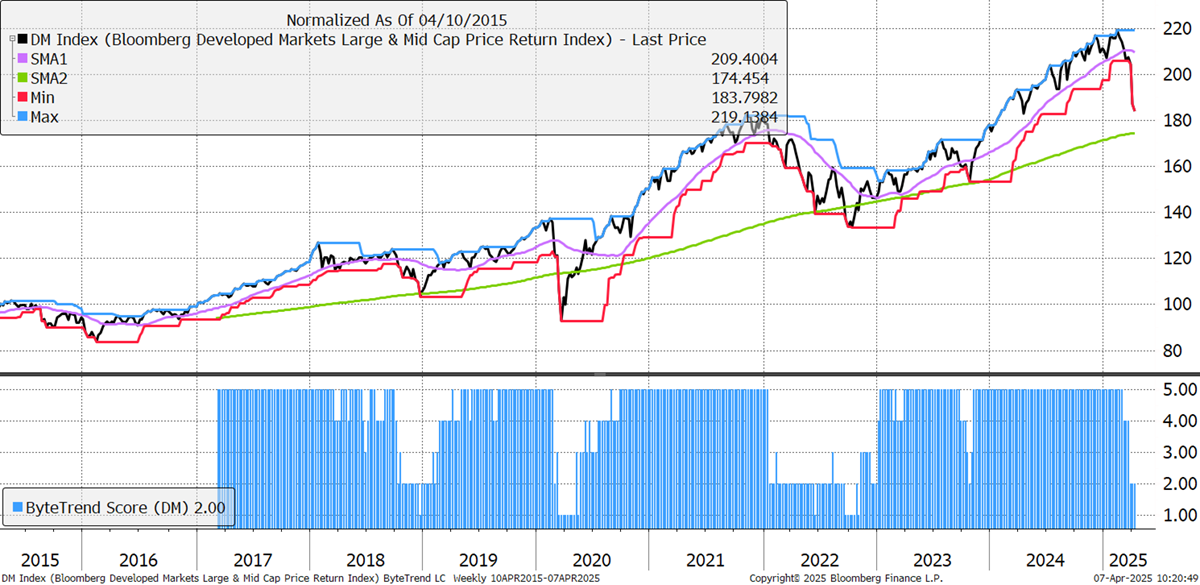
It may not feel like it, but the global index is still above the 200-week moving average. It doesn’t feel that way because that’s week, not day, as you see above. The ByteTrend Score remains at 2 because it is still above the 200-week moving average, which is positively sloping.
World Index – Developed Markets - Weekly
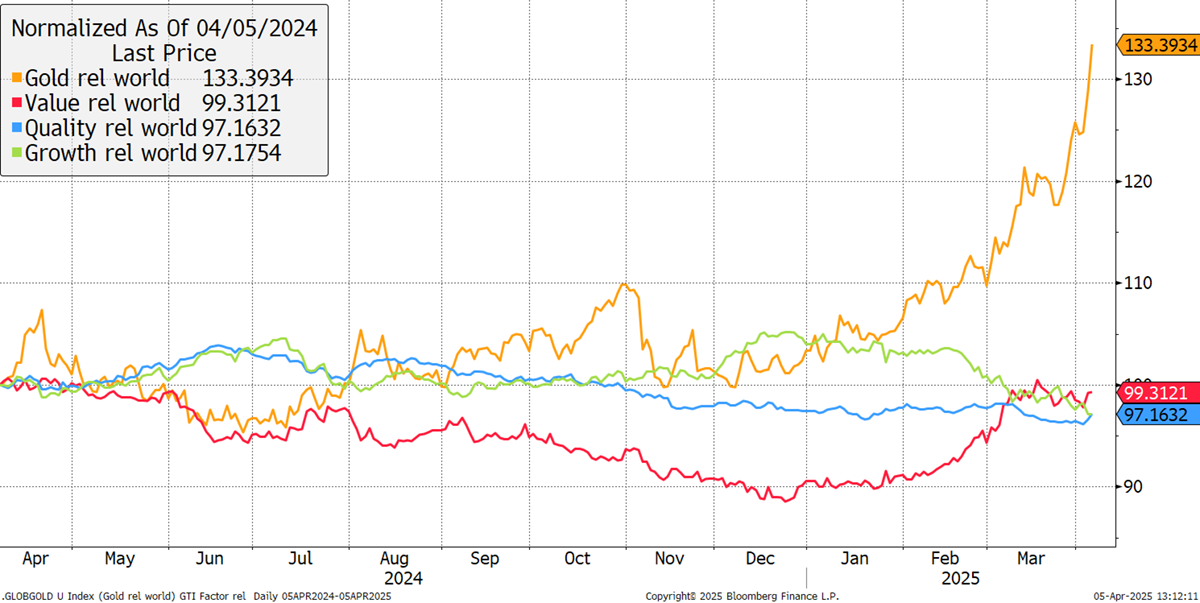
The factor moves favour gold, which has beaten the market by 33% this year. Growth has taken the worst hit this year, with value on the other side. Quality is starting to outperform.
Major Factors – Past Year
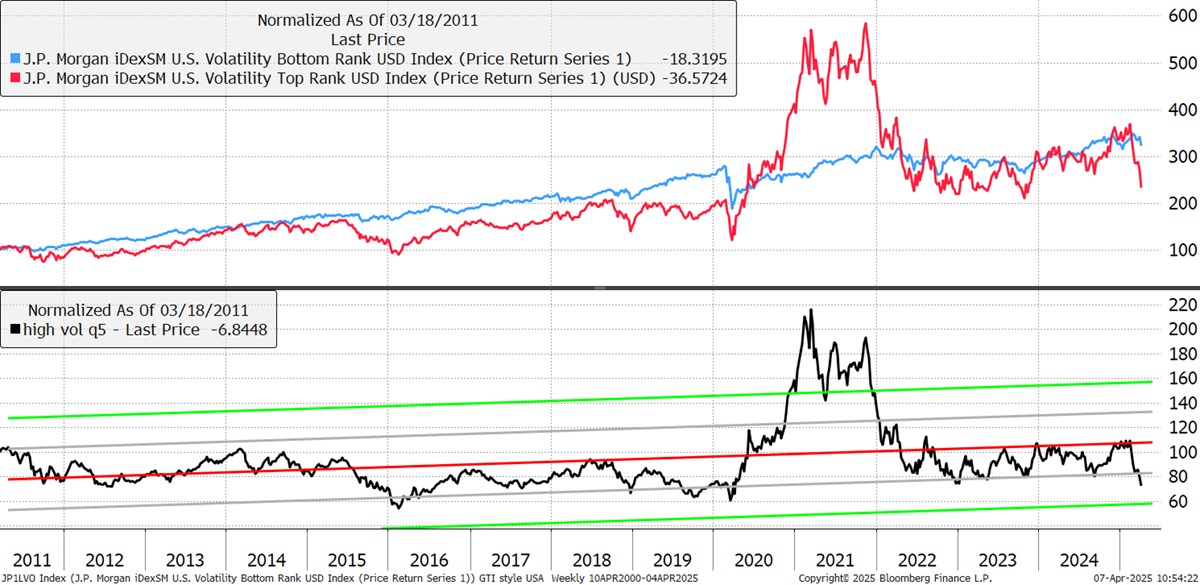
It is worth highlighting momentum and volatility. High-volatility stocks started to turn down recently, while low-volatility stocks have held up well – although they are now weakening. The stockmarket is already oversold. The high-volatility stocks are now 1.5 standard deviations oversold versus the low-volatility defensives. The market is short-term oversold.
Investment Styles – Volatility
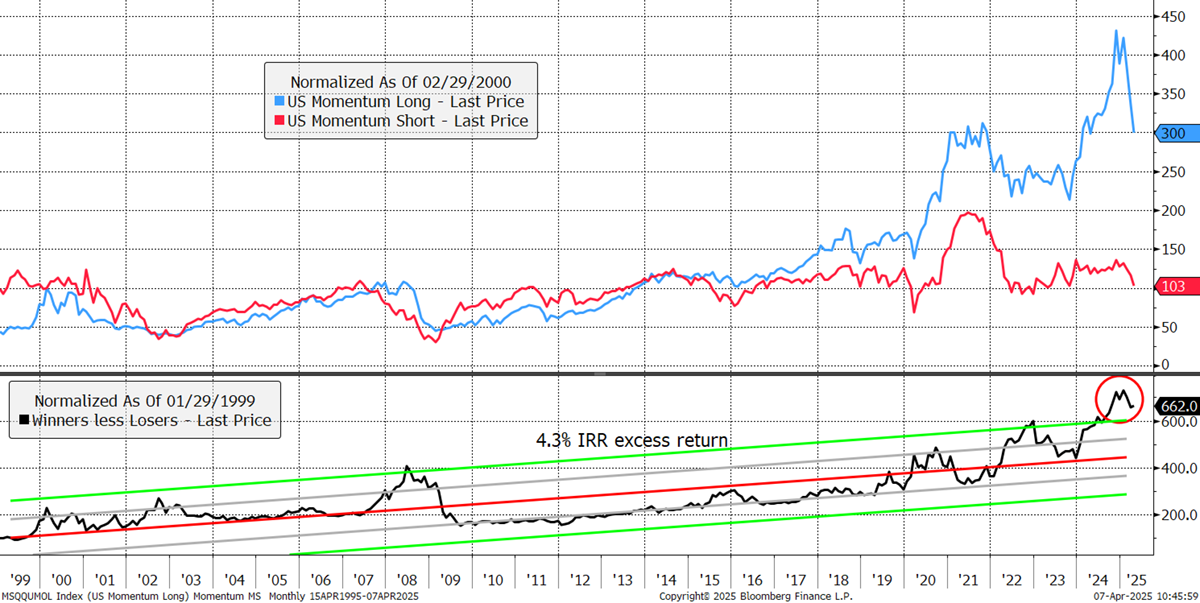
Momentum indicators show the winners and the losers over ten years. The winners had been extremely overbought. A momentum crash had been expected, but the selloff in the stockmarket isn’t a momentum crash because the winners have sold off in line with the losers. This is a 1987-style stockmarket crash.
Investment Styles – Momentum
In this issue of The Global Trend Investor, we cover the top 200 global stocks. We have analysed the trends, reported the results, and will discuss the highlights.
CAPR stands for currency-adjusted price relative.


