
USA Lags the World by 12% since the US Election


Issue 41;
- The great stockmarket rotation accelerates.
- Defensive stocks gain as hype cools.
- Shift towards Asia.
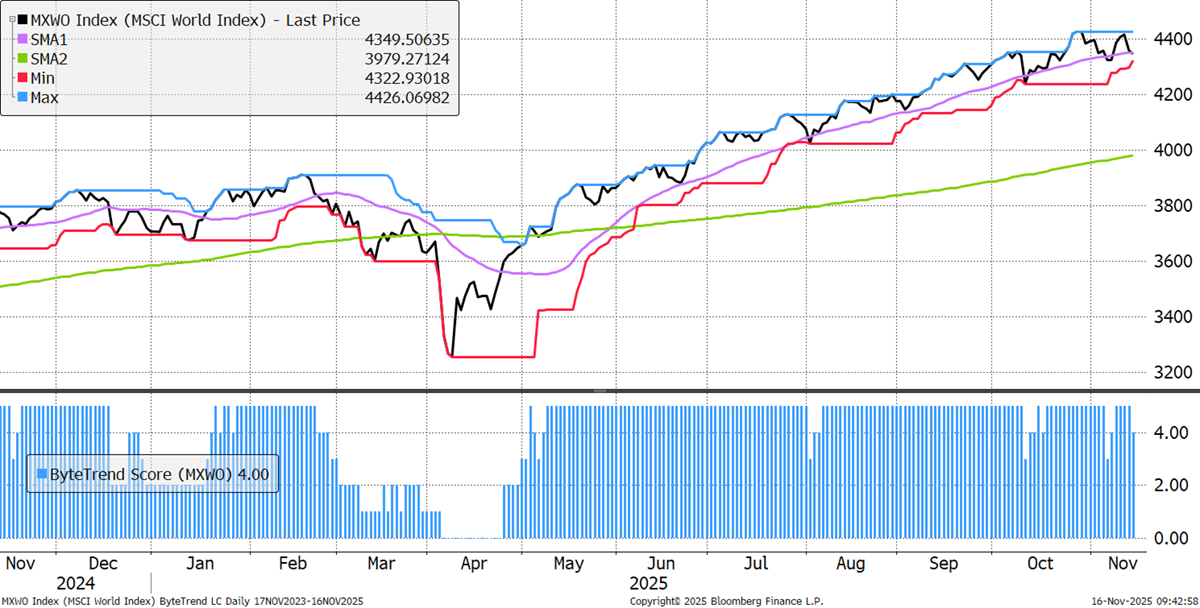
The World Index ended the week at a ByteTrend Score of 4. The bull market remains intact, but there is notable rotation under the surface.
World Index – Developed Markets – Daily
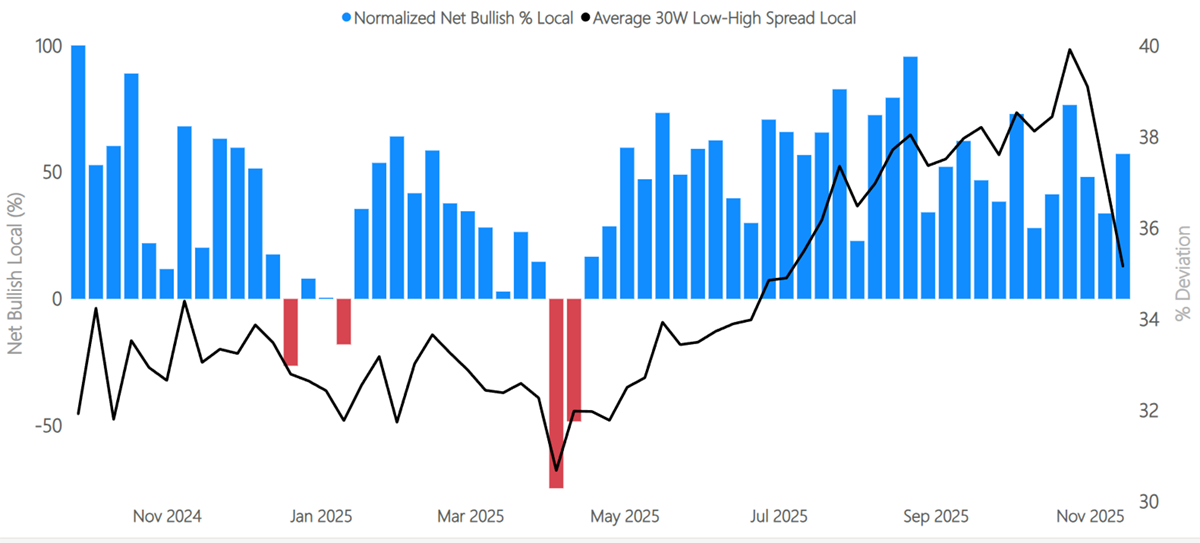
The chart above shows the beta, or the market return. The alpha represents the stocks that are beating it. GTI can demonstrate this. In local currency (beta), the average stock is in a price uptrend, as the chart is dominated by blue bars.
GTI: Weekly Net Bullish % Local Currency
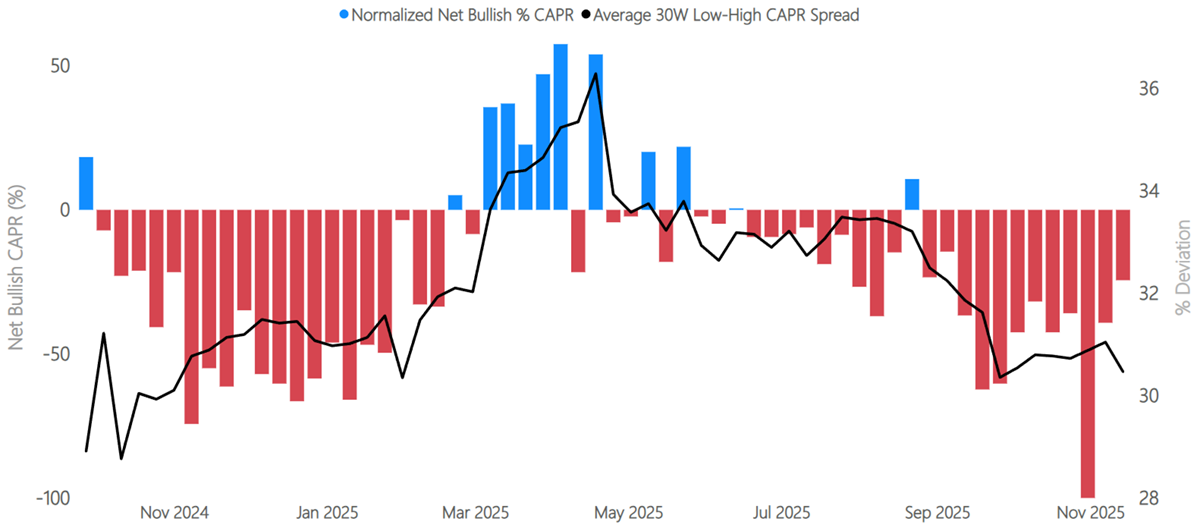
When measured in CAPR instead of local currency, we measure alpha. There was a massive lack of alpha two weeks ago, as the leadership was so narrow. That has retreated significantly in just two weeks. You can’t see this shift in the World Index, as it has remained stable. It means the internal market rotation has been significant. It is at times of change that the new trends are most important.
GTI: Weekly Net Bullish % CAPR
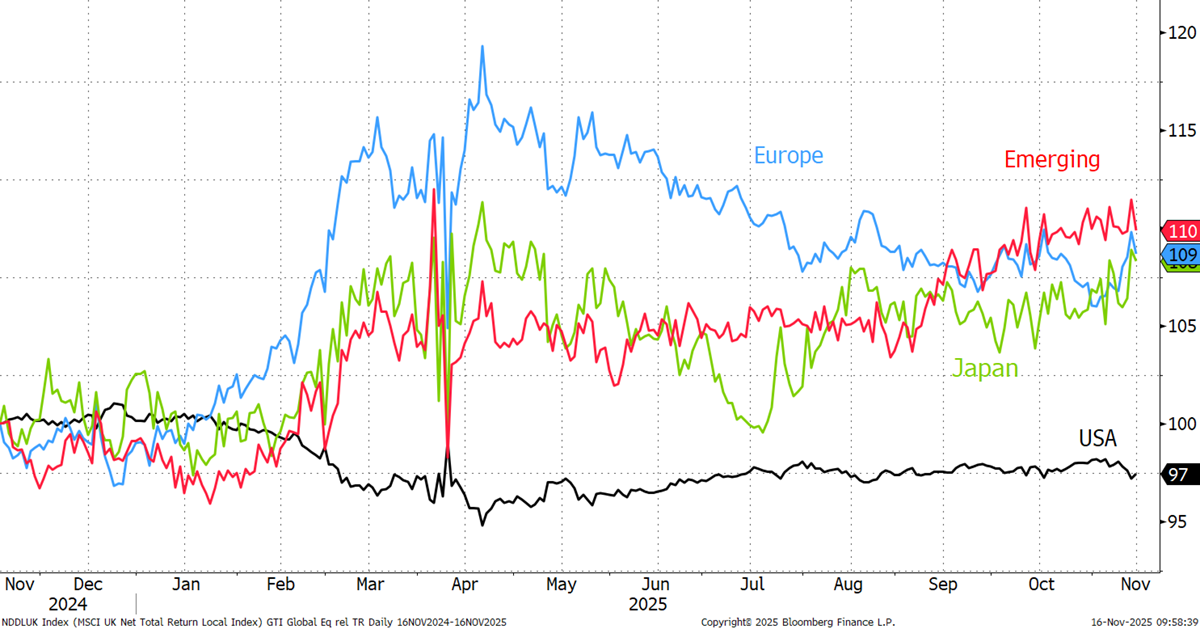
The regional CAPR is interesting as the one-year lookback begins after the US election victory. Europe, Asia, and Emerging Markets are neck and neck, around 12% ahead of the USA. It is doubtful that many investors are aware of this important shift.
CAPR: Europe, USA, USA ex Mag 7, Emerging Markets, and Japan - Past Year
The world matrix has become more granular. Before we had sectors and industries, where ten sectors weren’t enough, but over 100 industries were too many. GTI has combined the old industries into 26 groups. We hope this is the right balance between digestible data and sufficient granularity.
Asian diversified holdings, top centre, highlight the Japanese conglomerates: Hitachi, Mitsubishi Corporation, ITOCHU, Mitsui, Marubeni, Sumitomo, and Toyota Tsusho. Yet we also see strength in HK/Singapore conglomerates such as CK Hutchison, Jardine Matheson, Keppel, and Swire Pacific. Take note.
Average ByteTrend Score by Region and Industry Heatmap – CAPR
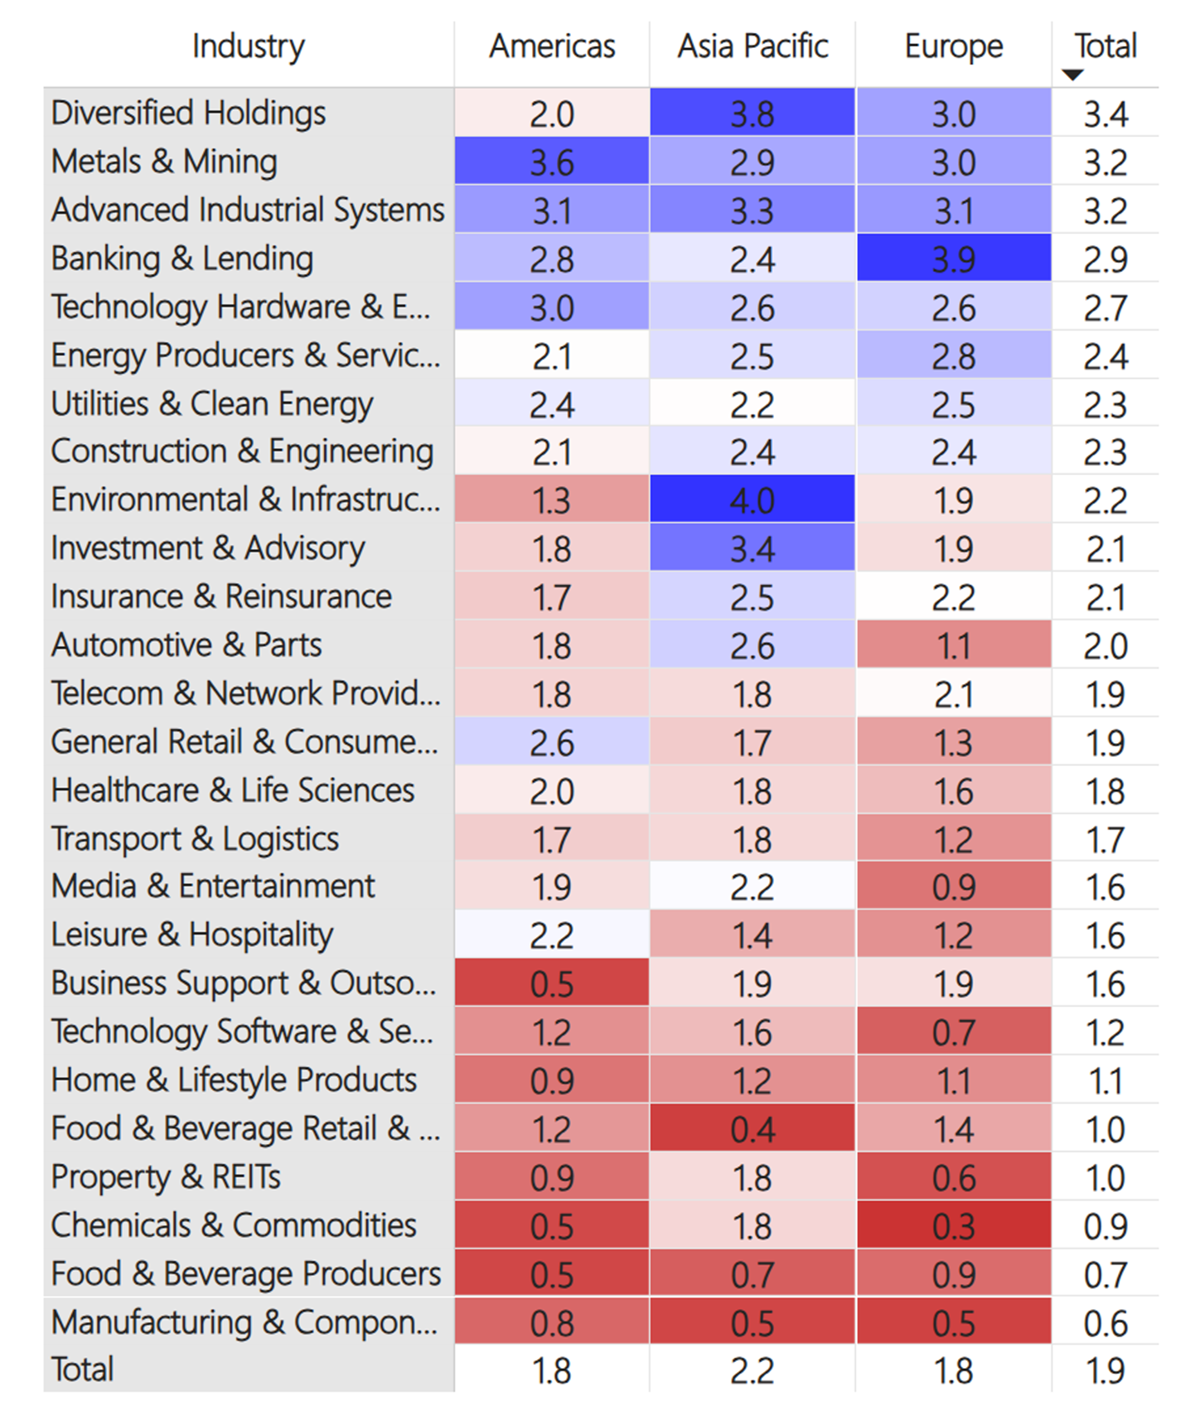
European banks are still strong, along with Asian investment and advisory, which highlights Chinese-related investment banks and brokerages. Consumer goods remain weak. Healthcare was towards the bottom but is now ranked midway.
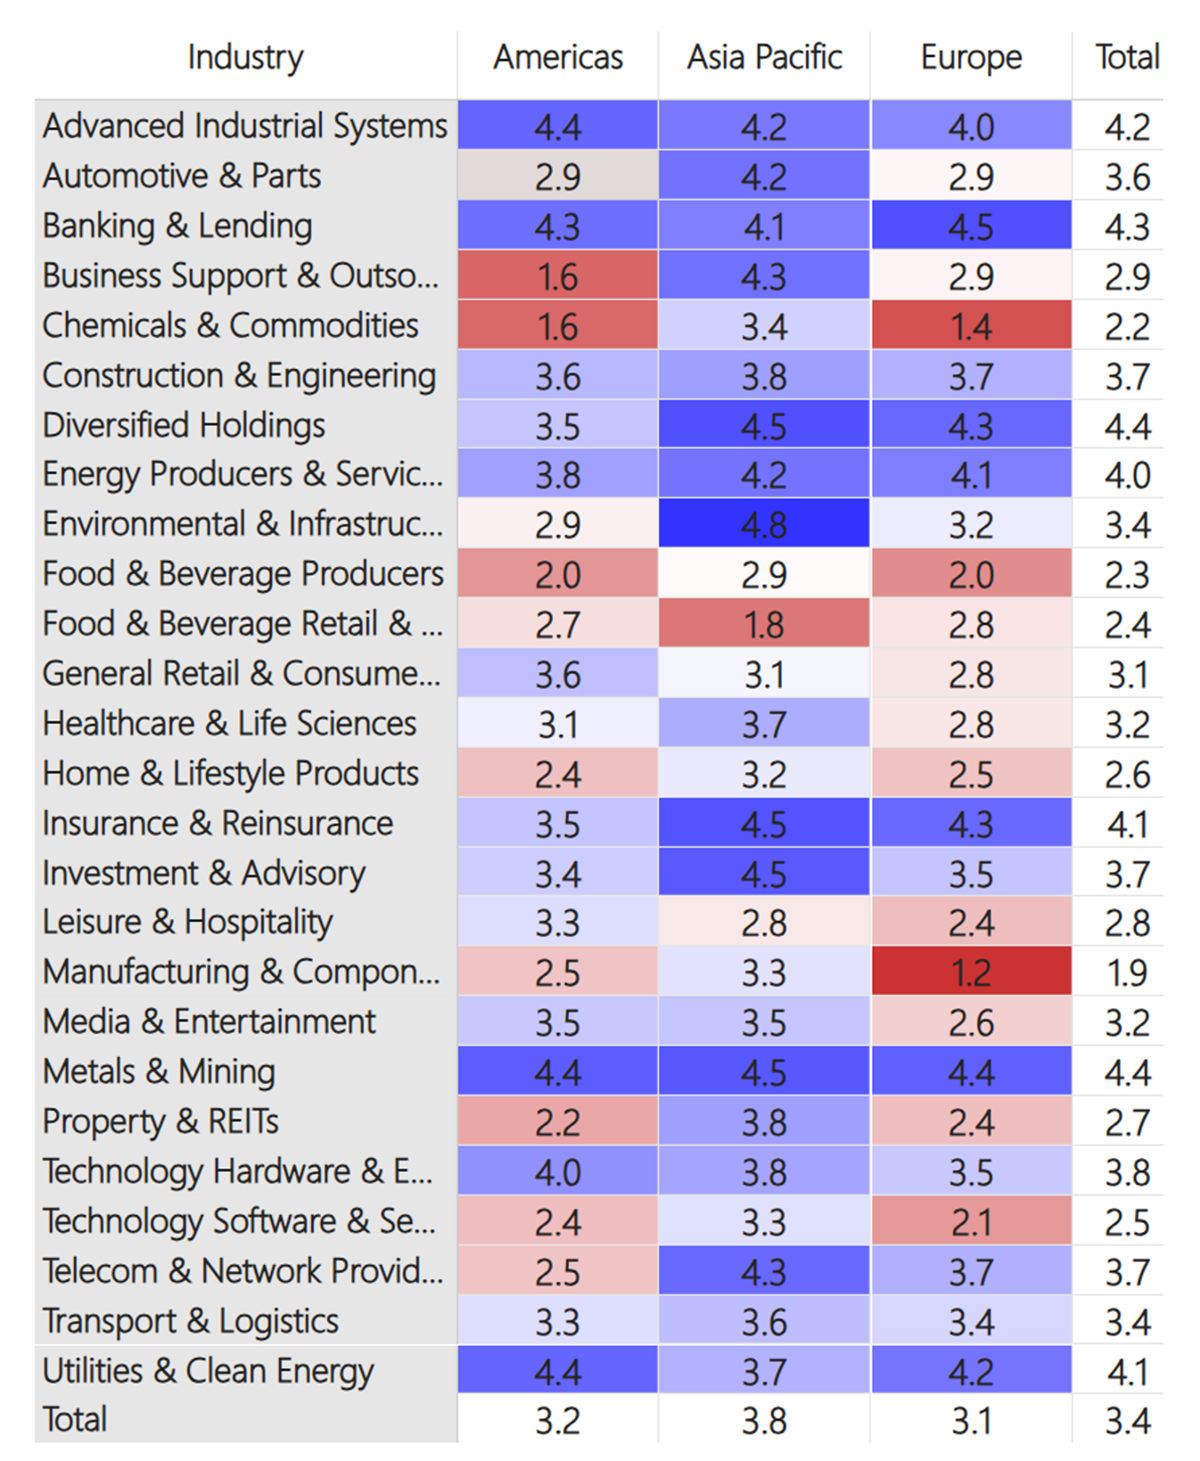
I show the beta version of the same table below in local currency instead of CAPR. It is largely blue and so less useful for identifying ideas. That’s why the version above will be the default, as it highlights alpha in both strength and weakness.
Average ByteTrend Score by Region and Industry Heatmap – Local Currency
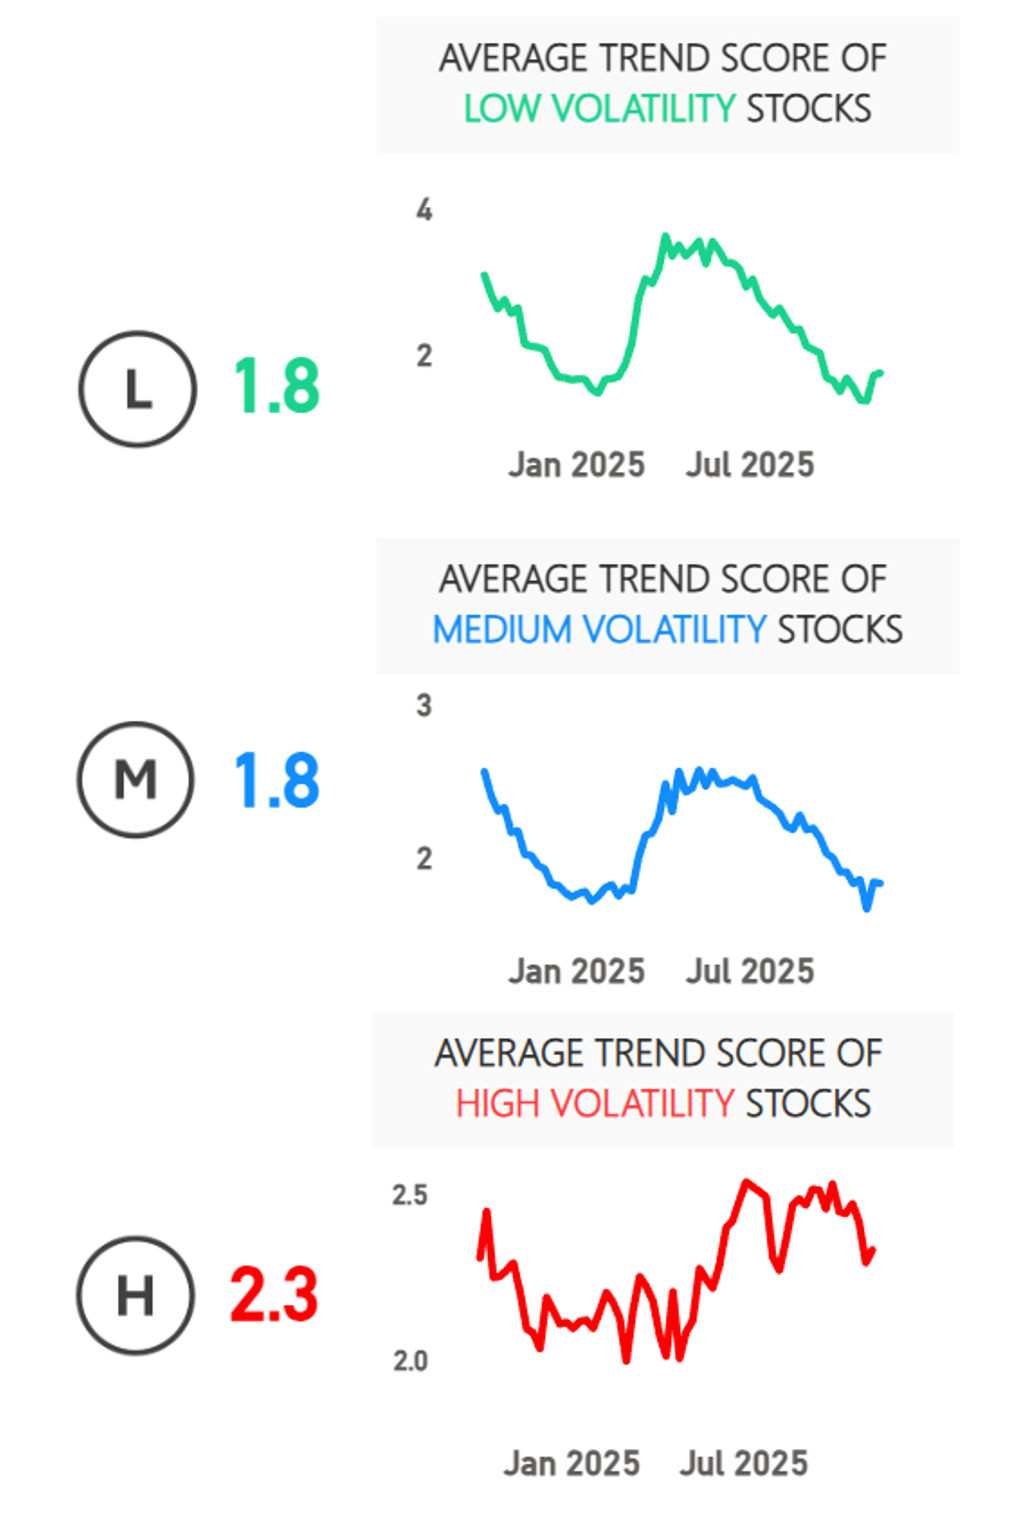
In volatility, low and medium-volatility stocks are gaining as high-volatility stocks give back.
Stock Volatility
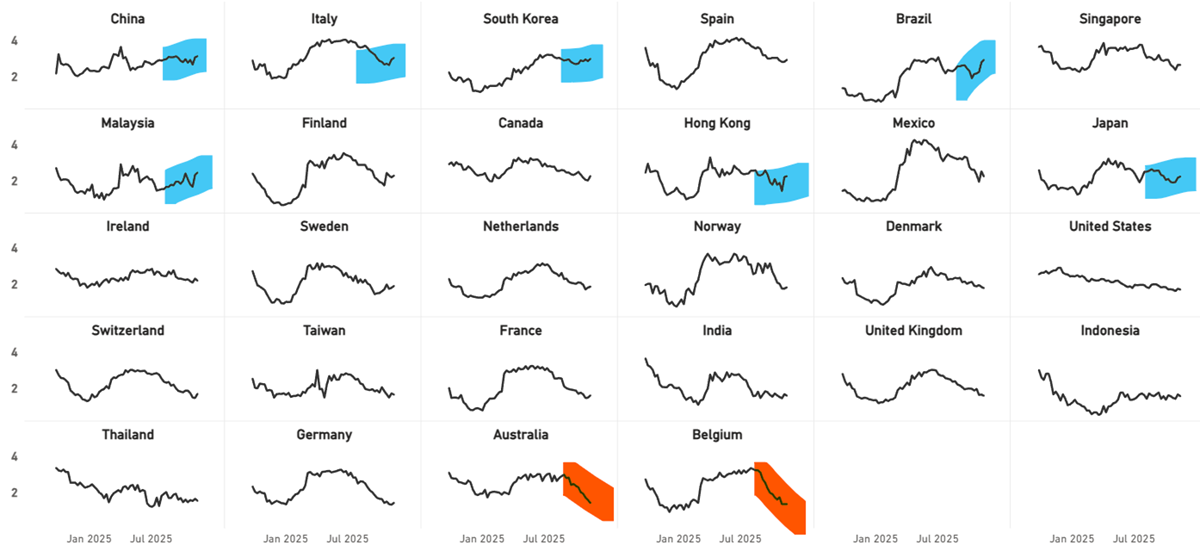
The trend changes over the past week are shown by country. Blue is strong and found in Asia and EM, but Italy also stands out. Things have turned down in Australia and Belgium.
Countries – Average Trend Score CAPR
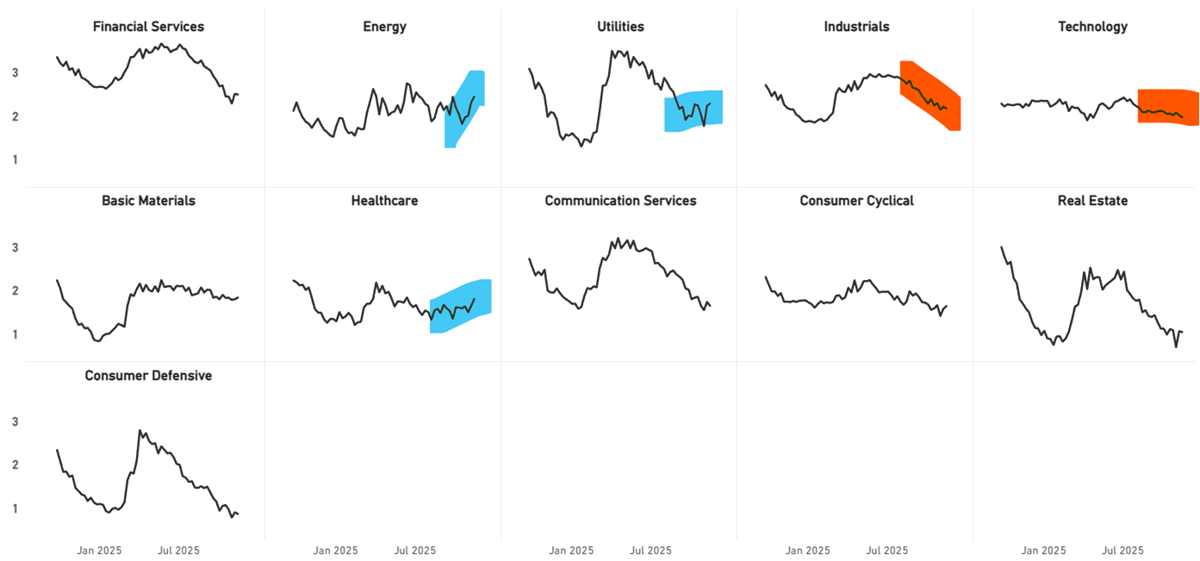
Industrials and tech slide while energy, utilities, and healthcare improve.
Sectors – Average Trend Score CAPR
Leading Trends with New Highs
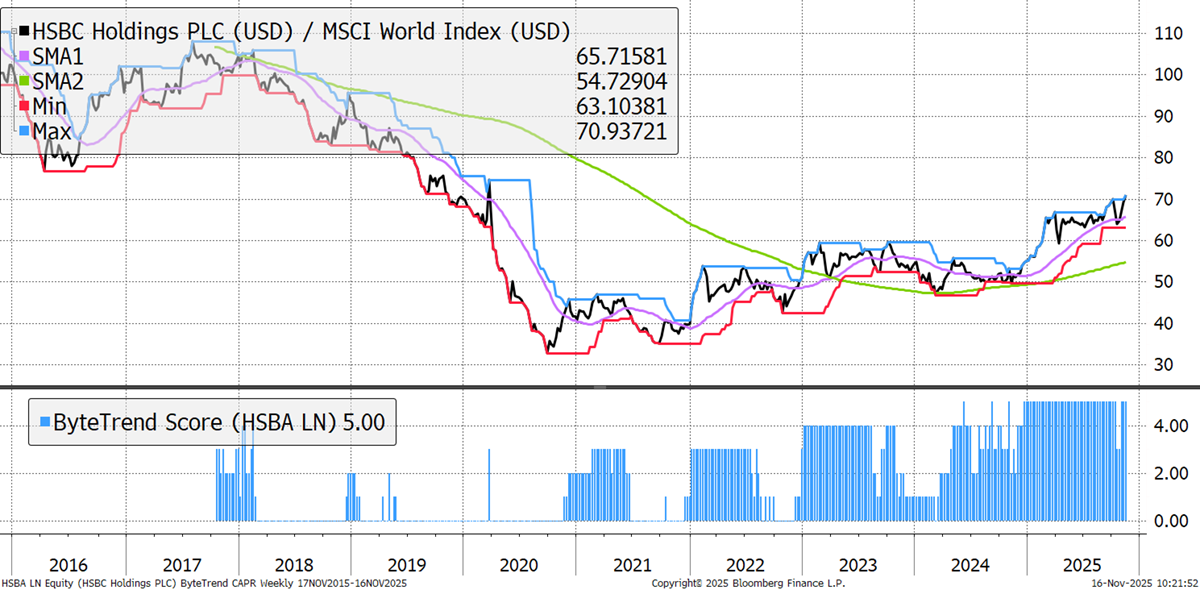
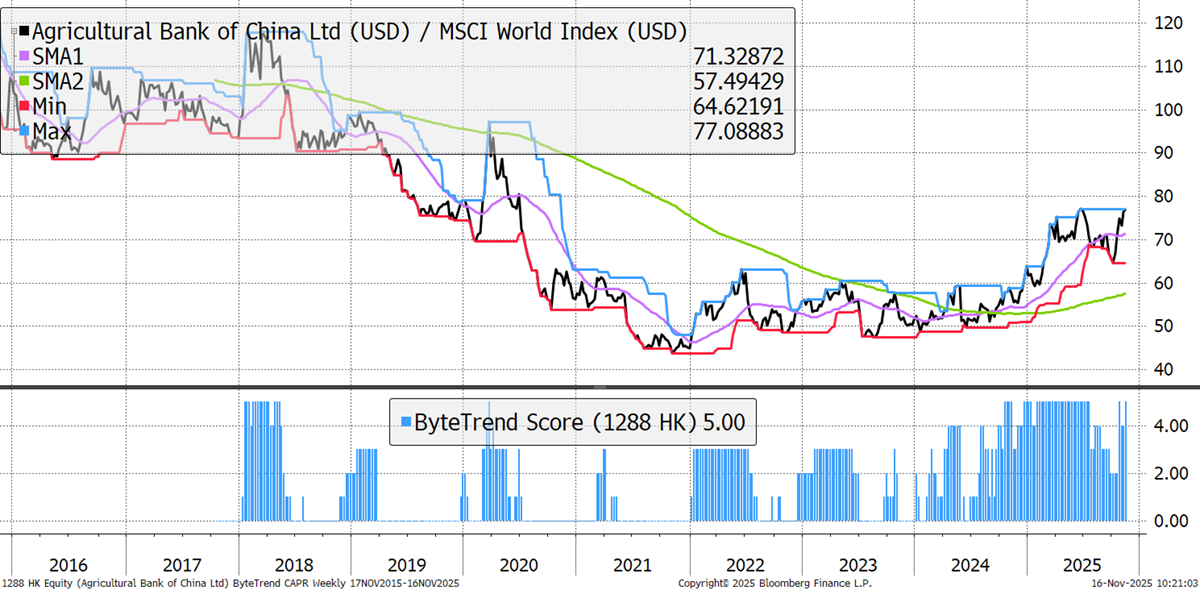
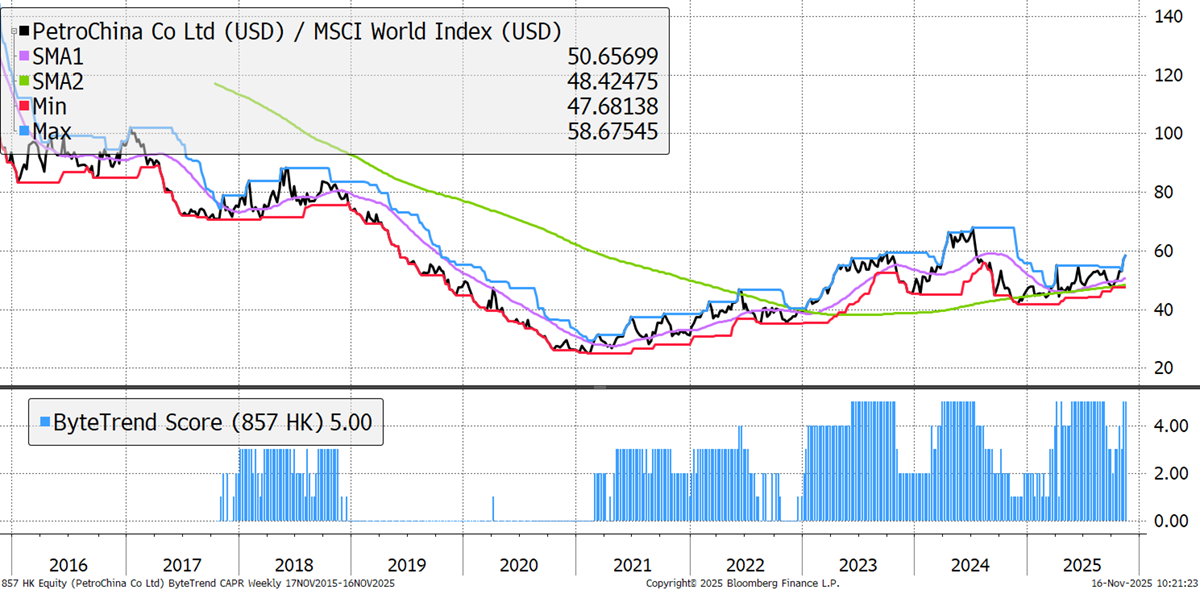
These stocks are trading at the 30-week CAPR highs with a ByteTrend Score of 5. All charts shown are CAPR rebased to 100.
| AAPL | USD | Apple Inc. |
| CSCO | USD | Cisco Systems, Inc. |
| 1288 | HKD | Agricultural Bank of China Limited |
| MU | USD | Micron Technology, Inc. |
| MS | USD | Morgan Stanley |
| HSBA | GBp | HSBC Holdings plc |
| 857 | HKD | PetroChina Company Limited |
| EL | EUR | EssilorLuxottica S.A. |
| SAN | EUR | Banco Santander, S.A. |
| 2628 | HKD | China Life Insurance Company Limited |
| WELL | USD | Welltower Inc. |
| BBVA | EUR | Banco Bilbao Vizcaya Argentaria, S.A. |
| ENEL | EUR | Enel S.p.A. |
| ENR | EUR | Siemens Energy AG |
HSBC
HSBC is well placed to benefit from the Hong Kong revival, which is evident in GTI. The list covers several Chinese banks, which is an interesting development in the global leadership.
Agricultural Bank of China
Agricultural Bank has appeared repeatedly in the Leading Trend category this year. After a short correction, it is back in front.
PetroChina
Energy is the second-strongest sector, despite an oil price that is struggling to break out. Natural gas is strong, and energy demand is robust despite the low oil price due to oversupply. HK-listed 857 still offers good value with a 9% free cash flow yield.
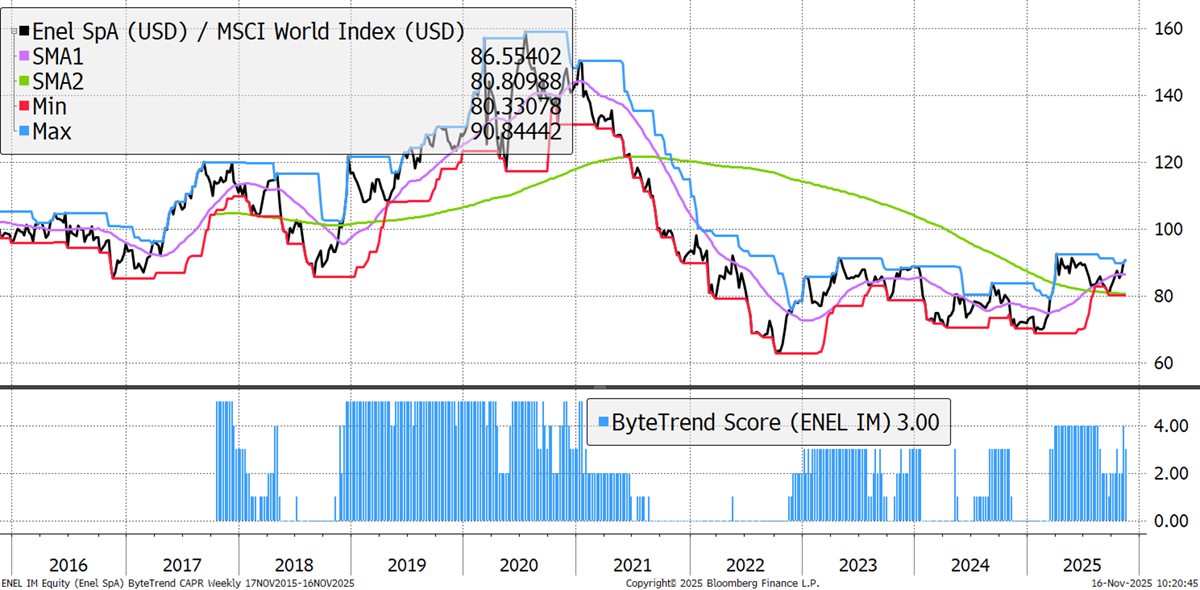
Enel
Enel delivered strong earnings. It is surprising how well the sector has held up despite the slide in the oil price.
There are 131 additional leading trends with new highs in the GTI universe. Brazil, Japan, Hong Kong, and Europe dominate the list. Banking and lending dominate, with strong showings from energy, healthcare, and utilities. Japanese conglomerates are enjoying a strong group move.


