
Volatility Surges in Energy Shock


Issue 56;
- Energy surges as the conflict in Iran escalates, and the dollar strengthens.
- Technology is well insulated, boosting US equities.
- Problems in private markets deepen.
Global Trends is a deep dive into global equities. The aim of this analysis is to better understand which countries, sectors, industries, and stocks are driving market returns. Not only does it help investors identify opportunities, but it also highlights the risks. We try to condense as much important information as possible, focusing on what really matters each week. Embrace this as a weekly discipline, and you’ll soon have a much better understanding of global financial markets.
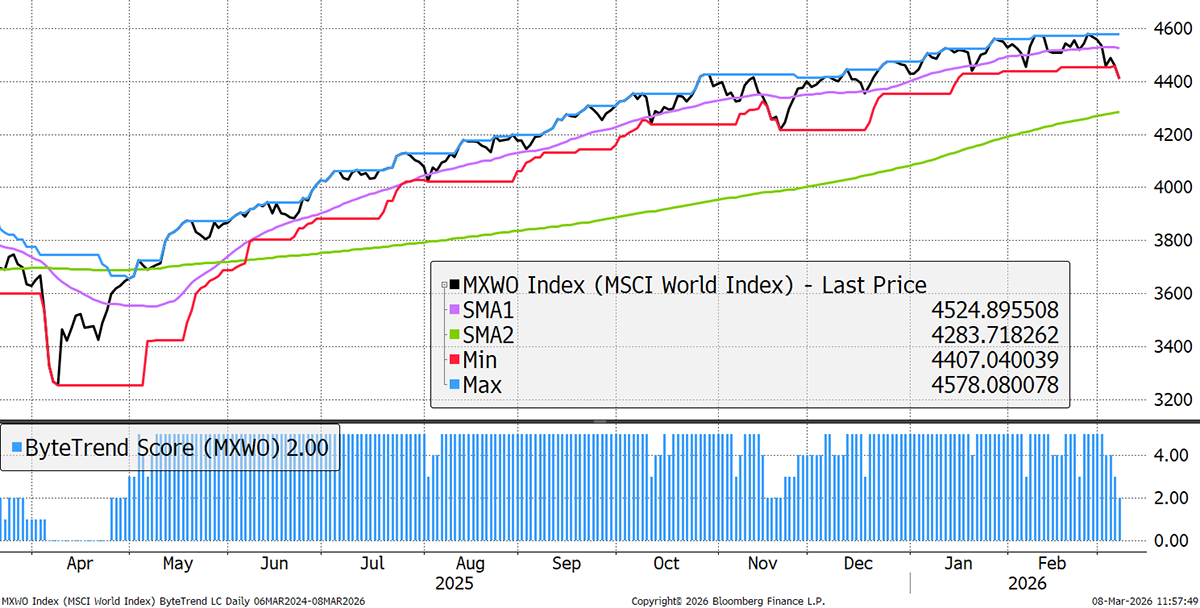
The World Index drops to a ByteTrend Score of 2 in USD. It is not just an oil shock, but a break in the bond market, delaying rate cuts. Higher inflation expectations, mayhem in commodities and shipping, and, to add to that, a break in private markets.
World Index – Developed Markets – Daily
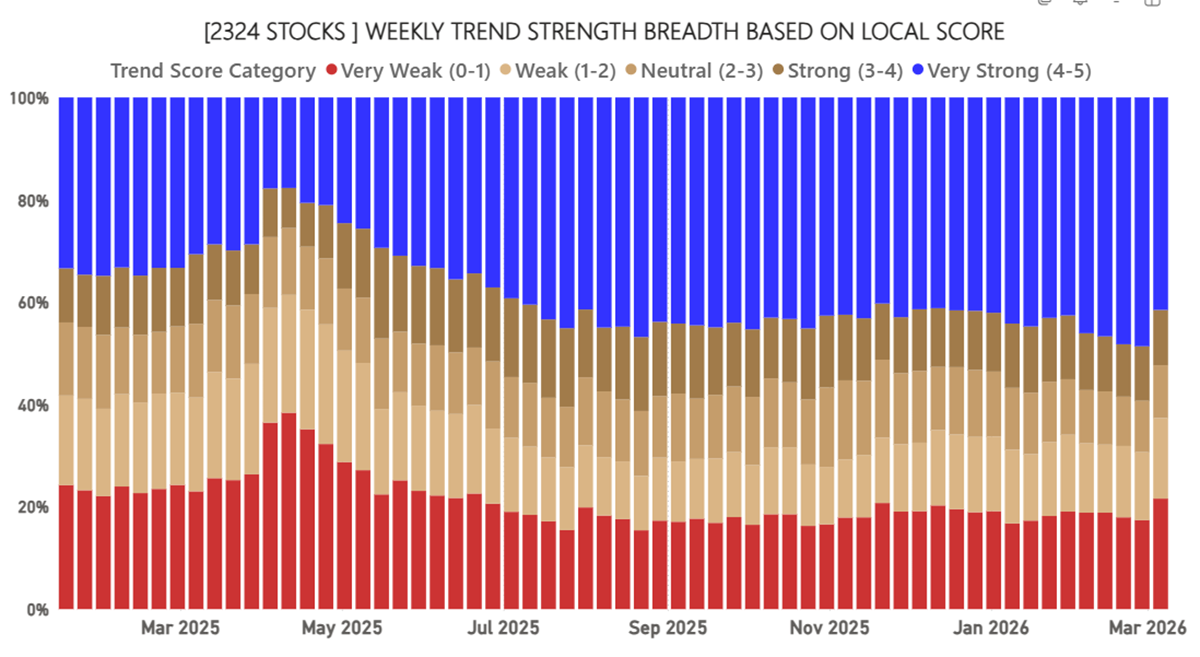
Global Equity Breadth – Local Currency
The breadth is now weakening as the red bear trends grow and the blue strong trends retreat. This data is as of Friday, and it would be even worse today.
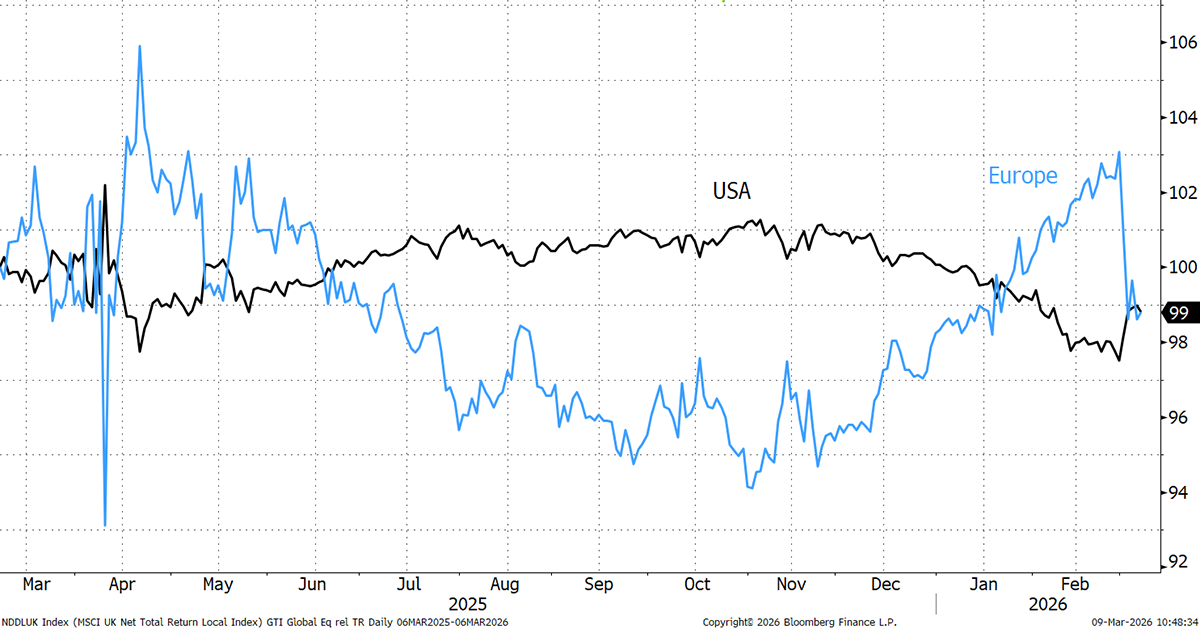
Mean Reversion
Europe gives back its CAPR gains while US equities gain.
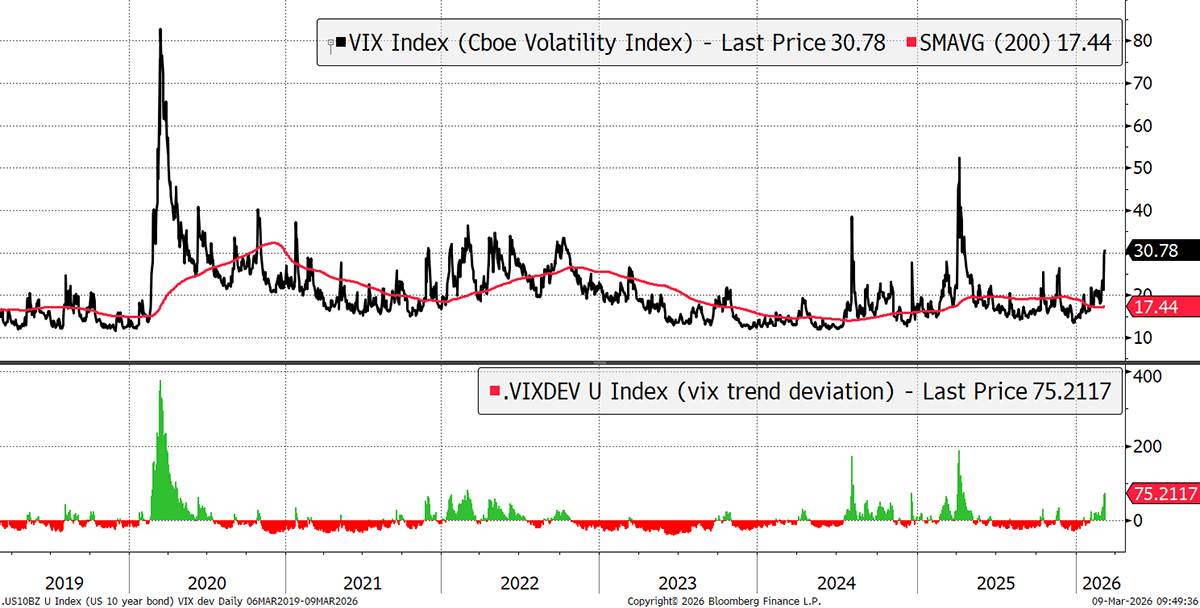
Volatility Spikes
The VIX has jumped again over the weekend, but it is still below the yen rally in 2024 and the tariff crash last year. The risk is that it continues to rise.
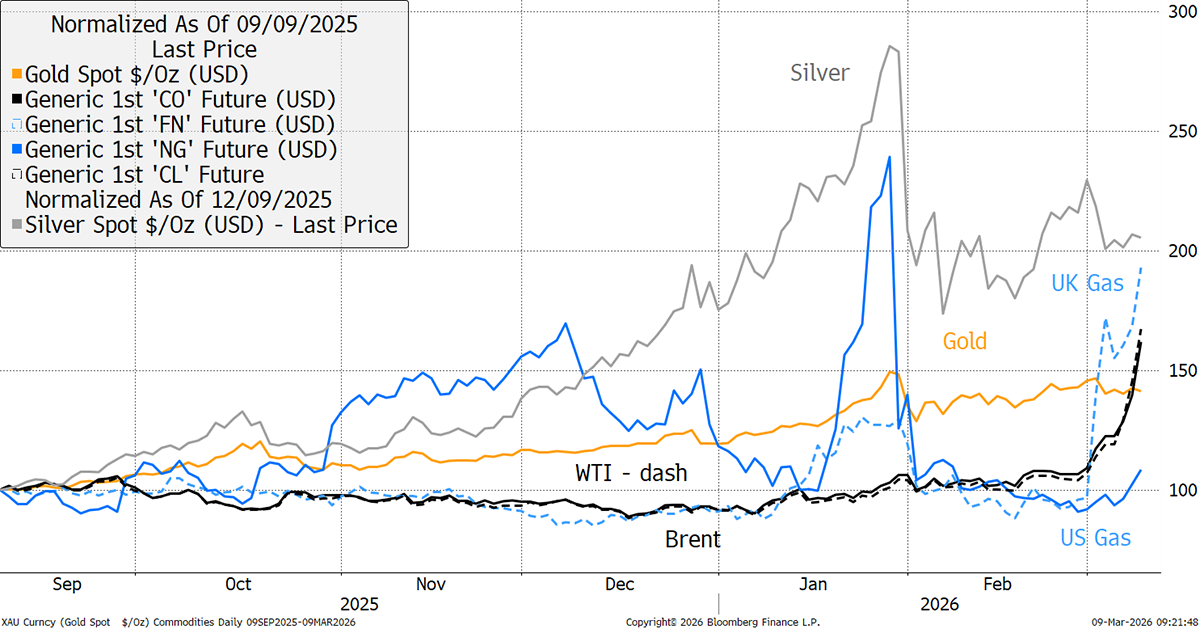
Commodity Prices
Oil prices in the US (WTI) and globally (Brent) have risen together, yet natural gas prices have diverged significantly. Gold and silver frame the scale of the moves over the past six months.
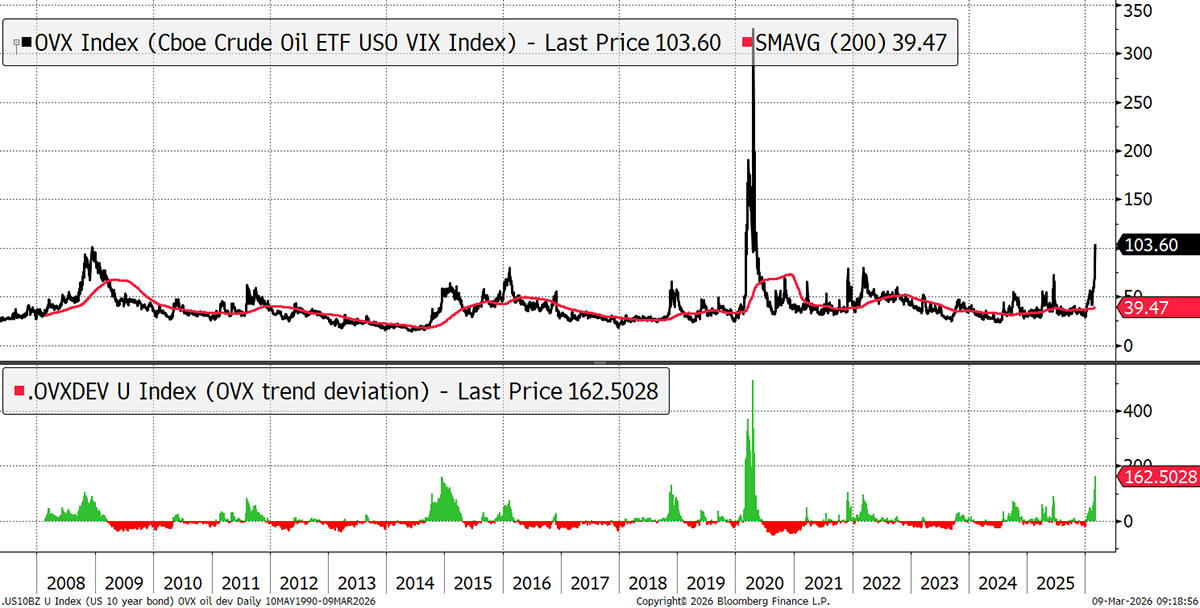
Oil VIX (OVX)
Oil options highlight the extent of the uncertainty. OVX is already higher than in 2008, but below the Covid shock, when prices collapsed.
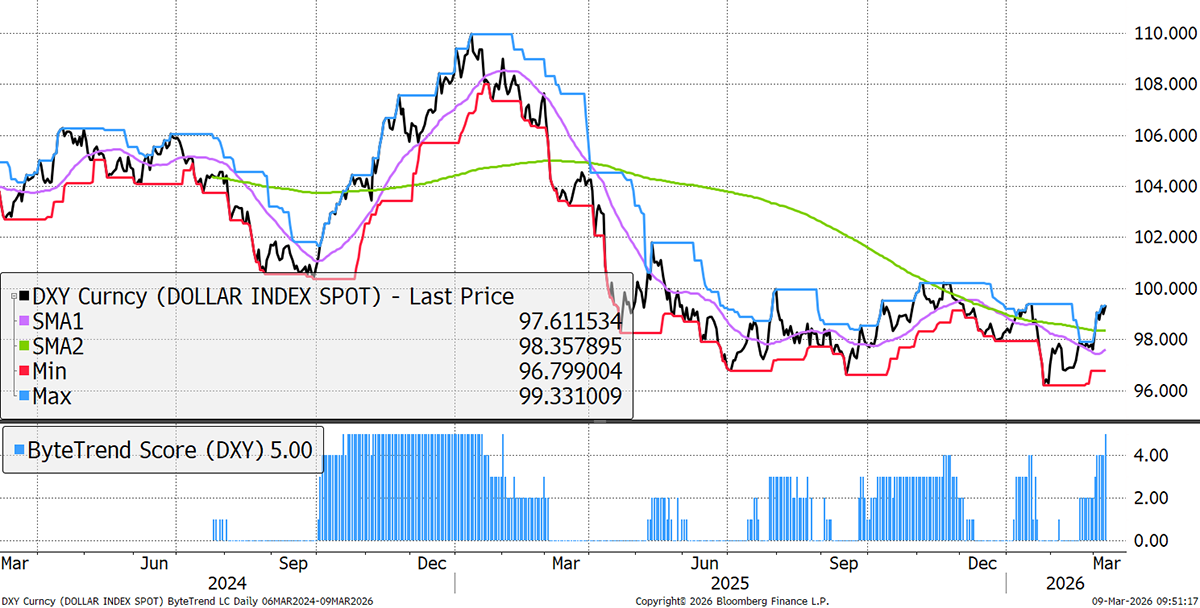
Dollar
Dollar weakness has been a key driver of this equity bull market. This has reversed, and the dollar is in an uptrend for the first time in a year.
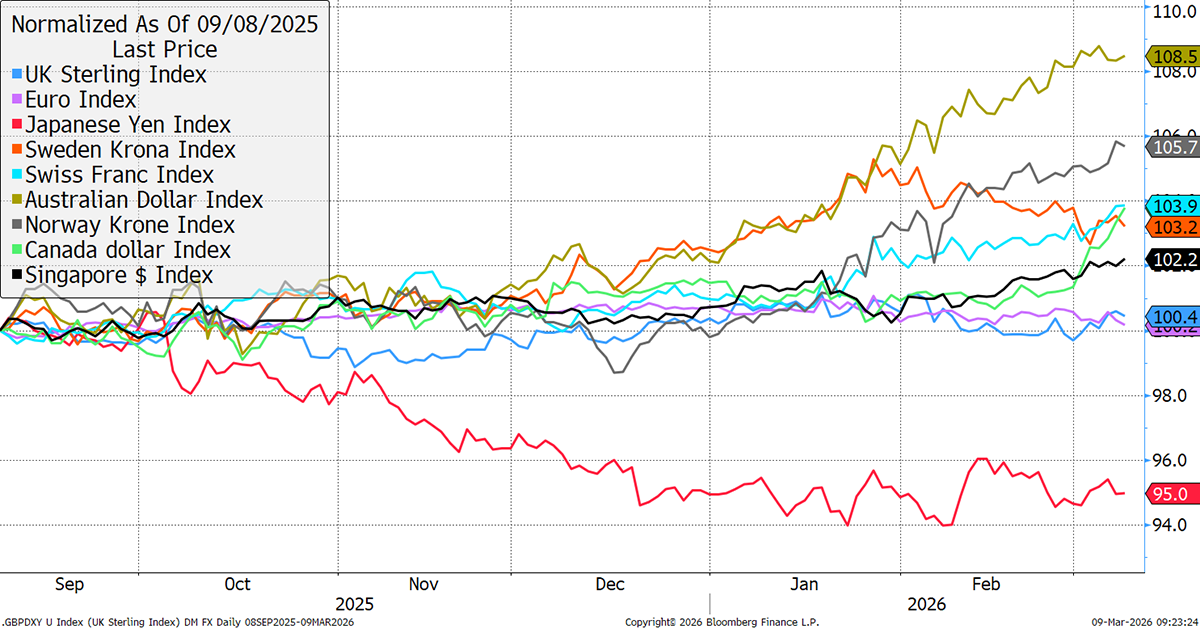
Major Currencies
Looking at FX cross rates (dollar stripped out), the Aussie is the strongest, followed by the Nokkie. The Stokkie has turned down. The Yen is strengthening. Sterling and the Euro are flat.
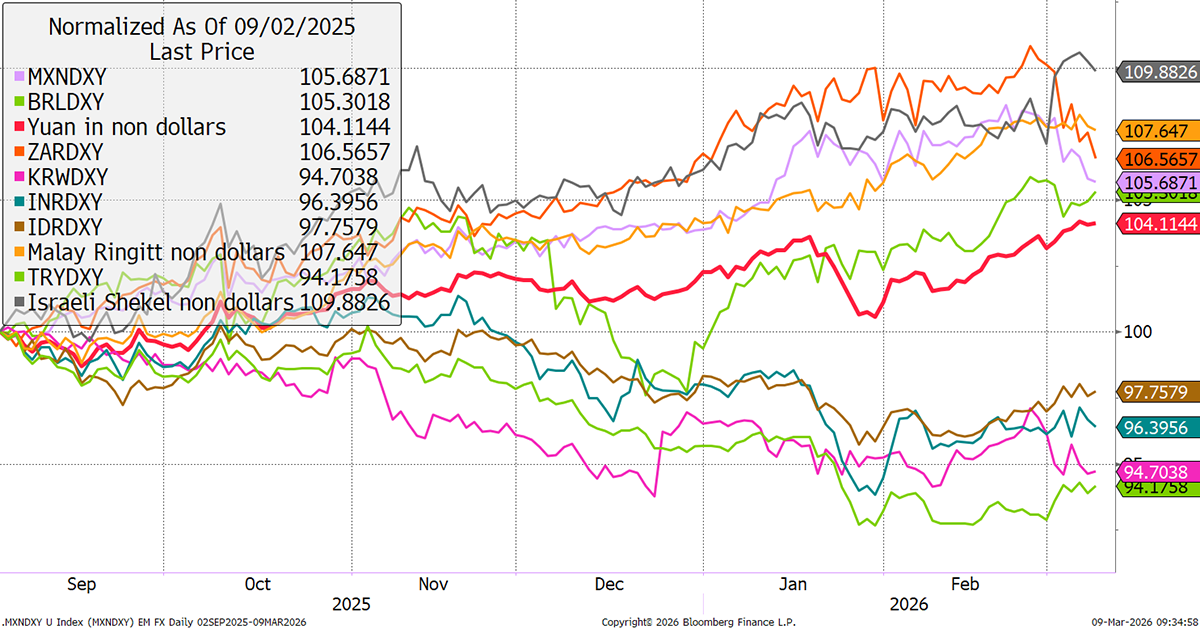
EM Currencies
The Israeli Shekel is the strongest currency. Mex has turned down along with the Rand. Chinese Yuan is strong. Generally speaking, EM FX is doing well.
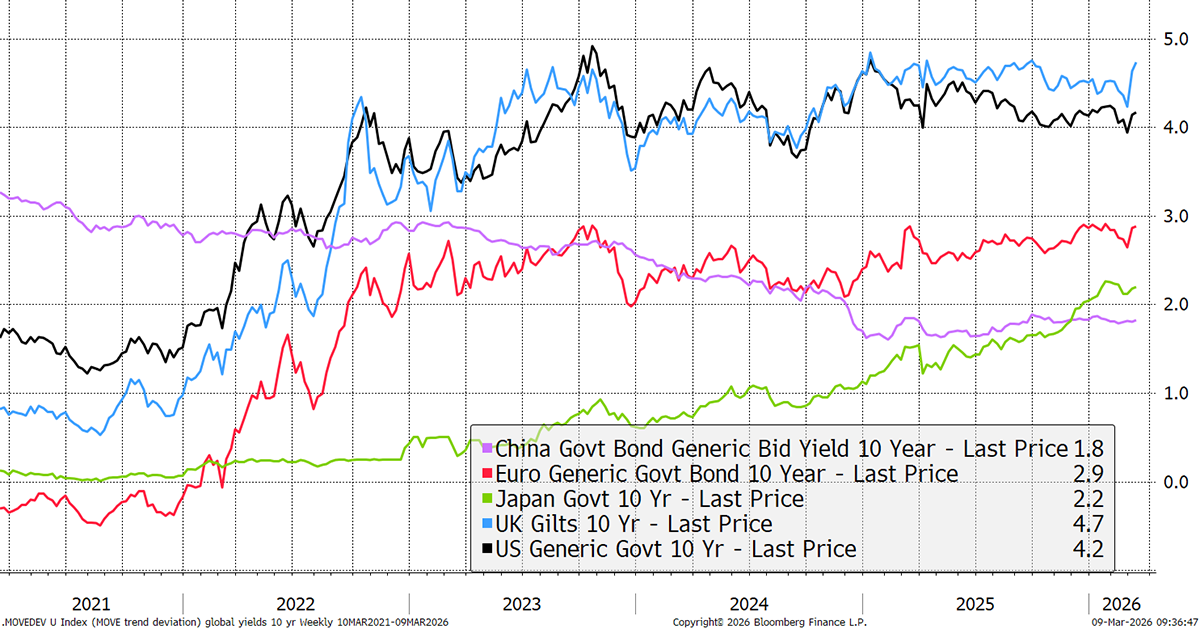
Global 10-Year Yields
Yields are up, except in China, which is interesting. Rate cuts now seem less likely.
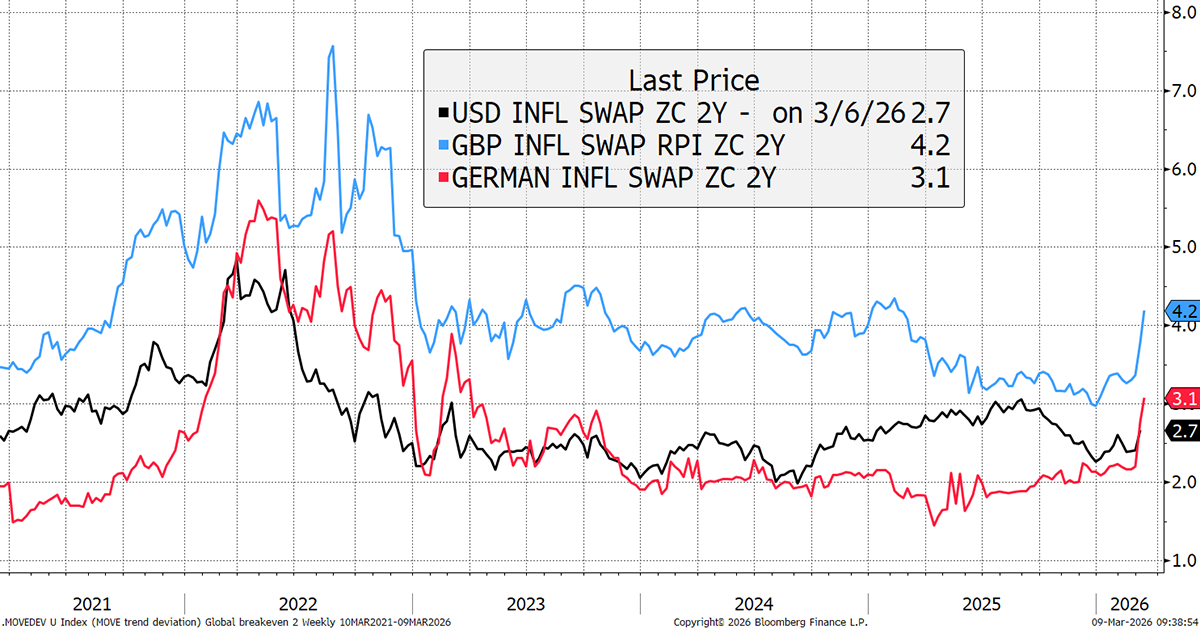
Two-Year Inflation Expectations
Breakevens, inflation expectations, have risen with the oil price.
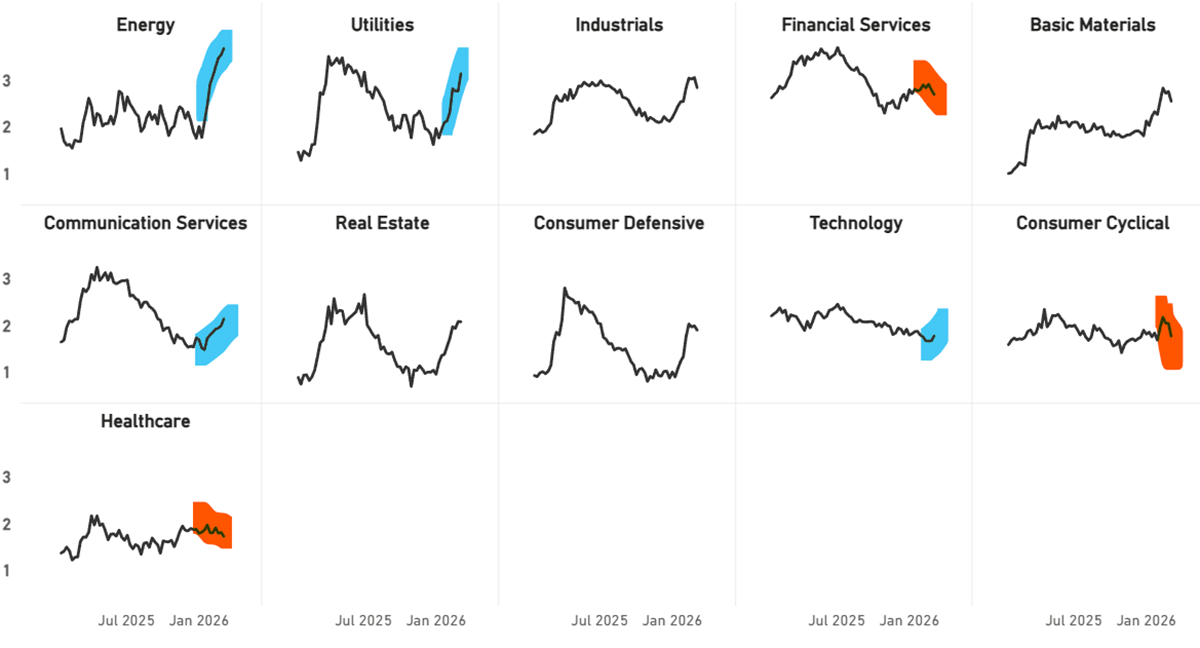
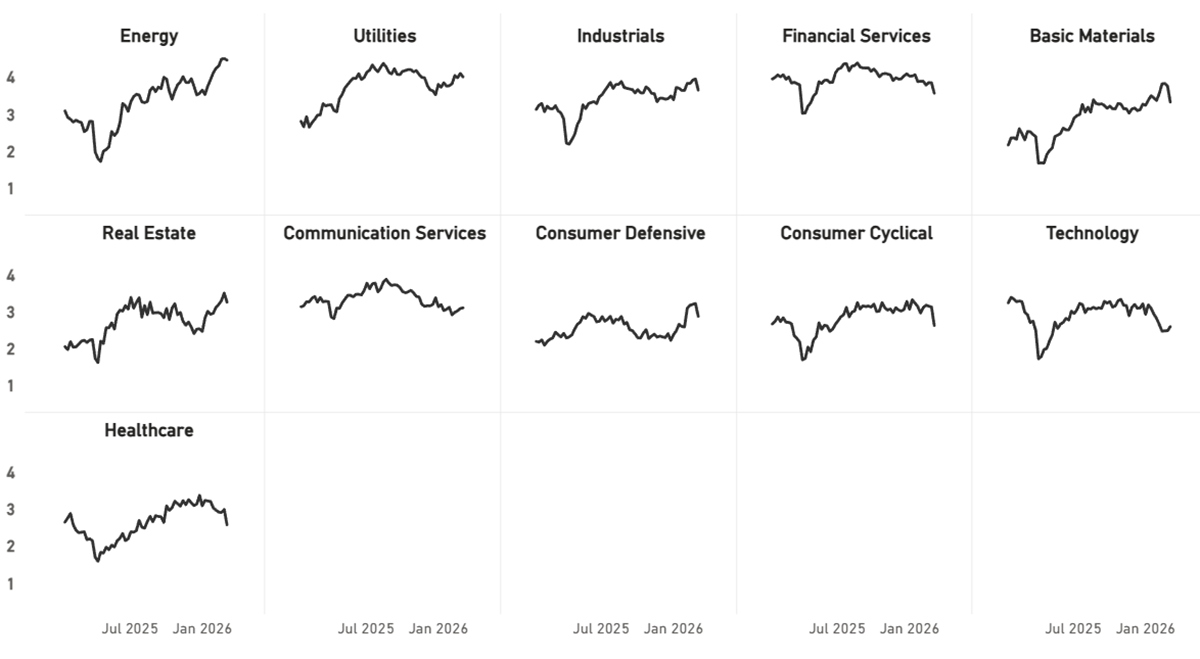
Sector Trends in CAPR
Energy is the most defensive sector alongside Utilities. Finance, Cyclicals, and Healthcare have turned down. Technology is stronger, which is a notable change. The virtual world has its advantages during times of war.
Sector Trends in Price
That said, in terms of price, most sectors are weaker.
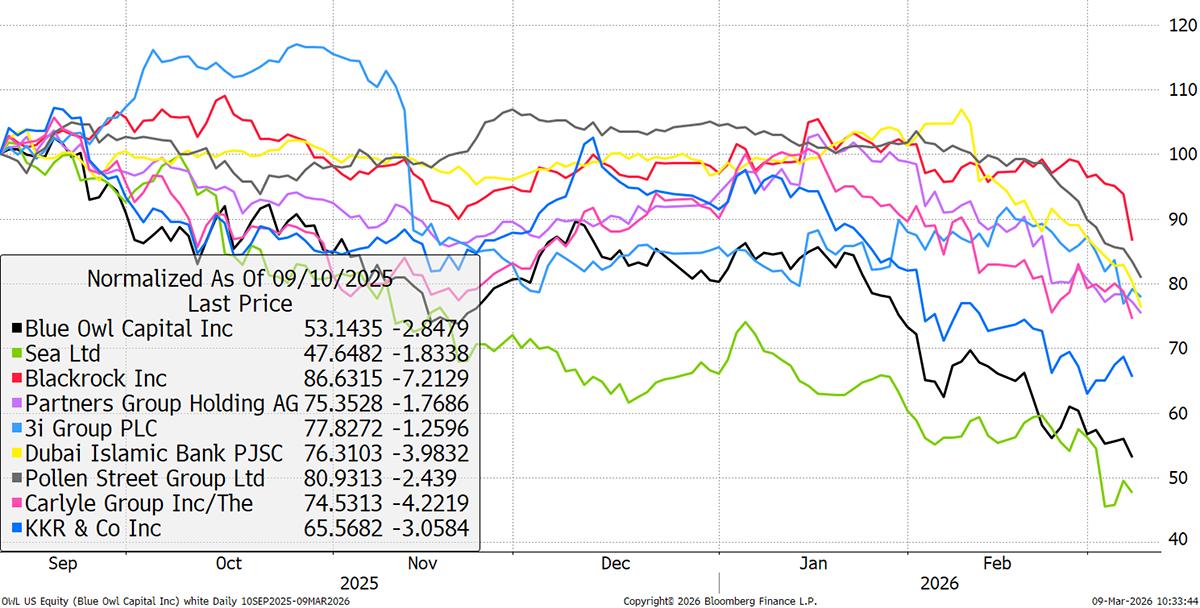
Private Markets
Private Equity and Private Credit have turned down.
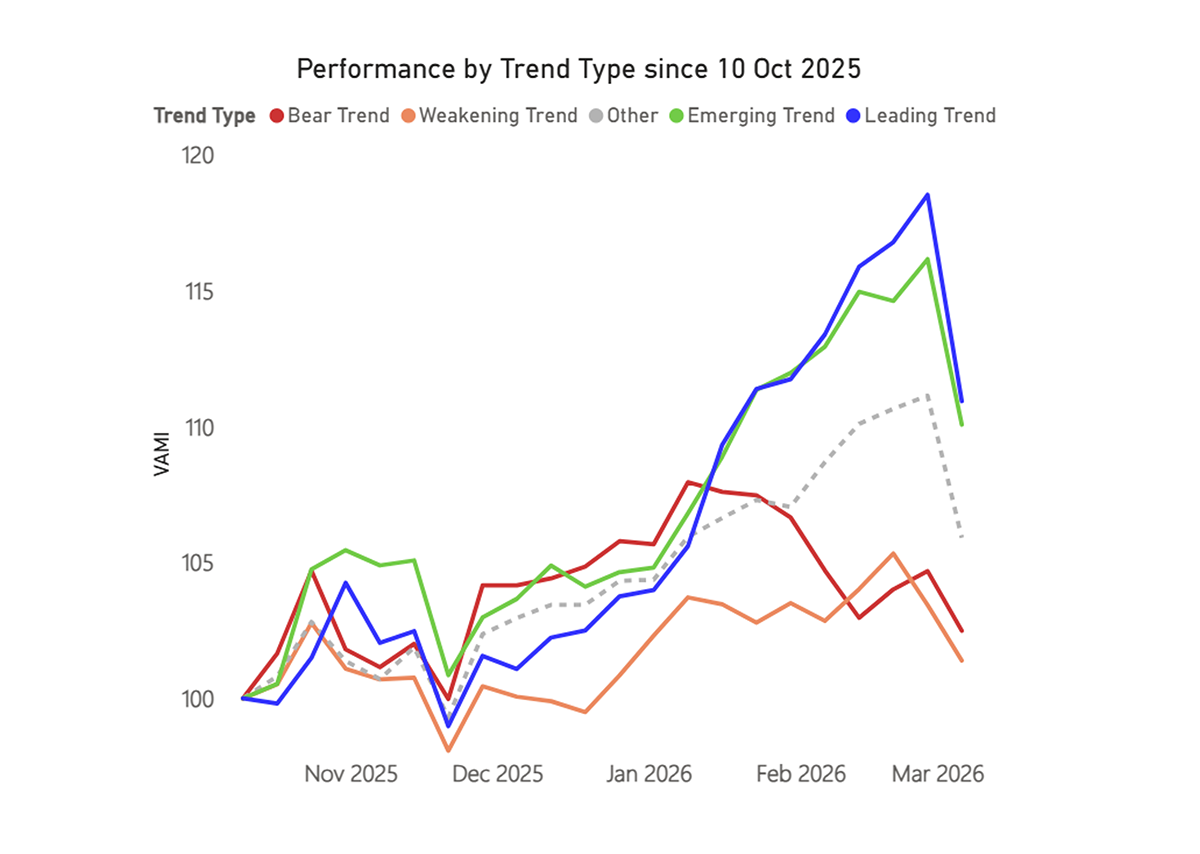
Trend Type Performance
Starting last October, the trends by strength are grouped in the order you might expect to see. The leaders are still up the most, and the weakening and bear trends have performed the worst.
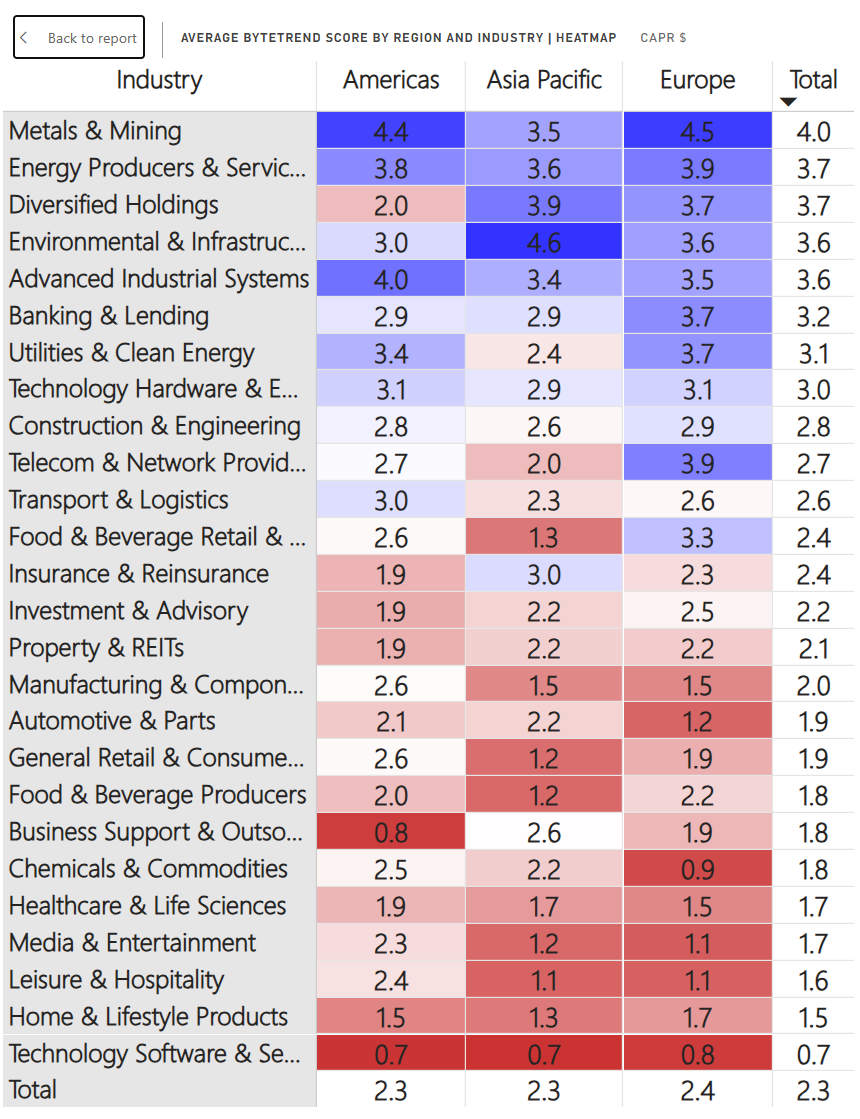
Regions and Industries Average CAPR Score
Metals and Mining are weakening at the top, as are Diversified Holdings, Advanced Industrials, Banking & Lending, and Technology Hardware. Lower down, Manufacturing & Components are notably weak, and Home & Lifestyle products have sunk to the second-lowest rank. Chemicals, which had been surging, have paused.
Of the strong trends, only Energy Producers and Utilities & Clean Energy are up in recent weeks. Food & Beverage Retailers also rose slightly this week, while Media & Entertainment are back on the up as Netflix has reversed sharply higher following the news that it had stepped away from the Warner Bros bidding war. While Tech Hardware dipped, Software managed a slight rise, as it was oversold and is less impacted by the physical impacts of war and rising energy costs. However, it remains the weakest industry.
With Media & Software resilient, and Hardware / Real Economy Industries weak, these moves are a reversal of 2026’s main trends so far, in which hard was beating soft. The digital economy is less affected by war than the physical one.
User Guide
Refer to our GTI: User Guide for an overview of the key concepts and terminology used in this report. These concepts may take a little bit of getting used to, but they are very powerful once you do.
How to Read the Tables
The Value Composite Score (Value) is measured against the company’s own financial history and not in absolute terms. The columns are Cheap (Chp), Value (Val), Fair Value (FV), Overvalued (OV), and Expensive (Exp). The Growth Composite Score (Growth) is measured by sales, earnings, cash flow, dividends, and book value on a per share basis. The columns are High, Good, Medium (Med), Low, and Negative (Neg).
Leading Trends with New Highs
These stocks are trading at the 30-week CAPR highs with a ByteTrend Score of 5. All charts shown are CAPR rebased to 100.
| Name | Annual Vol 30w | Mkt Cap $Bn | Value | Growth |
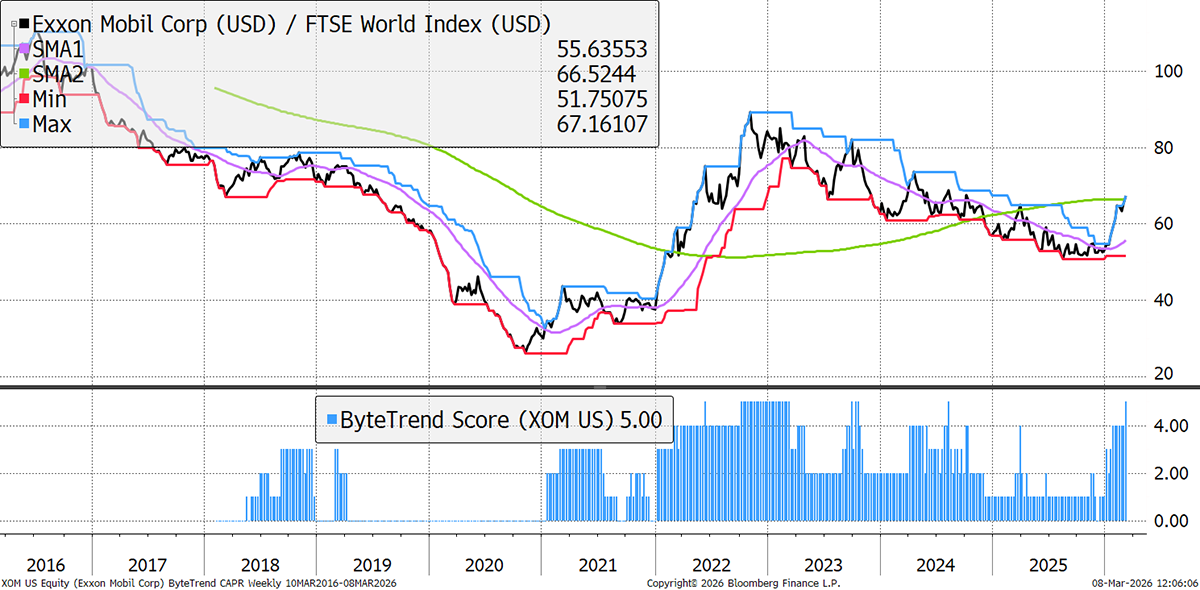
| Exxon Mobil Corporation | 18 | 630 | OV | Med |
| PetroChina Company Limited | 28 | 326 | OV | Good |
| RTX Corporation | 24 | 282 | OV | Med |
| Shell plc | 18 | 237 | OV | Med |
| The TJX Companies, Inc. | 13 | 177 | OV | Good |
| TotalEnergies SE | 18 | 168 | OV | Neg |
| Lockheed Martin Corporation | 23 | 155 | OV | Med |
| HCA Healthcare, Inc. | 21 | 119 | OV | Med |
| China Shenhua Energy | 21 | 115 | Exp | Med |
| CME Group Inc. | 20 | 114 | OV | Neg |
| Petróleo Brasileiro S.A. - Petrobras | 29 | 112 | FV | Neg |
| Mitsui & Co., Ltd. | 26 | 107 | Exp | Good |
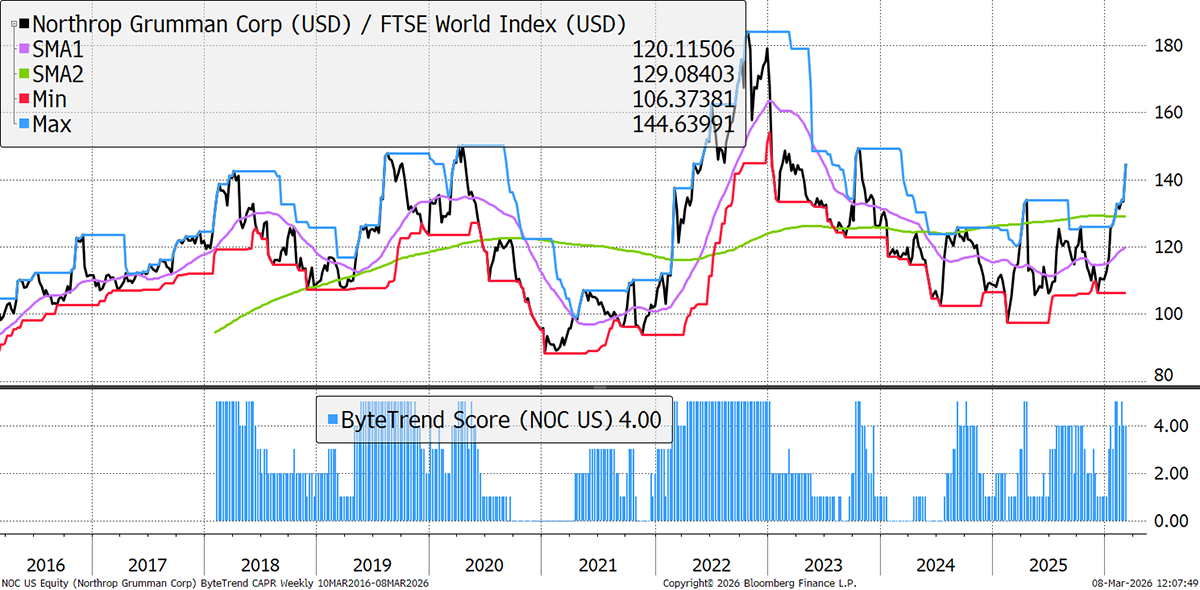
| Northrop Grumman Corporation | 20 | 107 | OV | Good |
| General Dynamics Corporation | 16 | 98 | FV | Med |
| Canadian Natural Resources | 24 | 97 | OV | Low |
| Canadian Imperial Bank of Commerce | 15 | 92 | OV | Med |
| The Williams Companies, Inc. | 23 | 91 | Exp | Med |
| BAE Systems plc | 37 | 87 | OV | Good |
| Kinder Morgan, Inc. | 19 | 75 | OV | Low |
| Eni S.p.A. | 18 | 70 | OV | Med |
| Ross Stores, Inc. | 17 | 69 | OV | Med |
| L3Harris Technologies, Inc. | 19 | 69 | OV | Med |
| Valero Energy Corporation | 35 | 69 | OV | Med |
| Suncor Energy Inc. | 21 | 68 | OV | Med |
| Phillips 66 | 31 | 67 | OV | Med |
| Singapore Telecommunications Limited | 19 | 65 | OV | Good |
| HOYA Corporation | 23 | 61 | OV | High |
| Imperial Oil Limited | 32 | 59 | OV | High |
| National Bank of Canada | 17 | 54 | OV | Med |
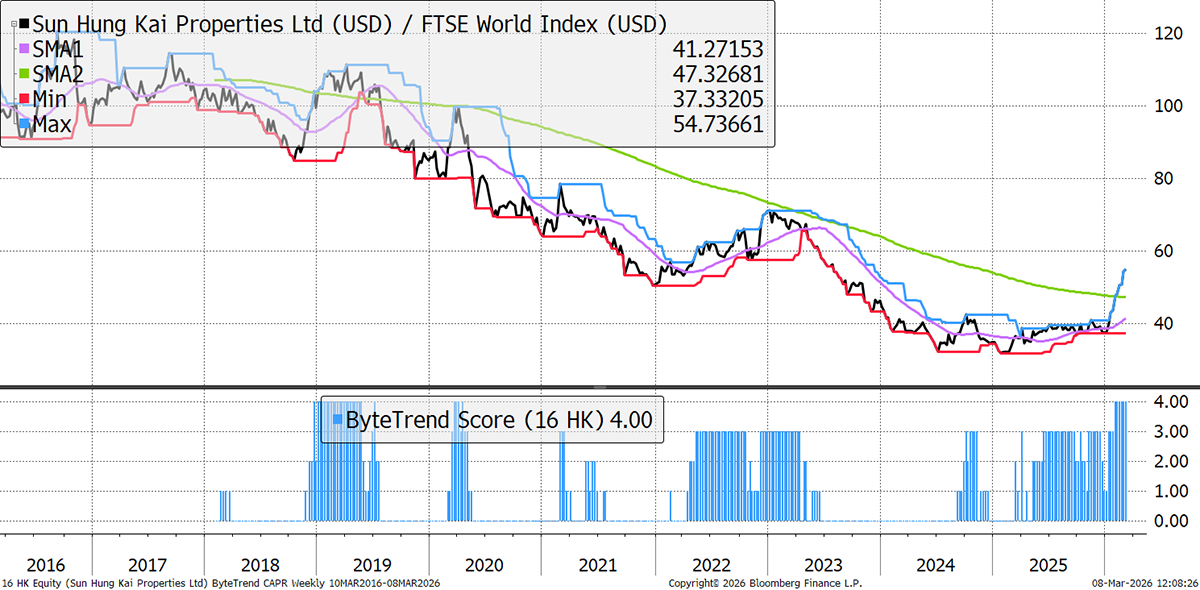
| Sun Hung Kai Properties Limited | 29 | 53 | FV | Neg |
| Hanwha Aerospace Co., Ltd. | 66 | 51 | Exp | High |
| Targa Resources Corp. | 29 | 51 | Exp | High |
| Disco Corporation | 51 | 51 | Exp | Good |
Exxon
This oil giant just delivered its highest annual production in over 40 years. This record upstream production was driven by assets in the Permian basin (shale) and Guyana (offshore). It invested in times of a weak oil price, and is naturally benefitting from the spike.
Northrop Grumman
NOC has lagged the broader defence theme, but even the relative losers in defence are winning now. Its backlog reached record levels, as with most of its peers, and it is expanding production capacity to meet it. Among their offerings, their B-2 stealth bombers and missile defence systems have been most prominently in the headlines this week.
Sun Hung Kai Properties
Sun Hung Kai is Hong Kong's largest property developer, building and selling high-end homes, offices, shopping malls, and industrial spaces. It also earns a steady rental income from its vast portfolio and operating-related businesses, such as telecom, hotels, and transport. It just posted 17% profit growth.
New Leading Trends
These stocks are trading at the 30-week CAPR highs with a ByteTrend Score of 5, except they are new trends this week, having previously had a score below 5. All charts shown are CAPR rebased to 100.
| Name | Annual Vol 30w | Mkt Cap $Bn | Value | Growth |
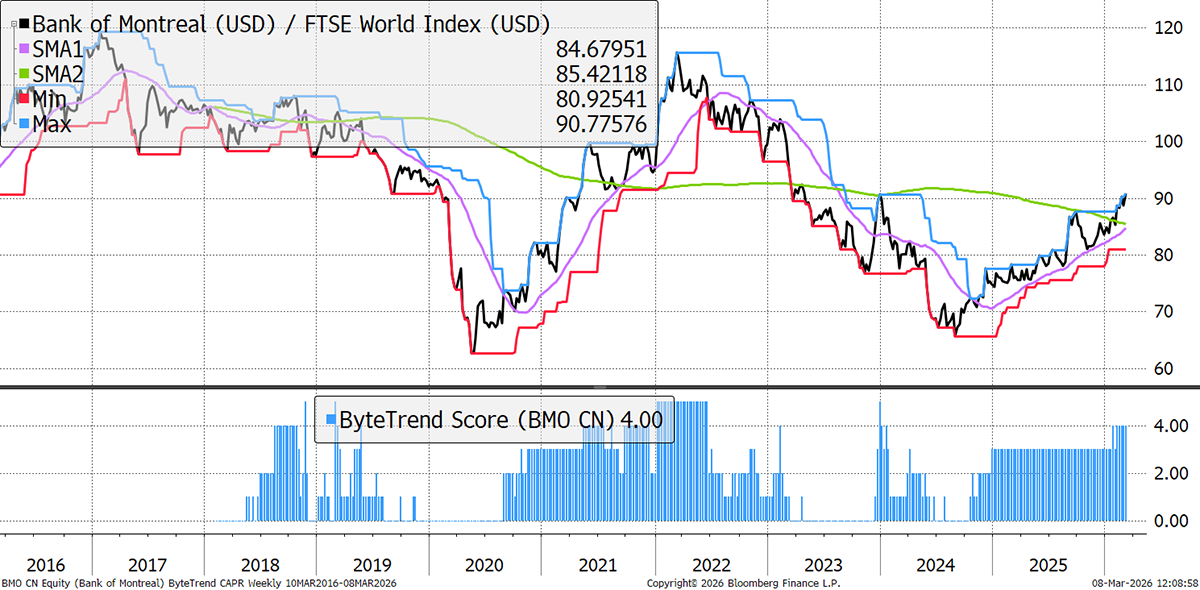
| Bank of Montreal | 15 | 101 | OV | Med |
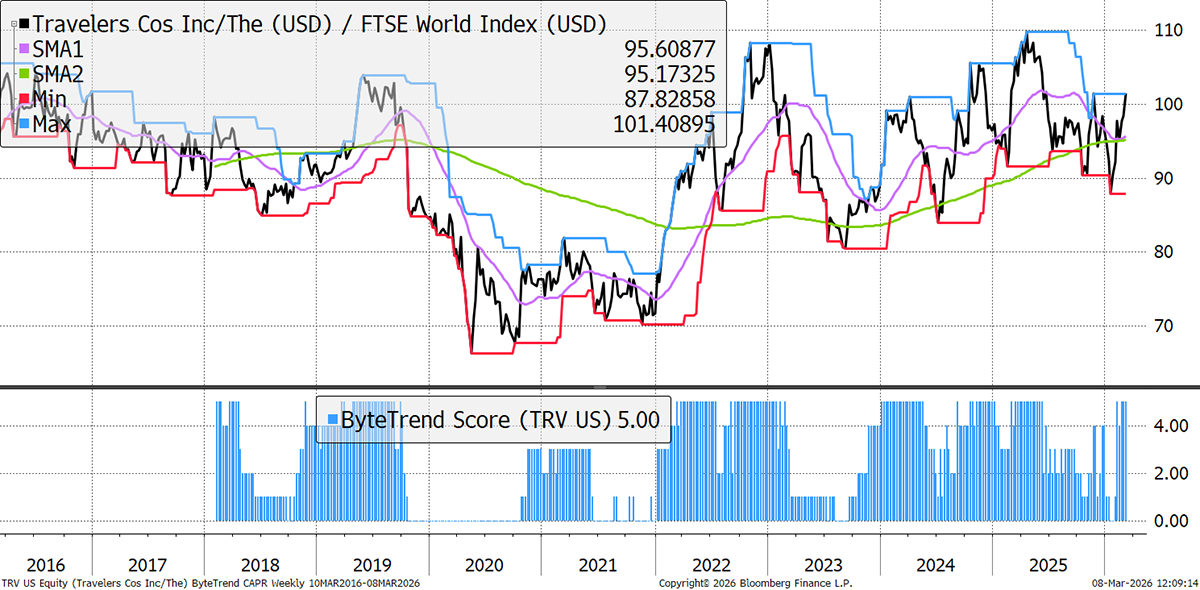
| The Travelers Companies, Inc. | 20 | 68 | FV | Med |
| Marathon Petroleum Corporation | 36 | 67 | OV | Good |
| Cheniere Energy, Inc. | 25 | 56 | FV | Good |
Bank of Montreal
Canada is an energy producer with no exposure to military damage (unlike Middle Eastern peers), making it a prime beneficiary of the spike in oil prices. With its gold industry already enjoying a bumper period, adding oil profits to the mix boosts the outlook for Canada’s banks.
The Travelers Companies
Travelers Cos is a leading US property and casualty insurer. In Q4 2025, it reported net income up 20%, driven by improved underwriting margins (a combined ratio of 82.2%); its fifth consecutive quarter below 85%. It also benefitted from lower catastrophe losses and higher investment returns from its investment portfolio, as higher interest was paid on the bonds it holds.
Emerging Trends
These stocks are trading at the 30-week CAPR highs with a ByteTrend Score of less than 5. They don’t have to be in an uptrend, just emerging. All charts shown are CAPR rebased to 100.
| Name | Annual Vol 30w | Mkt Cap $Bn | Value | Growth |
| Johnson & Johnson | 19 | 579 | OV | Med |
| Chevron Corporation | 18 | 380 | OV | Med |
| McDonald's Corporation | 13 | 234 | FV | Med |
| Verizon Communications Inc. | 24 | 216 | FV | Low |
| NextEra Energy, Inc. | 22 | 190 | FV | Good |
| The Toronto-Dominion Bank | 12 | 161 | FV | Med |
| Pfizer Inc. | 28 | 154 | Val | Med |
| Honeywell International Inc. | 22 | 149 | OV | Med |
| ConocoPhillips | 25 | 143 | FV | Neg |
| Bristol-Myers Squibb Company | 26 | 123 | FV | Med |
| Enbridge Inc. | 16 | 118 | OV | Med |
| Starbucks Corporation | 31 | 113 | FV | Med |
| Duke Energy Corporation | 16 | 103 | FV | Low |
| BP p.l.c. | 21 | 103 | OV | Med |
| Waste Management, Inc. | 18 | 99 | OV | Med |
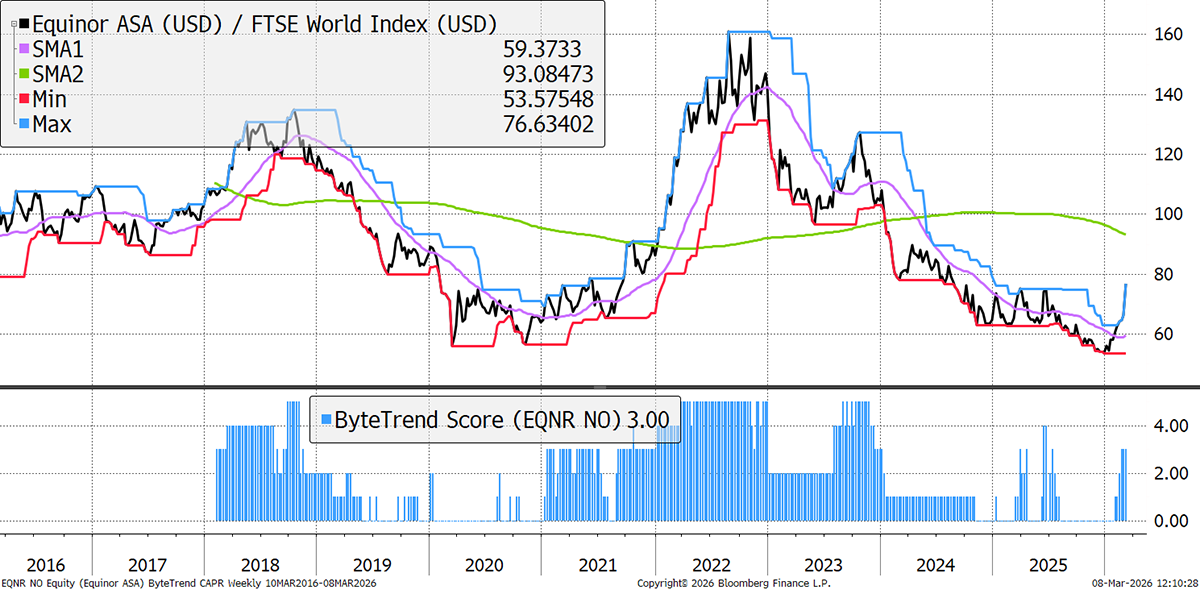
| Equinor ASA | 26 | 83 | OV | Neg |
| Shin-Etsu Chemical Co., Ltd. | 30 | 74 | OV | Med |
| American Electric Power Company, Inc. | 19 | 71 | FV | Med |
| EOG Resources, Inc. | 23 | 71 | FV | Neg |
| TC Energy Corporation | 18 | 66 | OV | Neg |
| Realty Income Corporation | 15 | 61 | FV | Med |
| Takeda Pharmaceutical Company Limited | 20 | 57 | OV | Med |
| Target Corporation | 26 | 55 | FV | Med |
| ONEOK, Inc. | 23 | 55 | FV | Med |
| Occidental Petroleum Corporation | 27 | 53 | OV | High |
| Diamondback Energy, Inc. | 25 | 52 | FV | Neg |
| Exelon Corporation | 20 | 50 | OV | Med |
NextEra Energy
Next Era is a giant utility company with heavy emphasis on renewables, which makes it less affected by rising fossil fuel prices. Higher oil prices increase electricity demand, and rates have already been rising as AI boosts demand while supply remains limited. Its regulated utility business in Florida also benefits from predictable earnings, making NEE a defensive play in times of stress.

Equinor
Norway is another country that sees the benefits of higher oil prices without the physical risks that Middle Eastern producers are enduring. It also owns and operates a large portfolio of renewables, notably North Sea and US offshore wind, which have held it back in recent years. However, the markets are currently seeing alternative assets as beneficiaries of an oil crisis, while its core fossil fuels businesses are strong relative to the broader market.
Weakening
These stocks are trading at the 30-week CAPR lows with a ByteTrend Score above 0. They are weakening trends but not yet downtrends. All charts shown are CAPR rebased to 100.
| Name | Annual Vol 30w | Mkt Cap $Bn | Value | Growth |
| JPMorgan Chase & Co. | 22 | 781 | OV | Good |
| LVMH Moët Hennessy - Louis Vuitton | 31 | 290 | FV | Med |
| Hermès International | 25 | 232 | FV | High |
| Airbus SE | 23 | 161 | FV | High |
| Allianz SE | 23 | 156 | OV | Good |
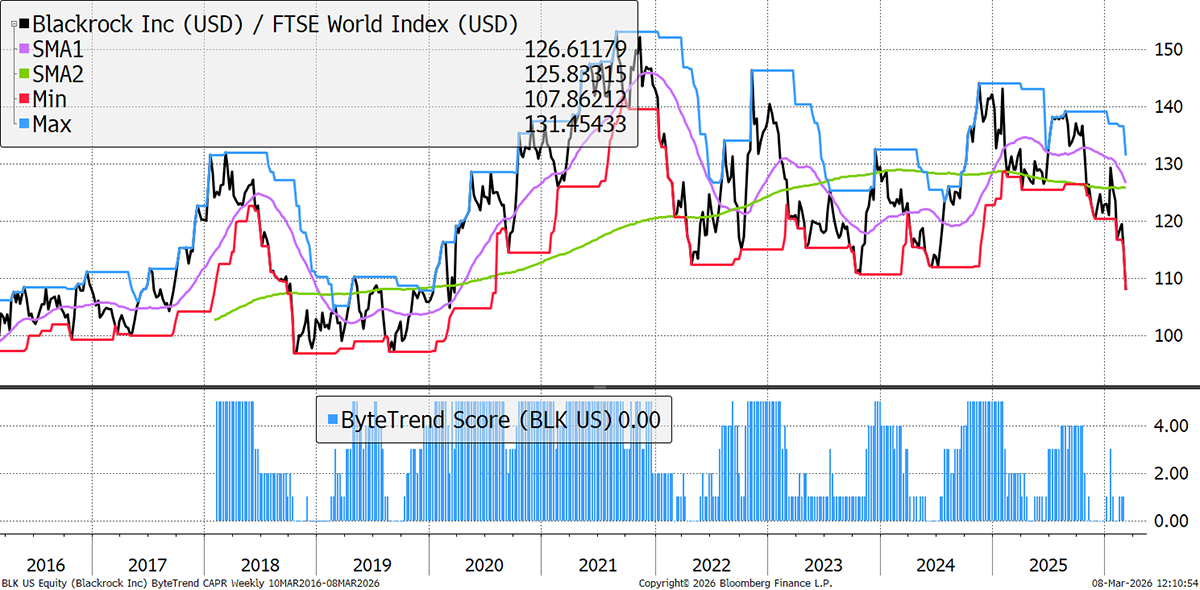
| BlackRock, Inc. | 23 | 149 | FV | Med |
| Capital One Financial Corporation | 29 | 117 | OV | Med |
| EssilorLuxottica S.A. | 32 | 115 | FV | Good |
| Xiaomi Corporation | 31 | 111 | FV | |
| Prosus N.V. | 27 | 107 | Val | High |
| Boston Scientific Corporation | 35 | 106 | FV | |
| Intesa Sanpaolo S.p.A. | 23 | 105 | OV | High |
| Christian Dior SE | 29 | 100 | Val | Med |
| Zurich Insurance Group AG | 20 | 97 | OV | High |
| CRH plc | 28 | 71 | OV | Med |
| TE Connectivity Ltd. | 29 | 60 | OV | Med |
| Deutsche Bank AG | 29 | 60 | OV | High |
| Volkswagen AG | 29 | 52 | Val | Neg |
BlackRock
US passive investing and asset management giant BlackRock is heavily exposed to private markets (PE and private credit), which offered higher fees but are now seeing outflows, redemptions, and negative revaluations. With global stockmarkets falling, weak US jobs data, and growing nervousness about the duration of war, its share price is a natural expression of market mood.
Deutsche Bank
European banks have fared worse than their American peers, as the economic impact of war and high oil prices is greater in Europe due to the proximity and reliance on Middle Eastern gas. High exposure to commercial real estate remains an underlying concern for Deutsche, but its financial performance has been strong in recent years, which explains its healthy outperformance until December 2025.

Bear Trends
These stocks are trading at the 30-week CAPR lows with a ByteTrend Score of 0. They are in a downtrend. All charts shown are CAPR rebased to 100.
| Name | Annual Vol 30w | Mkt Cap $Bn | Value | Growth |
| The Walt Disney Company | 18 | 180 | Val | |
| HDFC Bank Limited | 14 | 143 | Val | High |
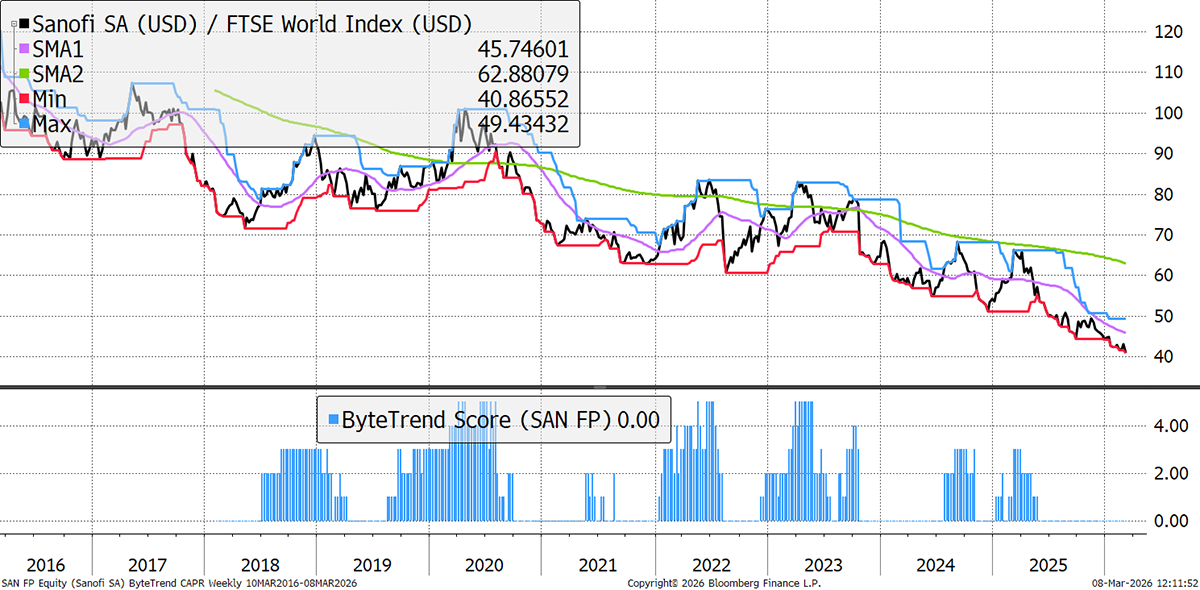
| Sanofi | 27 | 107 | FV | Med |
| ICICI Bank Limited | 16 | 102 | FV | High |
| Tata Consultancy Services Limited | 22 | 101 | Val | Neg |
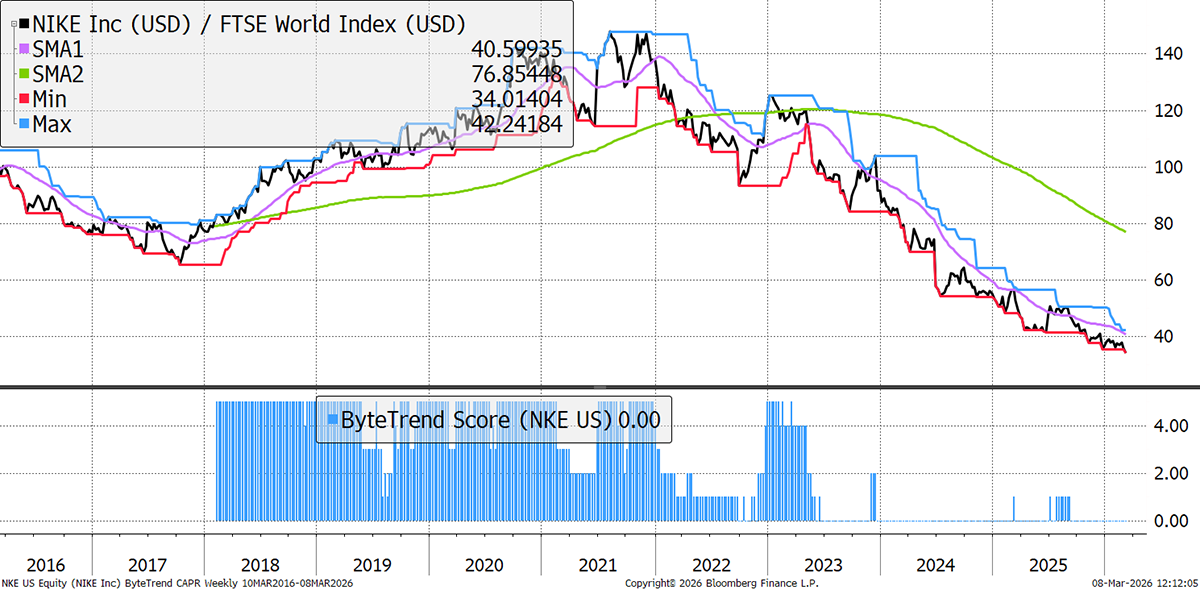
| NIKE, Inc. | 34 | 84 | Val | Med |
| Elevance Health Inc. | 32 | 64 | Val | Good |
| PT Barito Renewables Energy Tbk | 36 | 61 | Val | |
| Meituan | 37 | 60 | Chp | |
| Hindustan Unilever Limited | 17 | 57 | FV | Med |
| Bayerische Motoren Werke AG | 30 | 57 | FV | Neg |
| Merck KGaA | 34 | 56 | Val | Med |
| Sea Limited | 48 | 54 | Val | |
| Volkswagen AG | 27 | 53 | Val | Neg |
| Siemens Healthineers AG | 24 | 52 | Val | Low |
Sanofi
Despite the broader strength in healthcare, Sanofi is weak. This is due to pipeline setbacks like the US FDA’s rejection of tolebrutinib (its Multiple Sclerosis drug) over liver risks, which have dampened long-term growth expectations. Recent results have been strong, but pharma is reliant on strong replenishment of drug portfolios, and that is the key concern.
Nike
Nike’s attempted turnaround under CEO Elliot Hill is proving difficult. Rivals like On, Hoka, and Asics continue to take share in its running shoe territory, while Nike was focused on fashion. This challenge to the beating heart of its brand – performance shoes – threatens to undermine its powerful hold on global consumers, and its financial performance reflects that, with no growth and falling gross margins.
GTI 200 Spreadsheet
We are pleased to share the GTI 200 spreadsheet. Download the spreadsheet below to view the CAPR and local currency scores, and more, for the world’s largest 200 stocks. Have a look at the different groups and the main list “All stocks”. The Insights tab is interesting, and don’t forget to expand the columns by clicking on the “+” at the top of the page if you want to see more trend data.
Outlook
The World Index is falling from a previously strong position. The prevailing strength in energy and materials continues, with tech a short-term safe haven. Non-US markets give up their relative gains. VIX trends are rising, and this correction may have further to go until the Straits of Hormuz restore safe passage. To add to that, private markets display signs of stress.
Thanks for reading GTI.


