
Weakness in China


Issue 46;
- China, Hong Kong, and Australia show weakness.
- Global banks are in the lead.
- Tesla is lonely at the top.
Global Trends is a deep dive into global equities. The aim of this analysis is to better understand which countries, sectors, industries, and stocks are driving market returns. Not only does it help investors identify opportunities, but it also highlights the risks. We try to condense as much important information as possible, focusing on what really matters each week. Embrace this as a weekly discipline, and you’ll soon have a much better understanding of global financial markets.
The World Index regains a ByteTrend Score of 5 after having dipped last week.
World Index – Developed Markets – Daily

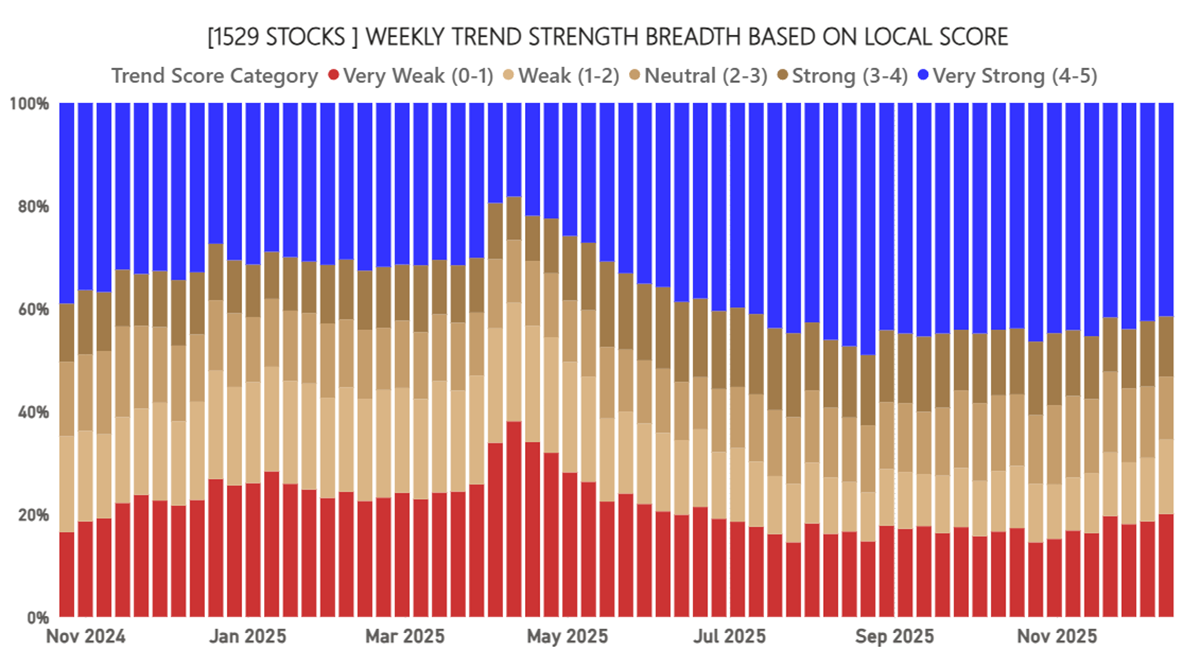
Market Breadth
Market breadth has declined again as the blue bars retreat, and the red bars grow. It is warning us that 2026 might be a tougher year.
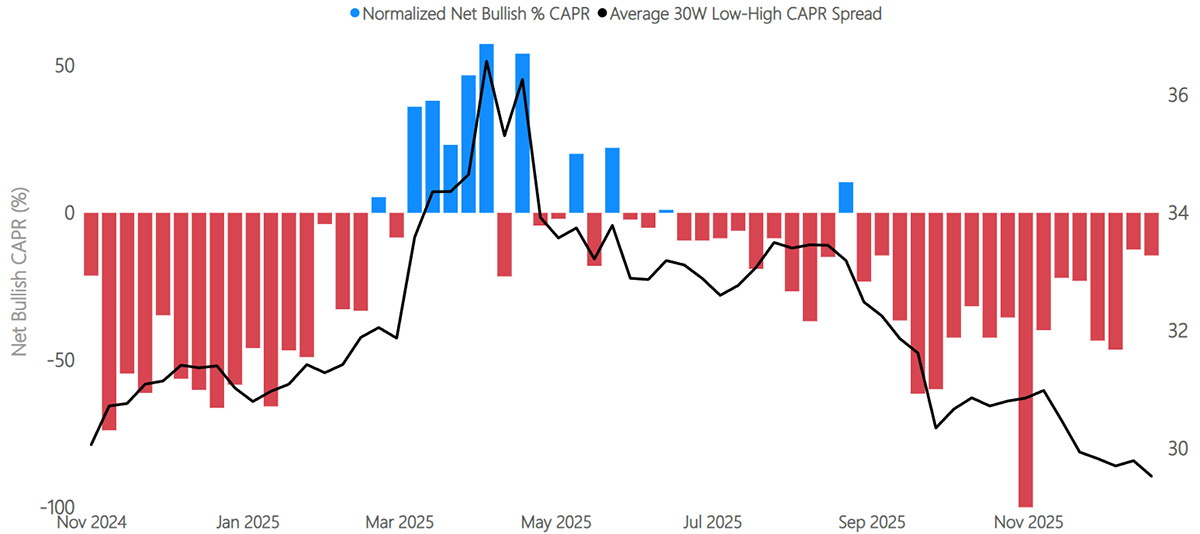
Global Rotation
However, more important is the global market rotation that we have been covering since October. The red bars represent the state of the average stock in CAPR terms (relative to the market). When the bars are heavily red, the average stock is doing badly vs the world. It has improved, which describes how the worst stocks have improved, while the most overbought leaders have retreated. The rotation continues to build.
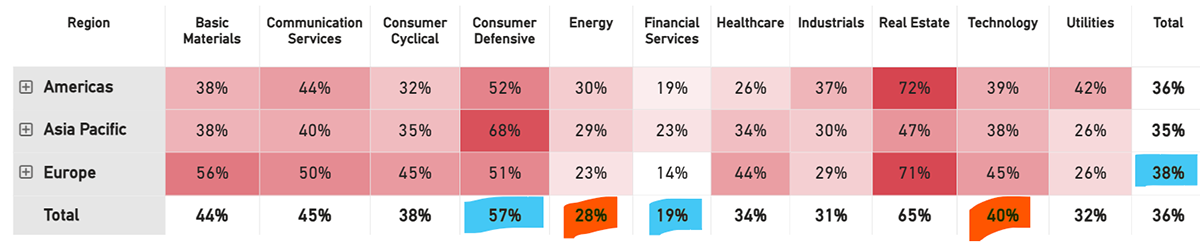
Global Winners
The world’s strongest stocks comprise 15% of all stocks, which are in trends that are beating the market. The Americas have improved while Asia has retreated. We note weakness in the Hong Kong markets as well as in Australia. Finance and Real Estate are stronger, and Energy, Technology, and Utilities are weaker.

Global Losers
In contrast, a portfolio of the weakest relative trends comprises 36% of all stocks. This sees Europe improve. Tech and Energy are also weaker, but more importantly, Consumer Defensives and Finance have fewer weak trends that are rallying from the lows.
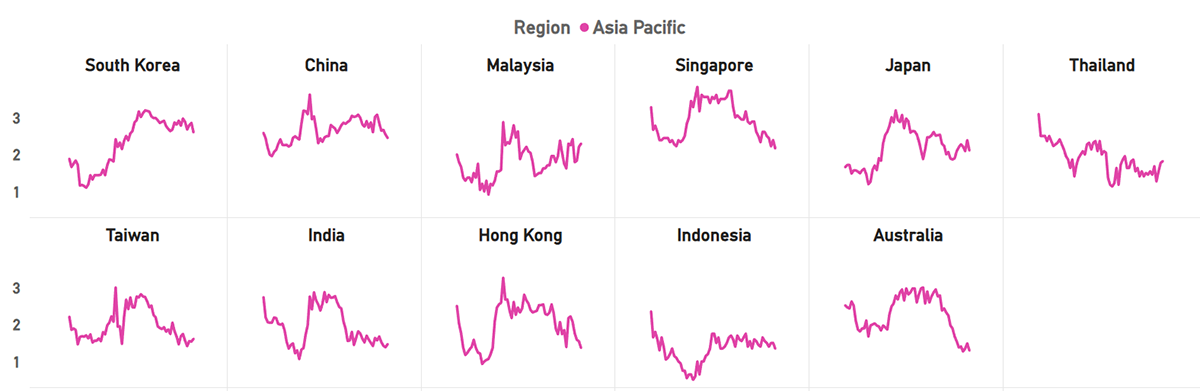
Asian Countries
Some Asian countries have started to show weakness, notably Australia, Hong Kong, and China, while Malaysia, Japan, and Thailand remain firm.
Australia
They may have taken back the Ashes, but their stockmarket has been among the worst over the past decade, with no sign of improvement. This is unusual in a bull market for metals. The average stock is doing badly, which suggests there are capital outflows.

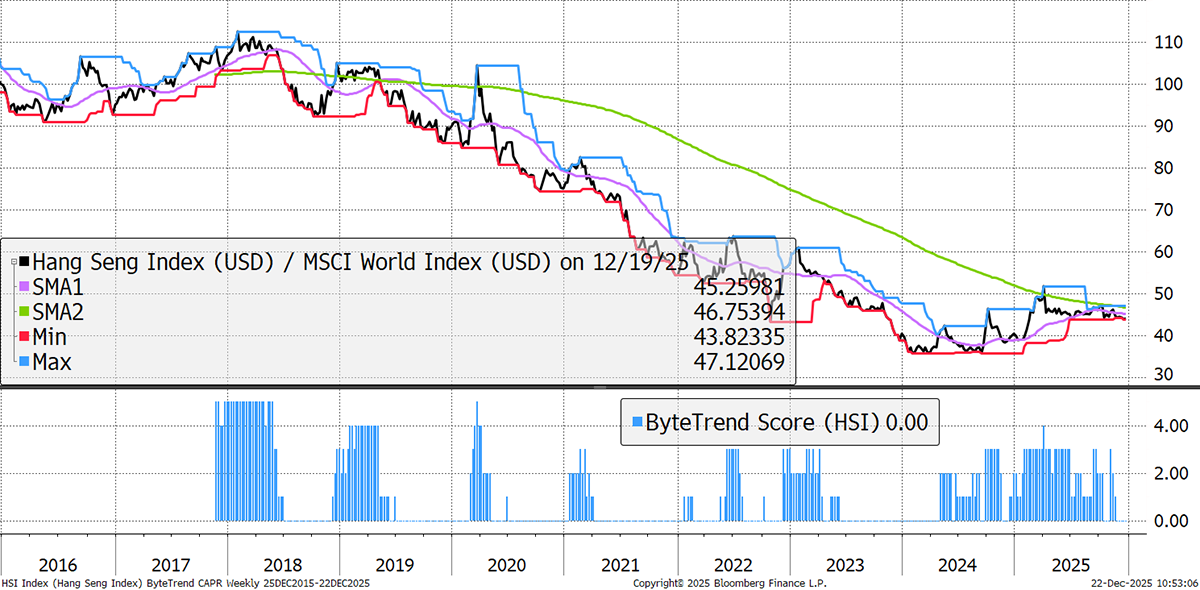
Hong Kong
The Hang Seng Index has reported a ByteTrend Score of 0 for three consecutive weeks. Real Estate, Tech, and China stocks are all weak. It will be interesting to see how this develops in the new year.
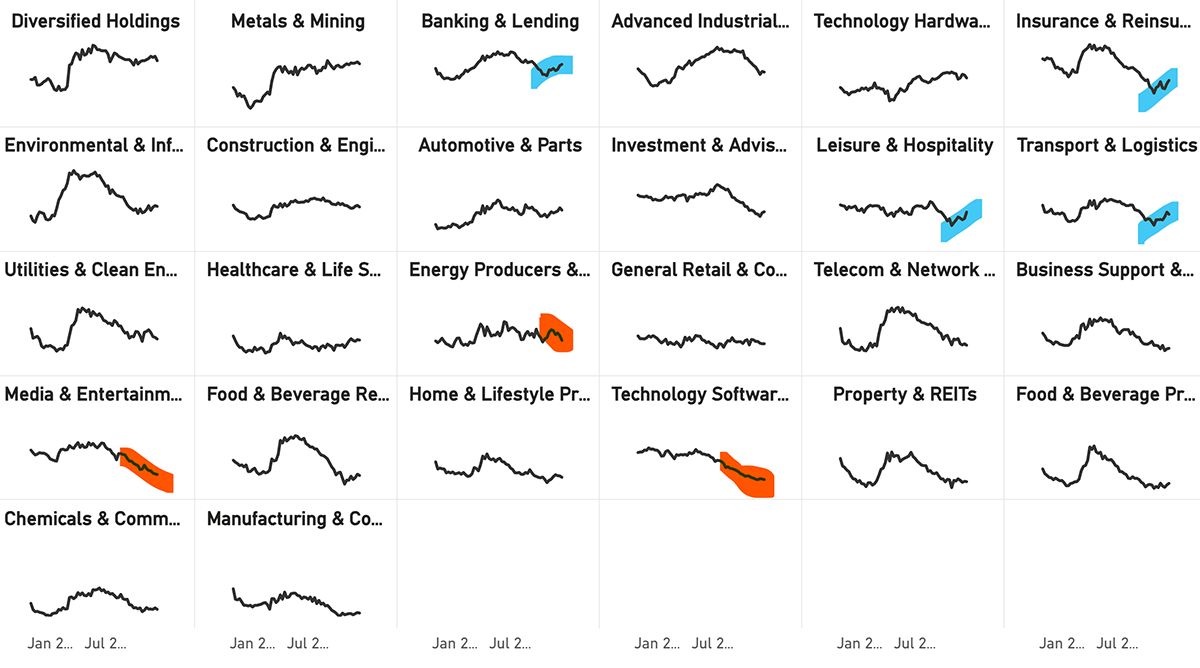
Industry Groups Relative Performance
Energy is having a mild downturn following a rally, but Software and Media, two parts of the old TMT, are noticeably weak. We see strength in Insurance, Banks, Leisure, and Transport. The latter two suggest you should not fear a recession in the medium term.
The Value Composite Score (Value) is measured against the company’s own financial history and not in absolute terms. The columns are Cheap (Chp), Value (Val), Fair Value (FV), Overvalued (OV), and Expensive (Exp). The Growth Composite Score (Growth) is measured by sales, earnings cash flow, dividends, and book value on a per share basis. The columns are High, Good, Medium (Med), Low, and Negative (Neg).
Leading Trends with New Highs
These stocks are trading at the 30-week CAPR highs with a ByteTrend Score of 5. All charts shown are CAPR rebased to 100.
| Name | 360-Day Vol | Mkt Cap $Bn | Value | Growth |
| Tesla, Inc. | 43 | 1550 | OV | Good |
| Wells Fargo & Company | 27 | 302 | FV | Good |
| Micron Technology, Inc. | 58 | 298 | Exp | Low |
| AstraZeneca PLC | 33 | 284 | FV | High |
| The Goldman Sachs Group, Inc. | 21 | 280 | OV | Good |
| HSBC Holdings plc | 22 | 268 | OV | High |
| AppLovin Corporation | 65 | 244 | Exp | High |
| RTX Corporation | 23 | 244 | OV | Med |
| Royal Bank of Canada | 11 | 237 | OV | Good |
| Lam Research Corporation | 39 | 216 | Exp | Good |
| Citigroup Inc. | 24 | 214 | FV | Med |
| Banco Santander, S.A. | 24 | 172 | OV | High |
| China Life Insurance Company Limited | 34 | 166 | FV | High |
| KLA Corporation | 35 | 164 | Exp | Good |
| Capital One Financial Corporation | 24 | 155 | Exp | Med |
| UBS Group AG | 27 | 147 | OV | Good |
| Banco Bilbao Vizcaya Argentaria, S.A. | 26 | 134 | Exp | High |
| Sumitomo Mitsui Financial Group, Inc. | 26 | 122 | OV | High |
| Intesa Sanpaolo S.p.A. | 19 | 122 | OV | High |
| Siemens Energy AG | 35 | 120 | Exp | High |
| Southern Copper Corporation | 34 | 118 | OV | Low |
| Newmont Corporation | 37 | 111 | OV | Neg |
| Investor AB (publ) | 14 | 107 | OV | Good |
| Barclays PLC | 26 | 87 | OV | Good |
| Canadian Imperial Bank of Commerce | 13 | 86 | OV | Good |
| CaixaBank, S.A. | 18 | 86 | OV | High |
| Marriott International, Inc. | 27 | 83 | OV | High |
| ING Groep N.V. | 22 | 82 | OV | High |
| Barrick Gold Corporation | 35 | 77 | OV | Good |
| General Motors Company | 32 | 77 | FV | Good |
| Lloyds Banking Group plc | 23 | 77 | OV | Good |
| Monster Beverage Corporation | 22 | 75 | FV | Good |
| ANZ Group Holdings Limited | 17 | 71 | FV | Good |
| NatWest Group plc | 28 | 70 | OV | Good |
| Oversea-Chinese Banking | 15 | 68 | OV | High |
| Nordea Bank Abp | 17 | 64 | FV | High |
| Engie S.A. | 17 | 63 | OV | High |
| Seagate Technology Holdings plc | 49 | 63 | Exp | Neg |
| Western Digital Corporation | 54 | 63 | Exp | Neg |
| Manulife Financial Corporation | 16 | 61 | OV | Med |
| Société Générale S.A. | 27 | 61 | Exp | Good |
| Ross Stores, Inc. | 23 | 59 | FV | Med |
| PACCAR Inc | 24 | 59 | OV | High |
| Wheaton Precious Metals Corp. | 30 | 54 | Exp | Low |
| Standard Chartered PLC | 28 | 54 | OV | High |
| KBC Group N.V. | 19 | 52 | OV | Low |
| National Bank of Canada | 13 | 50 | OV | Good |
| Ferrovial SE | 17 | 47 | OV | High |
| Delta Air Lines, Inc. | 34 | 46 | FV | High |
| Erste Group Bank AG | 25 | 46 | OV | High |
| Great-West Lifeco Inc. | 14 | 45 | OV | Neg |
| AngloGold Ashanti Plc | 44 | 43 | Exp | High |
| Carnival Corporation & plc | 42 | 41 | FV | High |
| Antofagasta plc | 37 | 41 | Exp | Neg |
| Skandinaviska Enskilda Banken | 12 | 41 | FV | High |
| Danske Bank A/S | 17 | 40 | OV | High |
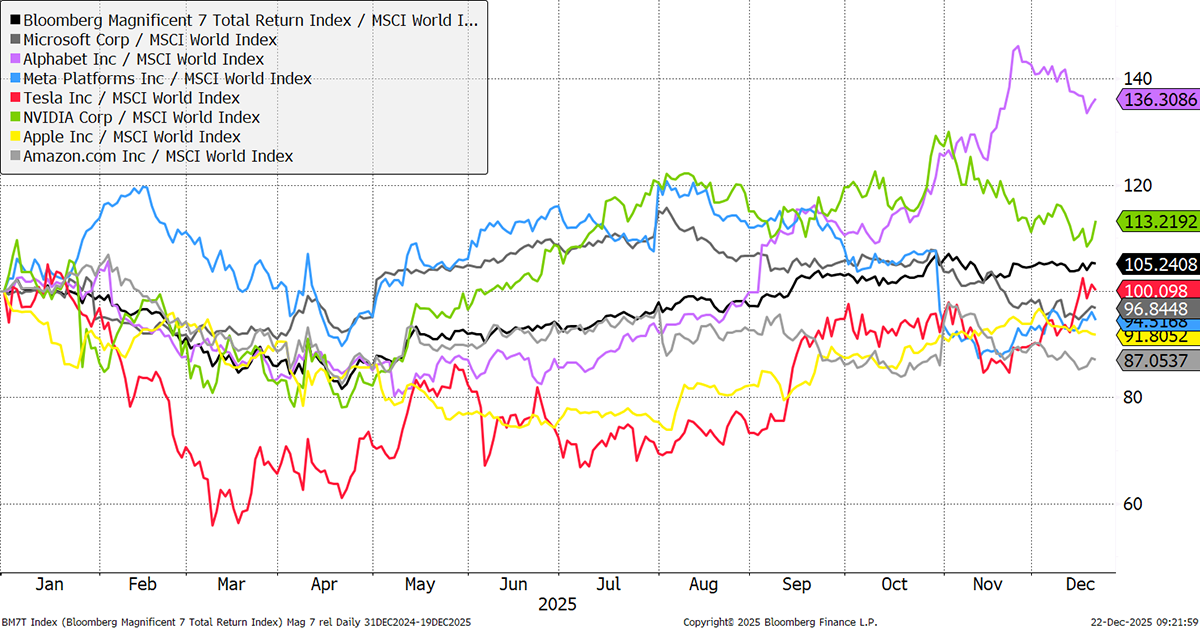
Magnificent 7: Tesla High
Tesla (red) is the only big tech stock to make a CAPR high last week. The hype machine is full of robots, driverless cars, and spaceships. Yet, the Magnificent 7 has outperformed the world this year, but only by 5%.
Global Banks
Bank stocks have been amazing this year, especially in Europe. Yet, over five years, Japanese banks have led the world.
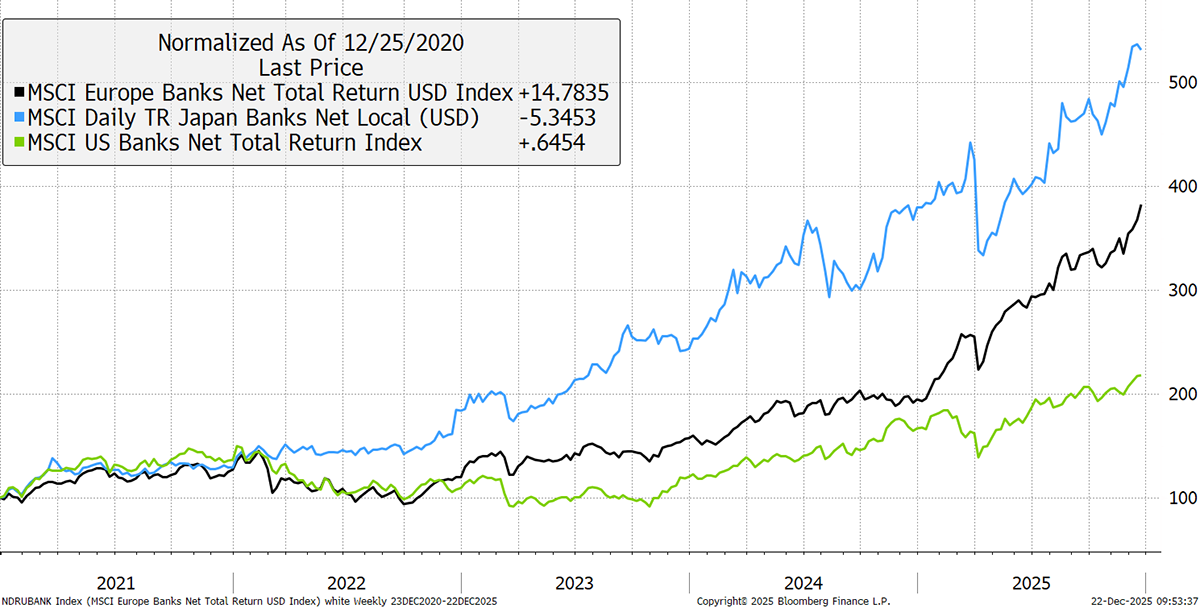
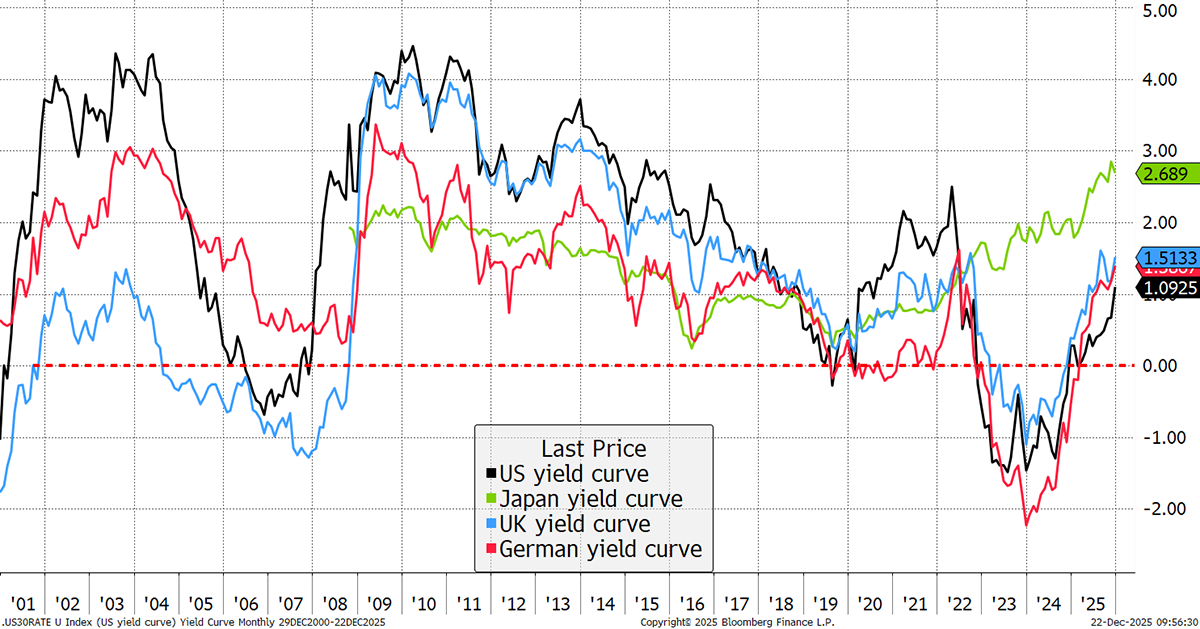
Yield Curves
Steeper yield curves have been an important factor as the banks are able borrow short-term and lend long-term at wide spreads. The last time we saw this was in 2001/2, 2008/9, and 2020/1, so read into that what you will. There has also been good activity in capital markets and a resilient economy. The other reason for outperformance is a sector that is underowned, and big tech is no longer in charge. Something has to take over, and it happens to be the banks, which enjoy positive revisions.
New Leading Trends
These stocks are trading at the 30-week CAPR highs with a ByteTrend Score of 5, except they are new trends this week, having previously had a score below 5. All charts shown are CAPR rebased to 100.
| Name | 360-Day Vol | Mkt Cap $Bn | Value | Growth |
| AstraZeneca PLC | 33 | 284 | FV | High |
| Capital One Financial | 24 | 155 | Exp | Med |
| UBS Group AG | 27 | 147 | OV | Good |
| Marriott International | 27 | 83 | OV | High |
| Manulife Financial | 16 | 61 | OV | Med |
| Carnival Corporation | 42 | 41 | FV | High |
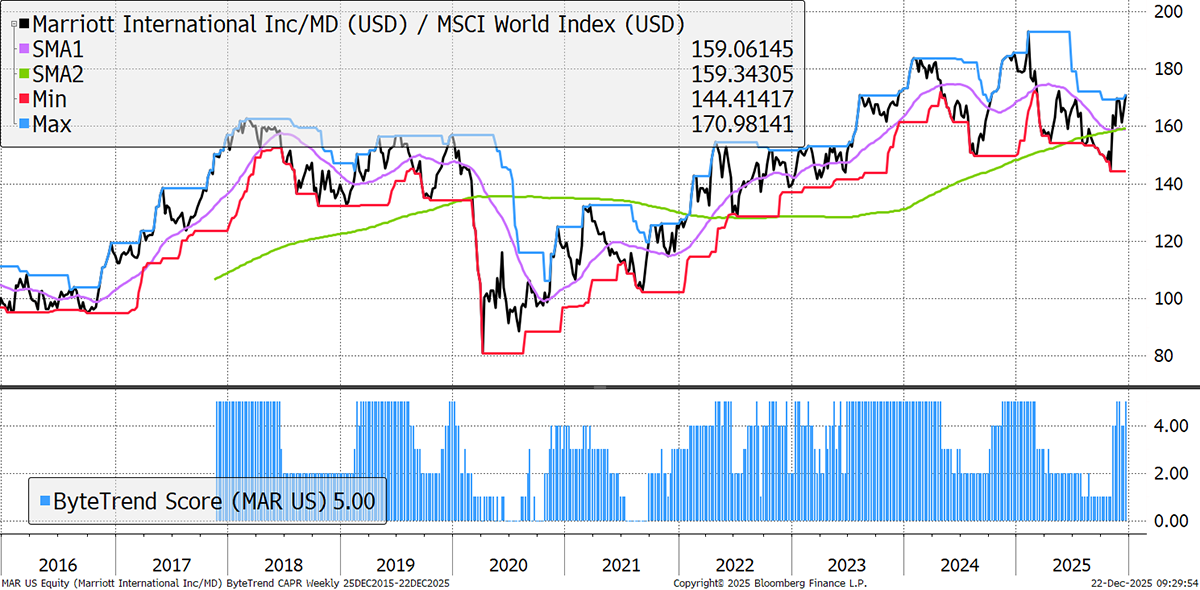
Marriott
Ritz-Carlton owner Marriott is the world’s largest hotel chain, having bought major brands via the Starwood Hotels acquisition in 2016, and is an example of a well-drilled franchising model. Independent hotels sign up and give Marriott a share of their profits in return for using its brand and booking platform. Backed by its successful loyalty program, Bonvoy, which has almost 250 million members, Marriott gets profit share without building hotels, and everyone wins. Recent quarters have seen sales and profit growth beat expectations, driving it back to a score of 5.
Emerging Trends
These stocks are trading at the 30-week CAPR highs with a ByteTrend Score of less than 5. They don’t have to be in an uptrend, just emerging. All charts shown are CAPR rebased to 100.


