
World Uptrend Versus USA Confirmed


Issue 54;
- The world-ex US is back in the lead for the first time since 2009.
- The “Tech Spread”, hardware versus software, is extreme.
- Still waiting for mid-caps.
Global Trends is a deep dive into global equities. The aim of this analysis is to better understand which countries, sectors, industries, and stocks are driving market returns. Not only does it help investors identify opportunities, but it also highlights the risks. We try to condense as much important information as possible, focusing on what really matters each week. Embrace this as a weekly discipline, and you’ll soon have a much better understanding of global financial markets.
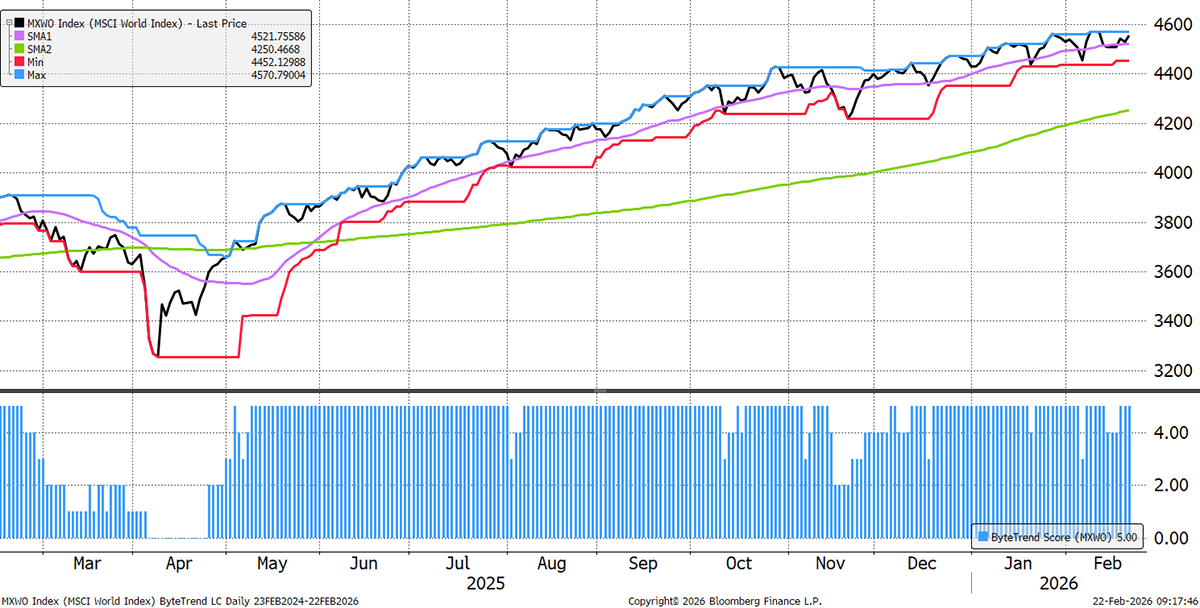
The World Index retains a ByteTrend Score of 5 in USD, but there has been no new high for two weeks.
World Index – Developed Markets – Daily
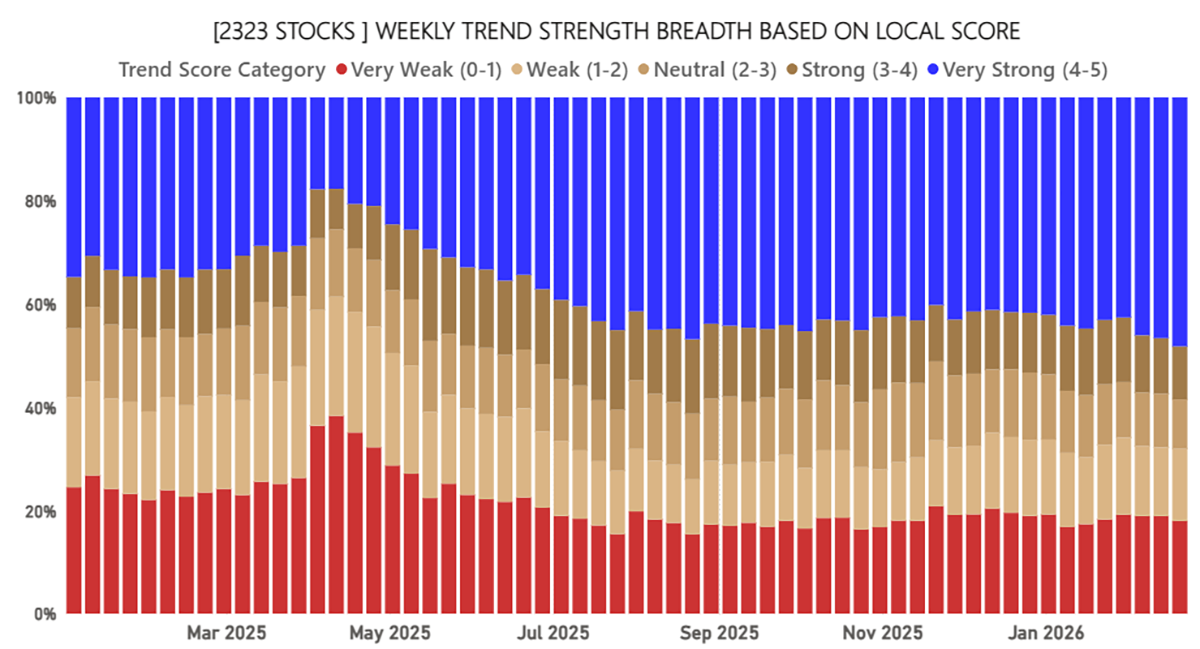
Global Equity Breadth
Breadth remains strong, with an increasing number of bullish trends. The bear story from the AI disruption is not yet notable at a high level. Many new trends have stepped in.
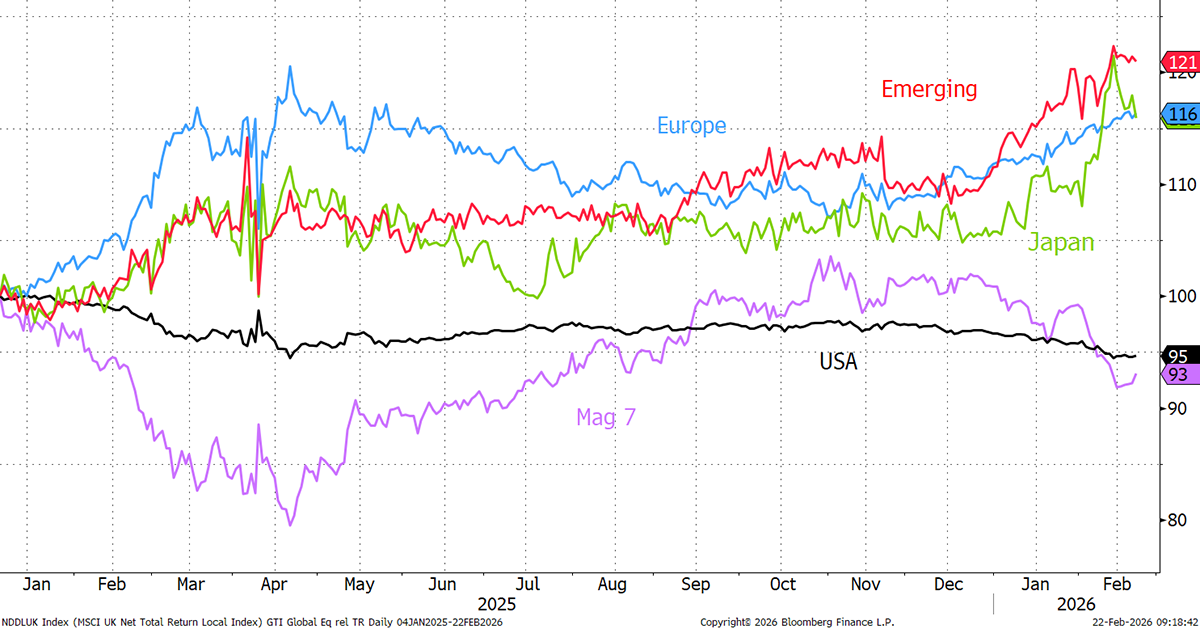
World Regional Performance
Regional dispersion remains high, with the US lagging significantly. The Magnificent 7 big US tech stocks are a drag, except for Alphabet. Yet last week saw an uptick (purple).
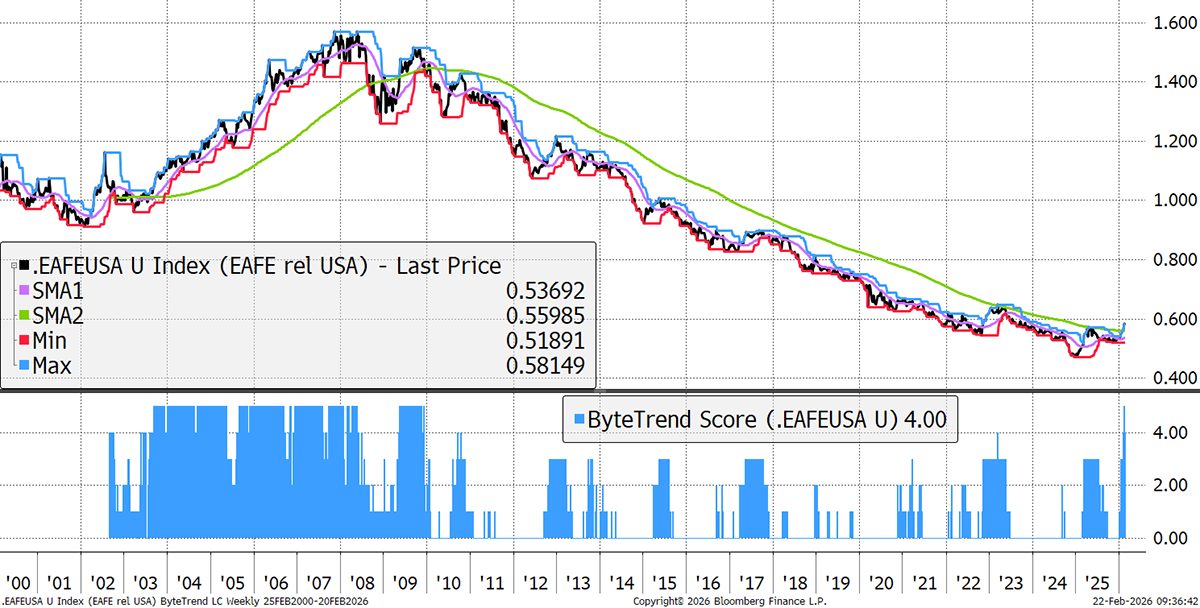
The World vs the USA
The divergence between the USA and EAFE (Europe, Australasia, and the Far East) has turned. The ByteTrend weekly score on the spread is a 5 for the first time since 2009. It is a little stretched in the short-term, and a reversal is inevitable, but the underlying trend will most likely last for years to come.
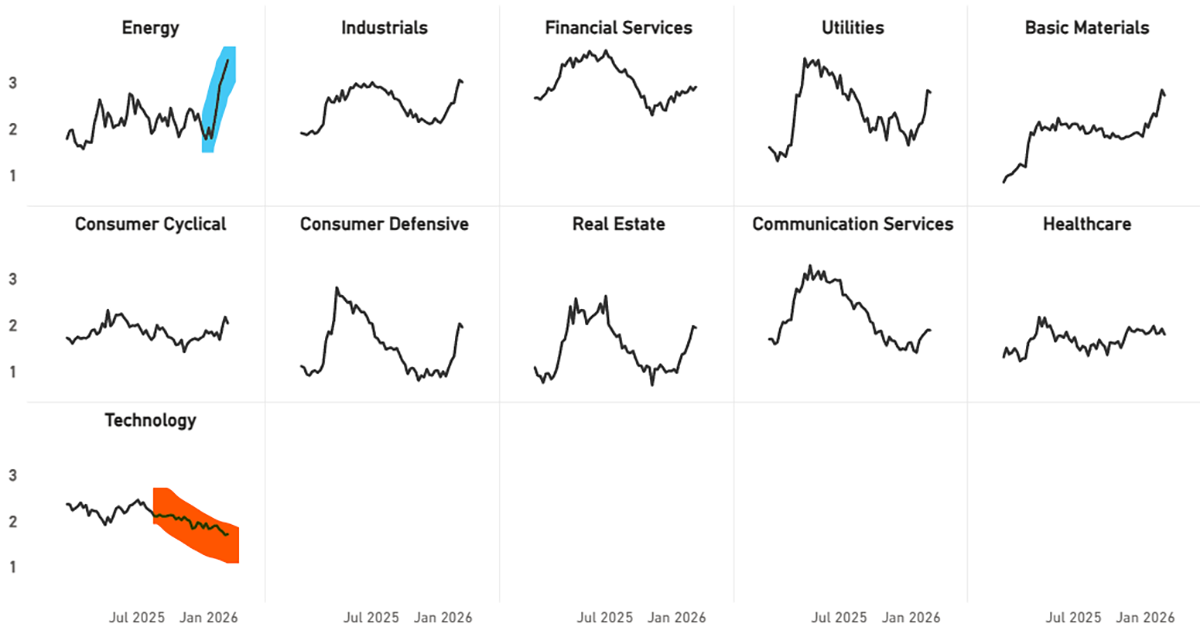
Sector Trends in CAPR
Energy, a hearty real asset, has flown. Most sectors have also done well but have cooled over the past week. Technology remains under pressure in CAPR terms.
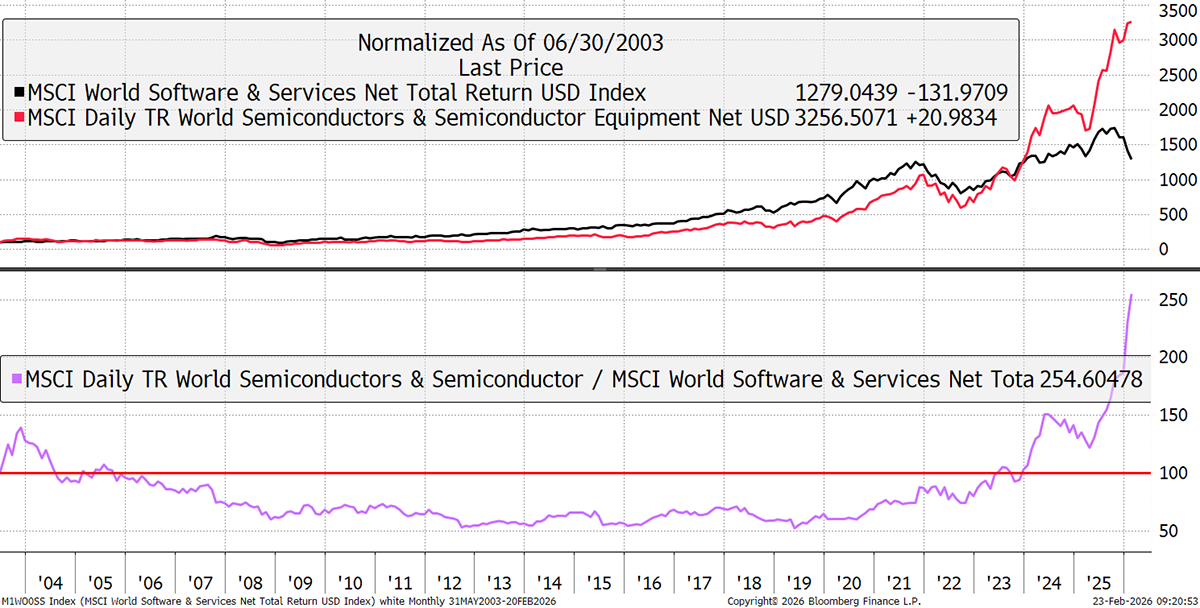
The Tech Spread
It’s been all over the news that software is being eaten by hardware, something we haven’t seen before. Since 2019, chips have beaten tech services and software, and this divergence has become explosive. Since May 2019, software is up 2x, and hardware 10x.
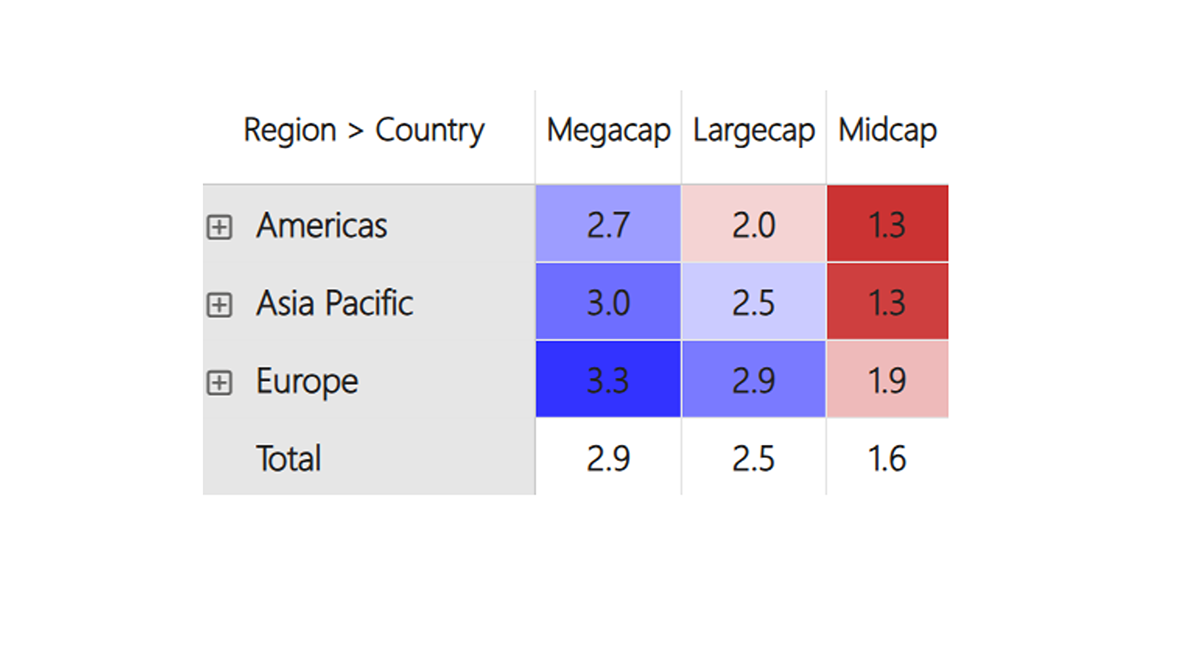
Size Trends in CAPR
As the great rotation unveils, many commentators think it’s time for mid-caps to pick up, but it’s not yet happening. They are going up, but they are not yet leading the market. Perhaps we need to see the giant semis break before that happens. It is notable how this mega-mid spread has narrowed in recent months.
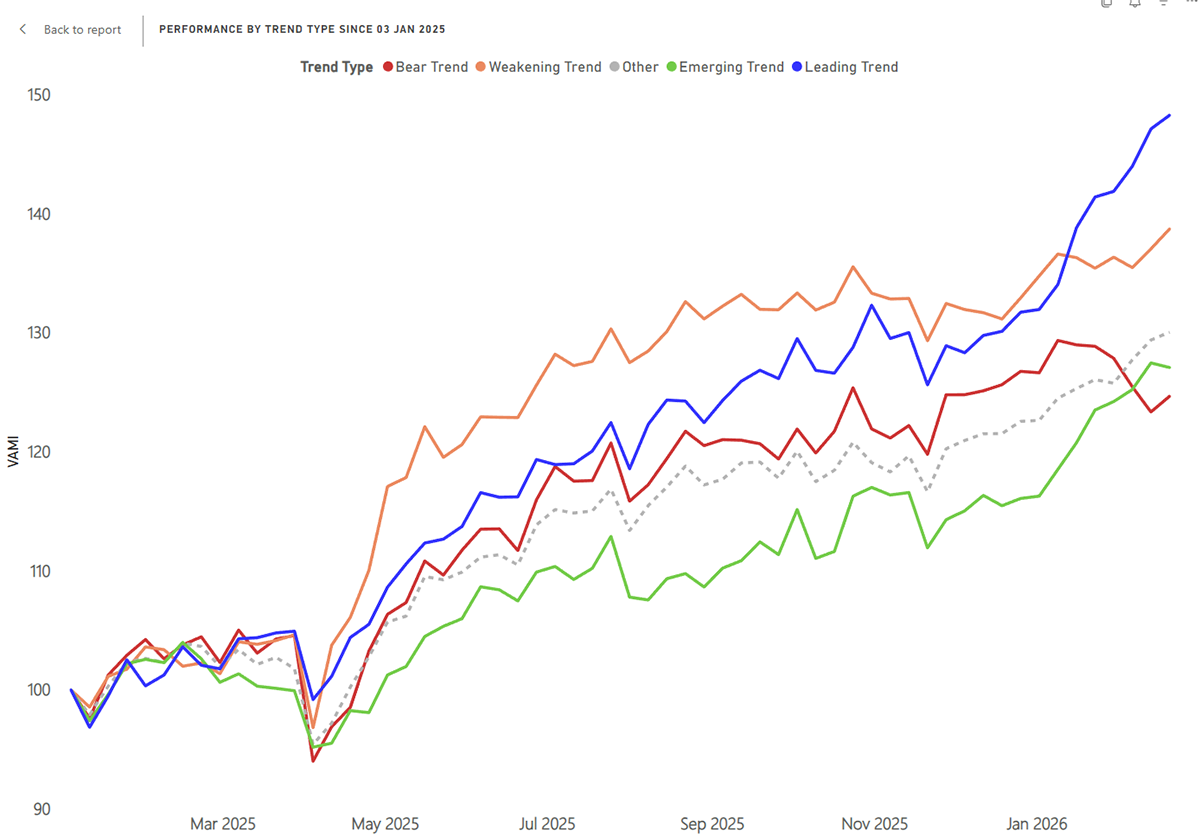
Performance by Trend Type
The leaders versus laggards gap continues to widen. The important thing here is that the bear trends (red) are somewhat stable. If this turns down decisively, that will signal a bear market. It’s not yet happening, as the dark forces seem to be contained.
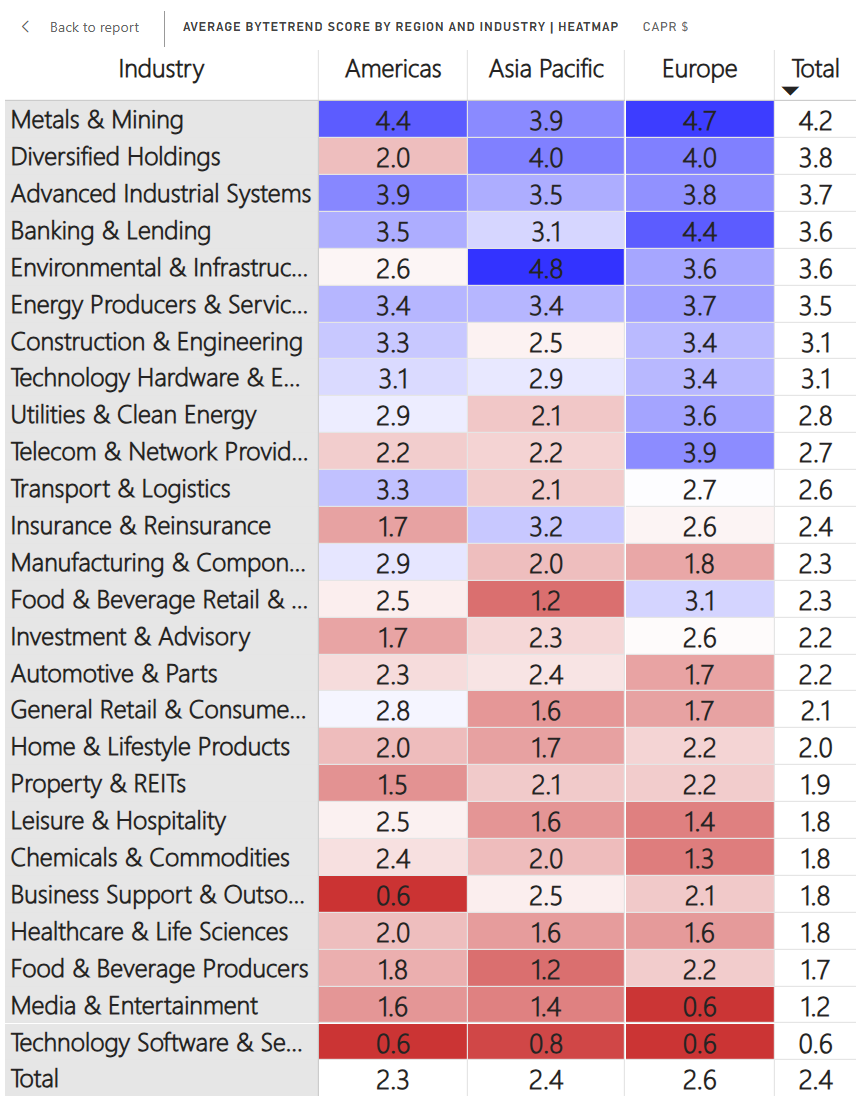
Regions and Industries Average CAPR Score
Overall, it was a quieter week for the great rotation. Software stays at the bottom but has stabilised. Meanwhile, Energy Producers were one of the few growing trends to keep rising, and is now the sixth strongest (up from 17th eight weeks ago). Advanced Industrials (like GE Aerospace, Airbus, Safran, ABB, Lockheed, Rolls Royce, Northrop, BAE, and Rheinmetall) also remain strong, and are now the third strongest industry, as the defence theme remains at the top of investors’ minds. Metals & Mining continue their long run at the top of the table.
Construction is improving, which is buoyant for the economy, as is Manufacturing and Transport/Logistics. Insurance is stabilising.
Media, Tech Software and Business Support are weak, as they are deemed to be threatened by AI. Investment & Advisory just joined in.
User Guide
Refer to our GTI: User Guide for an overview of the key concepts and terminology used in this report. These concepts may take a little bit of getting used to, but they are very powerful once you do.
How to Read the Tables
The Value Composite Score (Value) is measured against the company’s own financial history and not in absolute terms. The columns are Cheap (Chp), Value (Val), Fair Value (FV), Overvalued (OV), and Expensive (Exp). The Growth Composite Score (Growth) is measured by sales, earnings, cash flow, dividends, and book value on a per share basis. The columns are High, Good, Medium (Med), Low, and Negative (Neg).
Leading Trends with New Highs
These stocks are trading at the 30-week CAPR highs with a ByteTrend Score of 5. All charts shown are CAPR rebased to 100.
| Name | Annual Vol 30w | Mkt Cap $Bn | Value | Growth |
| Samsung Electronics Co., Ltd. | 36 | 879 | Exp | High |
| ASML Holding N.V. | 36 | 574 | OV | Good |
| Micron Technology, Inc. | 55 | 482 | Exp | Low |
| SK hynix Inc. | 55 | 453 | Exp | High |
| GE Aerospace | 27 | 362 | Exp | High |
| AstraZeneca PLC | 28 | 319 | FV | Good |
| Lam Research Corporation | 43 | 306 | Exp | Good |
| PetroChina Company Limited | 26 | 299 | OV | Good |
| Applied Materials, Inc. | 41 | 298 | Exp | Good |
| RTX Corporation | 24 | 275 | OV | Good |
| GE Vernova Inc. | 33 | 225 | OV | Med |
| Analog Devices, Inc. | 32 | 174 | OV | Med |
| Safran S.A. | 20 | 170 | OV | High |
| Siemens Energy AG | 34 | 167 | Exp | High |
| Southern Copper Corporation | 34 | 166 | Exp | Good |
| TotalEnergies SE | 18 | 165 | OV | Neg |
| Lockheed Martin Corporation | 23 | 152 | OV | Med |
| Rolls-Royce Holdings plc | 26 | 149 | Exp | Good |
| Zijin Mining Group Company Limited | 39 | 145 | Exp | High |
| Chubb Limited | 18 | 131 | FV | Good |
| Tokyo Electron Limited | 51 | 130 | Exp | Good |
| Parker-Hannifin Corporation | 20 | 129 | Exp | Good |
| BNP Paribas S.A. | 27 | 125 | OV | Good |
| Investor AB (publ) | 17 | 125 | FV | Good |
| State Bank of India | 20 | 124 | OV | High |
| Investor AB (publ) | 17 | 123 | FV | Good |
| Corning Incorporated | 38 | 120 | Exp | Good |
| Agnico Eagle Mines Limited | 39 | 114 | OV | High |
| Chugai Pharmaceutical Co., Ltd. | 40 | 105 | OV | Good |
| Itaú Unibanco Holding S.A. | 19 | 105 | OV | High |
| National Australia Bank Limited | 18 | 105 | OV | Good |
| Howmet Aerospace Inc. | 29 | 104 | Exp | High |
| Westpac Banking Corporation | 19 | 103 | OV | Good |
| Northrop Grumman Corporation | 20 | 103 | OV | Good |
| Petróleo Brasileiro S.A. - Petrobras | 29 | 102 | FV | Neg |
| Western Digital Corporation | 55 | 97 | Exp | Neg |
| Delta Electronics (Thailand) Public | 41 | 94 | Exp | High |
| Vertiv Holdings Co | 52 | 93 | Exp | High |
| Canadian Imperial Bank of Commerce | 15 | 93 | OV | Good |
| Vinci S.A. | 26 | 92 | FV | Med |
| FedEx Corporation | 32 | 92 | OV | Med |
| Midea Group | 18 | 91 | ||
| The Williams Companies, Inc. | 24 | 89 | Exp | Neg |
| Canadian Natural Resources Limited | 24 | 88 | OV | Med |
| Johnson Controls International plc | 31 | 88 | Exp | Med |
| Quanta Services, Inc. | 27 | 82 | Exp | High |
| Monster Beverage Corporation | 20 | 82 | FV | Good |
| AB Volvo (publ) | 24 | 79 | OV | Good |
| Mitsubishi Electric Corporation | 30 | 77 | Exp | Good |
| Oversea-Chinese Banking Corporation | 14 | 77 | OV | High |
| Kinder Morgan, Inc. | 21 | 73 | OV | Low |
| Infineon Technologies AG | 38 | 69 | OV | Neg |
| Wheaton Precious Metals Corp. | 36 | 68 | Exp | Low |
| PACCAR Inc | 22 | 67 | OV | Med |
| Crédit Agricole S.A. | 22 | 66 | OV | Good |
| Simon Property Group, Inc. | 17 | 66 | FV | Good |
| Singapore Telecommunications Limited | 20 | 66 | OV | High |
| Ross Stores, Inc. | 18 | 66 | OV | Med |
| Eni S.p.A. | 17 | 65 | OV | Med |
| CMOC Group Limited | 51 | 64 | Exp | High |
| Emirates NBD Bank PJSC | 29 | 62 | OV | High |
| Baker Hughes Company | 26 | 61 | OV | Good |
| Imperial Oil Limited | 32 | 60 | OV | Neg |
| BOC Hong Kong (Holdings) Limited | 22 | 59 | FV | Good |
| AngloGold Ashanti Plc | 42 | 56 | Exp | High |
| Orange S.A. | 18 | 56 | Exp | Neg |
| AMETEK, Inc. | 15 | 54 | OV | Good |
| Antofagasta plc | 33 | 53 | Exp | Neg |
| Teradyne, Inc. | 59 | 52 | Exp | Low |
| National Bank of Canada | 15 | 51 | OV | Good |
| Sun Hung Kai Properties Limited | 27 | 50 | FV | High |
| Franco-Nevada Corporation | 34 | 50 | OV | Good |
| Targa Resources Corp. | 29 | 50 | Exp | Good |
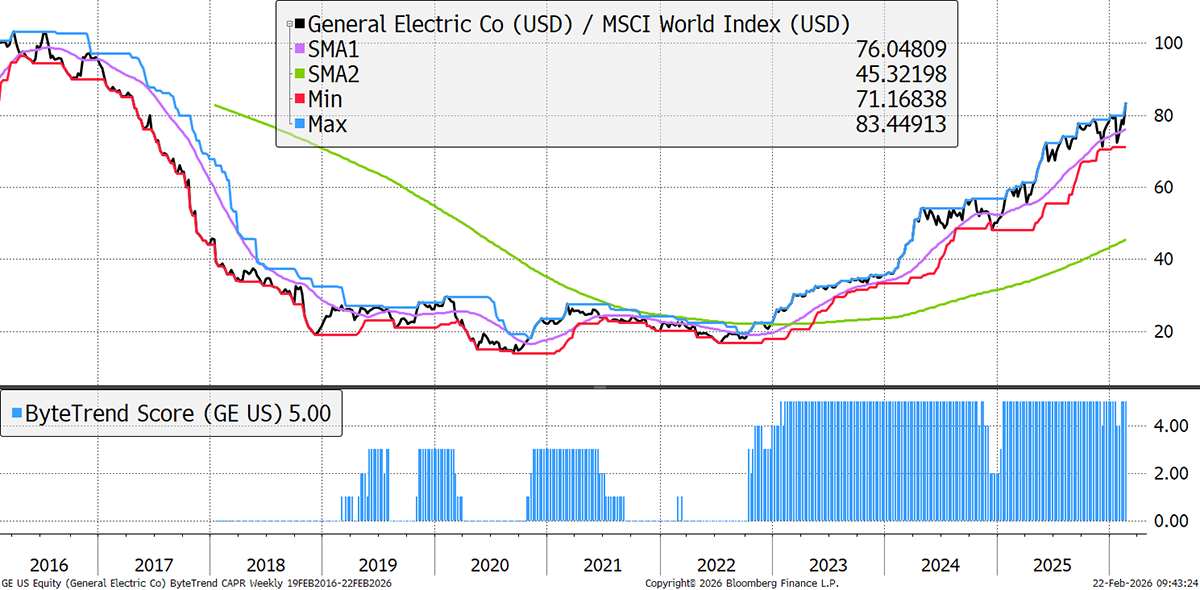
GE Aerospace
As Iran tensions mount, the defence theme continues to attract new investors. Three years ago, these stocks were pariahs. Today, they find themselves as societal essentials. GE has tens of thousands of commercial engines in service (including a large military base), which drive a large, recurring aftermarket revenue stream, based on long-term service agreements. De-merging to leave an aerospace-focused pure-play in April 2024 was well-timed.
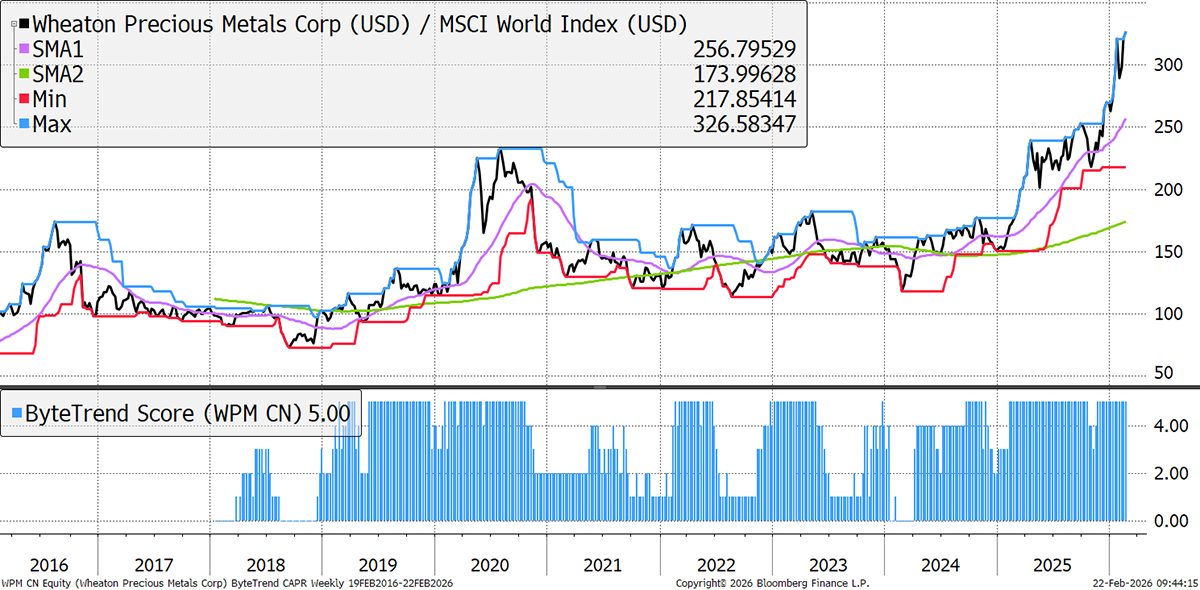
Wheaton Precious Metals
A new high for the streamer despite gold and silver remaining below theirs. Wheaton does not mine, but it provides financing in return for a share of production. Last week, it acquired an additional silver stream on the Antamina mine in Peru, expanding on an existing deal and making it the largest precious metal stream ever executed. Wheaton has bought 33.75% of the production up to 100m ounces, and 22.5% thereafter.
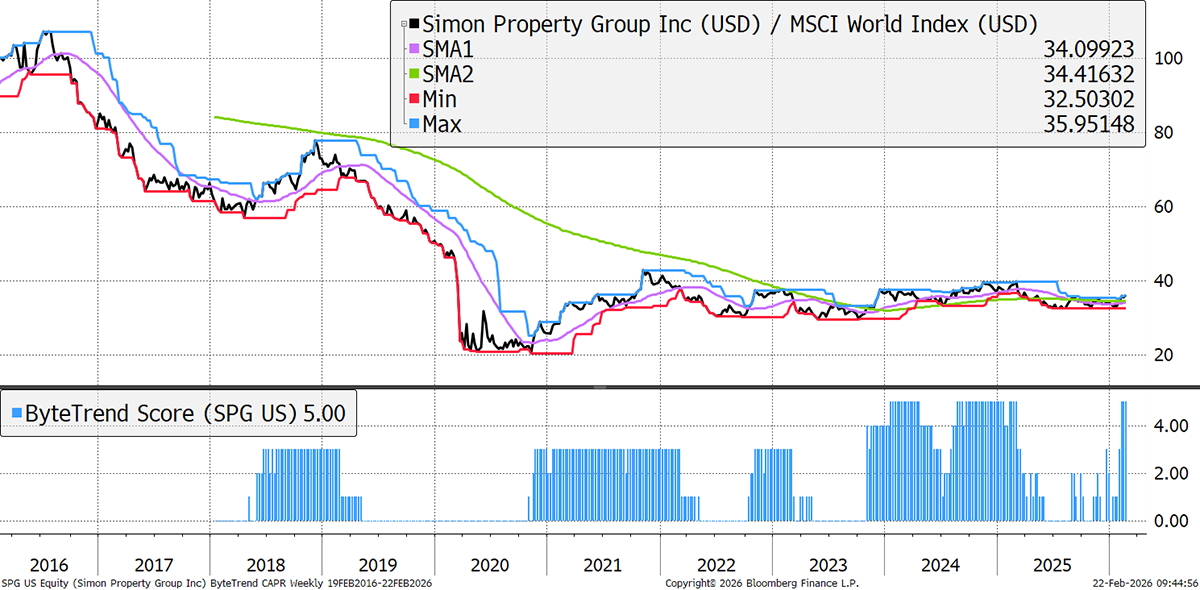
Simon Property Group
Simon Property Group (SPG) is one of the largest retail real estate investment trusts (REITs) in the US, owning and managing premium shopping malls, outlets, and mixed-use destinations worldwide. In early February, it delivered good results and upbeat guidance, after a tough few years for the retail sector. As logistics and consumer staples stocks start to pick up, SPG’s strength adds to the sense that consumer weakness may be ending.
New Leading Trends
These stocks are trading at the 30-week CAPR highs with a ByteTrend Score of 5, except they are new trends this week, having previously had a score below 5. All charts shown are CAPR rebased to 100.
| Name | Annual Vol 30w | Mkt Cap $Bn | Value | Growth |
| Commonwealth Bank of Australia | 27 | 213 | OV | Good |
| Deere & Company | 26 | 180 | OV | Good |
| Freeport-McMoRan Inc. | 43 | 92 | Exp | Neg |
| BAE Systems plc | 37 | 85 | OV | Med |
| Larsen & Toubro Limited | 18 | 66 | Exp | Med |
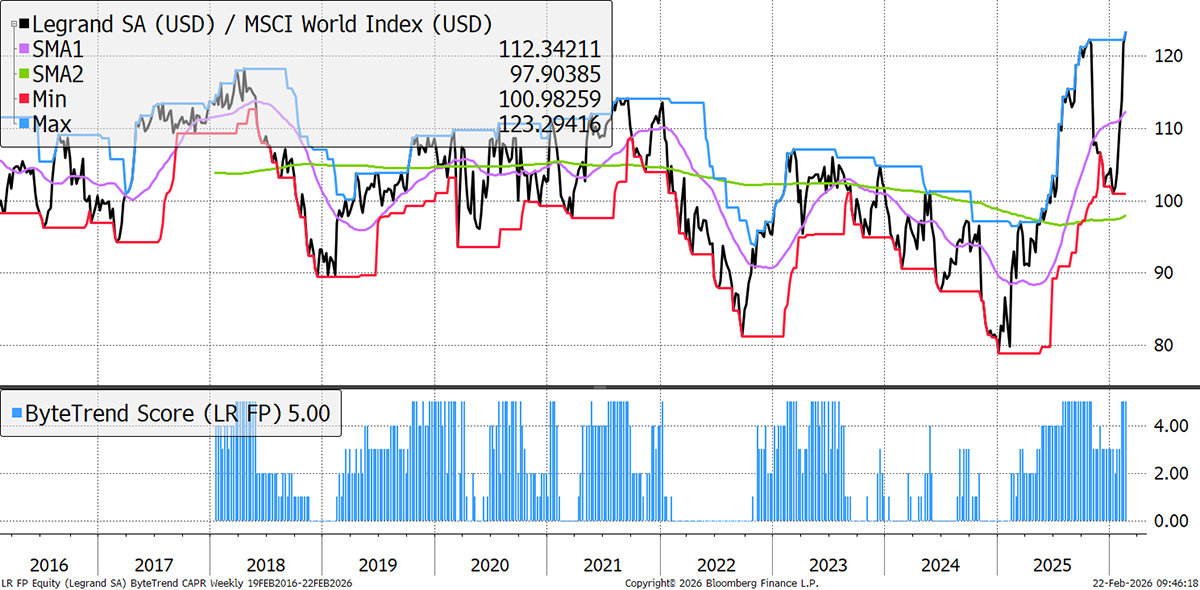
| Legrand S.A. | 26 | 48 | OV | Med |
Legrand
Legrand designs, manufactures, and markets products like wiring devices, home automation systems, and energy-efficient solutions, serving residential, commercial, and industrial markets worldwide, including data centres. These accounted for 26% of 2025 revenues and could reach 40% soon, following the acquisition of Kratos, a power equipment manufacturer. This segment grew 40% last year and has more than tripled since 2020.
Emerging Trends
These stocks are trading at the 30-week CAPR highs with a ByteTrend Score of less than 5. They don’t have to be in an uptrend, just emerging. All charts shown are CAPR rebased to 100.
| Name | Annual Vol 30w | Mkt Cap $Bn | Value | Growth |
| Roche Holding AG | 29 | 378 | FV | Low |
| Chevron Corporation | 18 | 368 | OV | Neg |
| The Coca-Cola Company | 13 | 343 | OV | Low |
| Merck & Co., Inc. | 33 | 305 | FV | High |
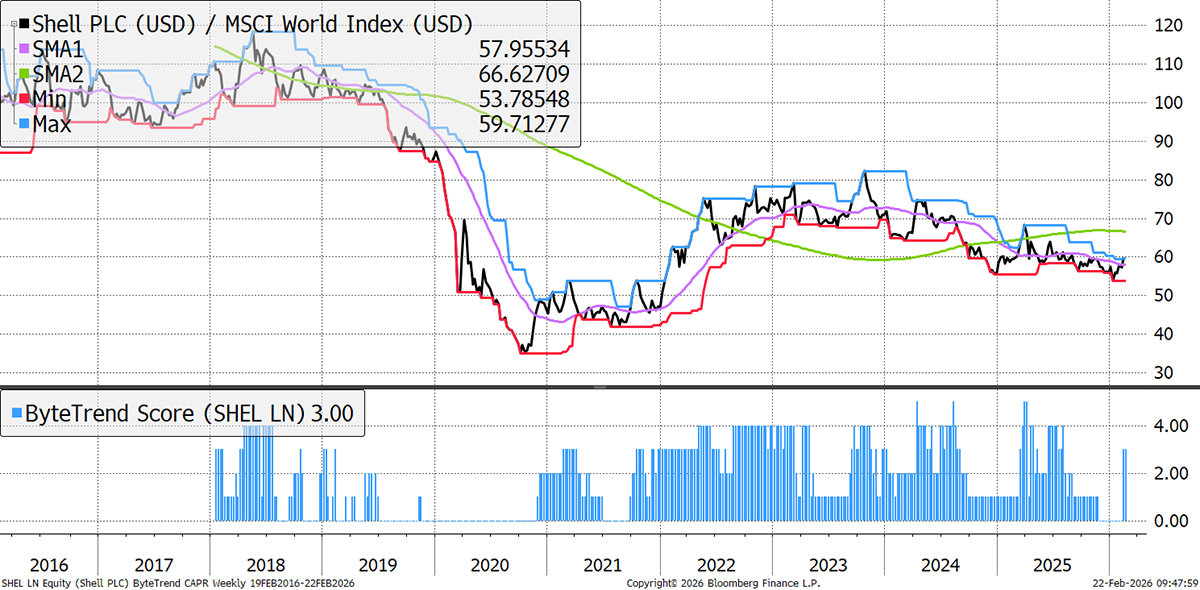
| Shell plc | 17 | 224 | FV | Neg |
| BHP Group Limited | 23 | 192 | OV | Neg |
| The Toronto-Dominion Bank | 12 | 163 | FV | High |
| Union Pacific Corporation | 19 | 158 | FV | Low |
| Honeywell International Inc. | 22 | 155 | OV | Med |
| Prologis, Inc. | 23 | 131 | FV | Good |
| GSK plc | 30 | 120 | FV | Low |
| China Petroleum & Chemical Corporation | 21 | 115 | OV | Neg |
| Bank of Montreal | 15 | 105 | OV | Good |
| The Bank of Nova Scotia | 13 | 96 | FV | Med |
| CSX Corporation | 21 | 79 | OV | Neg |
| Canadian Pacific Kansas City Ltd. | 20 | 77 | FV | Neg |
| SLB N.V. | 33 | 76 | FV | Good |
| Equinor ASA | 22 | 72 | FV | Neg |
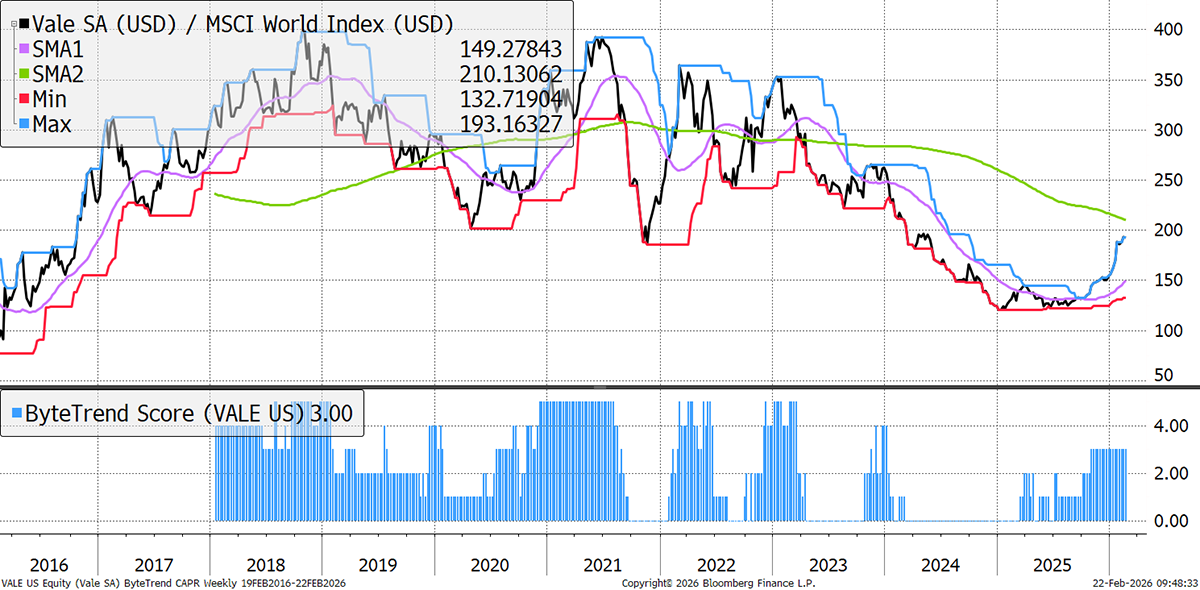
| Vale S.A. | 17 | 72 | OV | Neg |
| Shin-Etsu Chemical Co., Ltd. | 30 | 69 | OV | Med |
| Canadian National Railway Company | 17 | 68 | FV | Low |
| Becton, Dickinson and Company | 55 | 67 | Val | Med |
| Realty Income Corporation | 15 | 61 | FV | Good |
| Takeda Pharmaceutical Company Limited | 20 | 59 | OV | Neg |
| ONEOK, Inc. | 23 | 55 | FV | Med |
| Target Corporation | 27 | 53 | FV | Neg |
| Occidental Petroleum Corporation | 27 | 51 | FV | Neg |
| Diamondback Energy, Inc. | 25 | 50 | FV | Med |
Shell
Oil prices are spiking for geopolitical reasons, although the oil market remains in a comfortable surplus, hence the multi-year softness in the price. The broader commodities rally suggests it’s only a matter of time before oil joins in, and Shell’s strong operating performance has kept the stock steady even in a low-price environment. If free cash flow is strong at $60 oil, imagine what it will be at $100, say the bulls.
Vale
Stanley Druckenmiller, the legendary hedge fund manager, is betting big on Brazil as commodities rally and a long-oversold trend gains momentum. He is a powerful advocate of using trends in investment decision-making. Vale, the Brazilian multinational mining giant, was a ByteTree Venture recommendation on October 27, when it first came up in the Global Trends spreadsheet.
Weakening
These stocks are trading at the 30-week CAPR lows with a ByteTrend Score above 0. They are weakening trends but not yet downtrends. All charts shown are CAPR rebased to 100.
| Name | Annual Vol 30w | Mkt Cap $Bn | Value | Growth |
| Tencent Holdings Limited | 26 | 603 | Val | Good |
| International Business Machines Corporation | 29 | 240 | OV | High |
| Capital One Financial Corporation | 27 | 132 | OV | Low |
| Booking Holdings Inc. | 27 | 131 | Val | High |
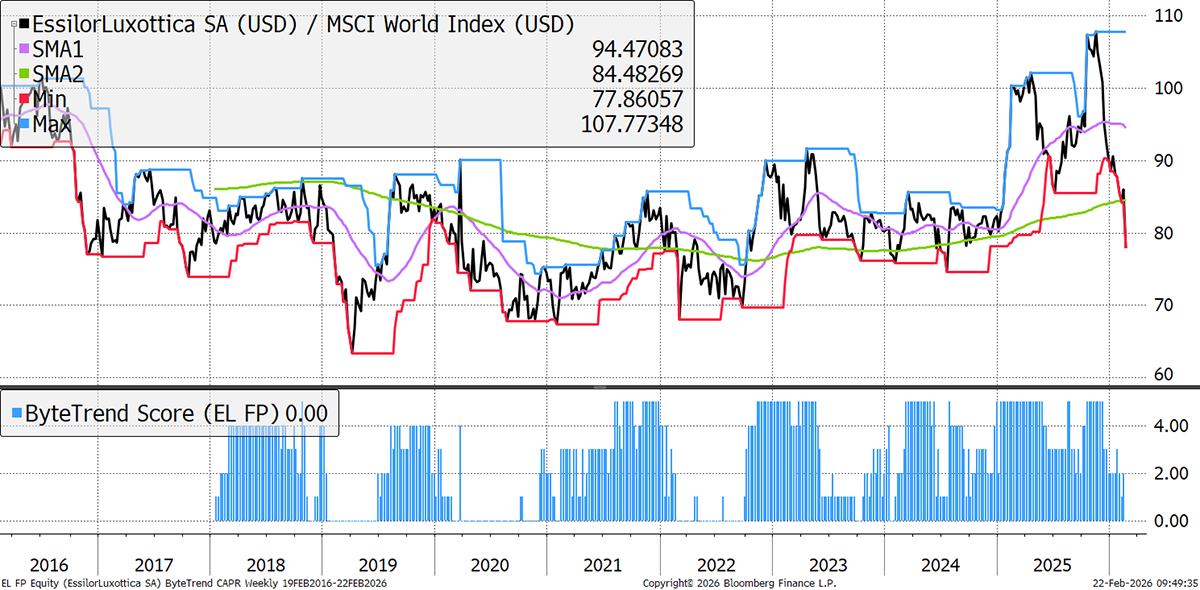
| EssilorLuxottica S.A. | 30 | 130 | FV | Med |
| Xiaomi Corporation | 32 | 117 | OV | High |
| Boston Scientific Corporation | 34 | 111 | FV | High |
| CrowdStrike Holdings, Inc. | 39 | 98 | FV | High |
| KKR & Co. Inc. | 32 | 90 | OV | High |
| Apollo Global Management, Inc. | 30 | 69 | OV | High |
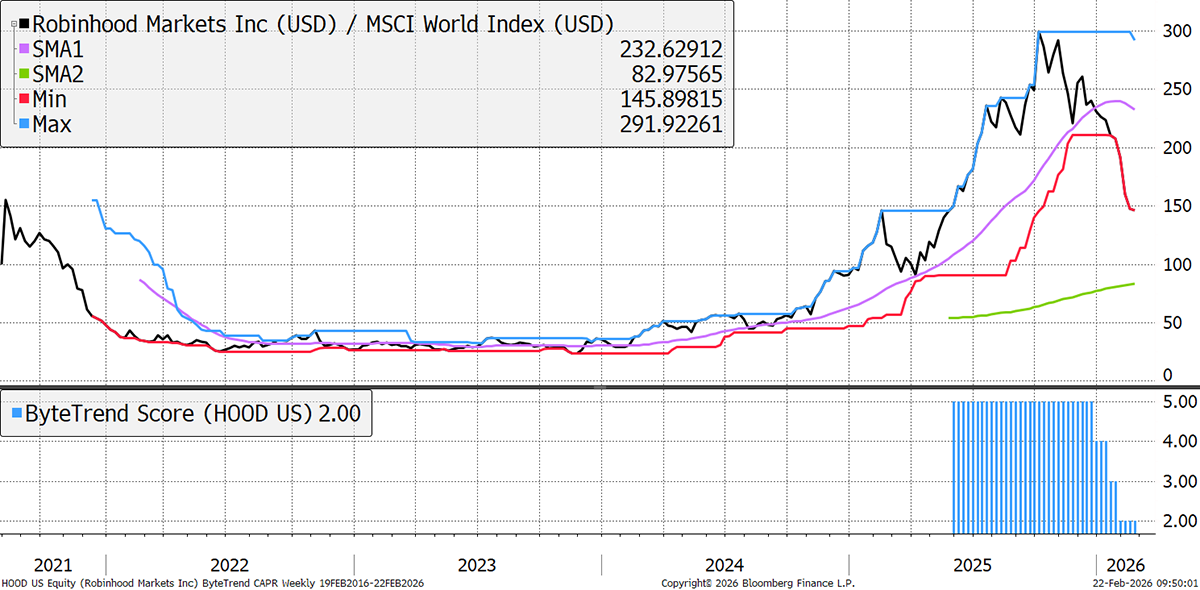
| Robinhood Markets, Inc. | 66 | 69 | Exp | High |
| Discover Financial Services | 0 | 50 |
EssilorLuxottica
Eyewear giant EL faces digital disruption, as mass adoption of AI-powered smart glasses from tech giants like Apple, Google, Alibaba, and Samsung could erode EssilorLuxottica's core business model of branded sunglasses. It also faces direct-to-consumer challenge from maturing upstart Warby Parker, and its recent results reflect this weakness.
Robinhood
Gamified retail trading app Robinhood recently enabled shorting for its clients, despite the legions of professional investors who say it is incredibly difficult to do profitably. Of course, Robinhood's profitability is not correlated with its clients’ profitability, but rather with its trading activity. It could be seen as an indicator of retail sentiment, and if so, watch out.
Bear Trends
These stocks are trading at the 30-week CAPR lows with a ByteTrend Score of 0. They are in a downtrend. All charts shown are CAPR rebased to 100.
| Name | Annual Vol 30w | Mkt Cap $Bn | Value | Growth |
| Microsoft Corporation | 21 | 2950 | FV | Med |
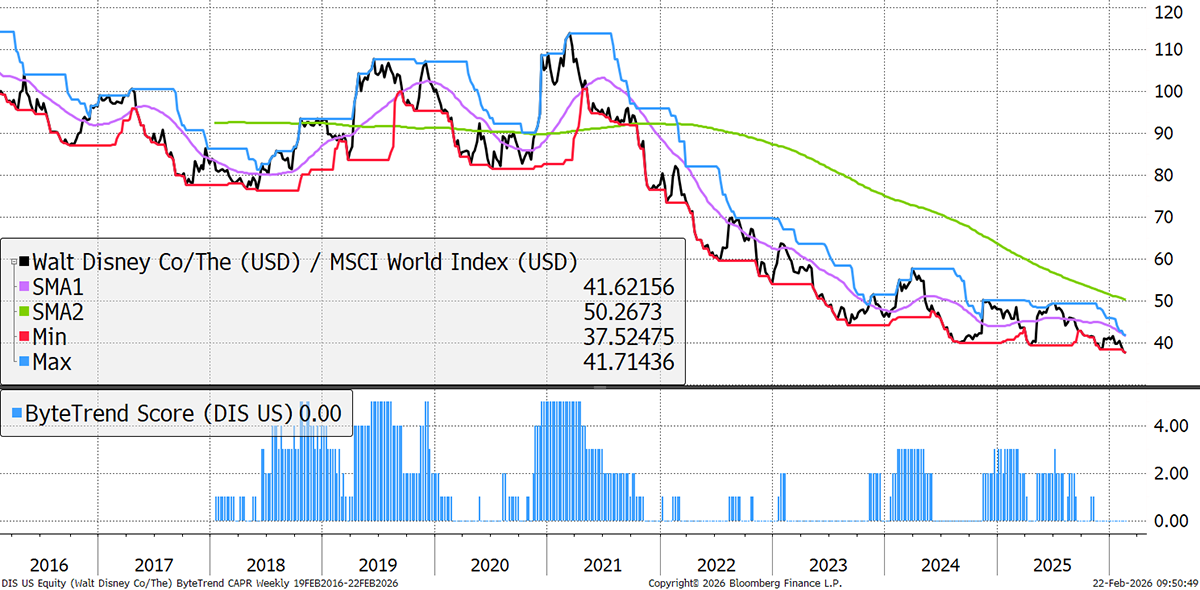
| The Walt Disney Company | 18 | 187 | FV | High |
| Salesforce, Inc. | 36 | 176 | Chp | High |
| The Charles Schwab Corporation | 20 | 171 | FV | Good |
| HDFC Bank Limited | 14 | 155 | Val | High |
| Blackstone Inc. | 29 | 146 | OV | Good |
| Accenture plc | 31 | 134 | Val | Med |
| Sony Group Corporation | 31 | 128 | OV | Good |
| Adobe Inc. | 29 | 108 | Chp | Good |
| Tata Consultancy Services Limited | 23 | 107 | Val | Med |
| Intuit Inc. | 39 | 106 | Chp | Good |
| Palo Alto Networks, Inc. | 39 | 104 | FV | Good |
| Marsh & McLennan Companies, Inc. | 21 | 90 | ||
| Automatic Data Processing, Inc. | 21 | 87 | FV | Good |
| NTT, Inc. | 14 | 79 | FV | Neg |
| NetEase, Inc. | 32 | 73 | Val | Good |
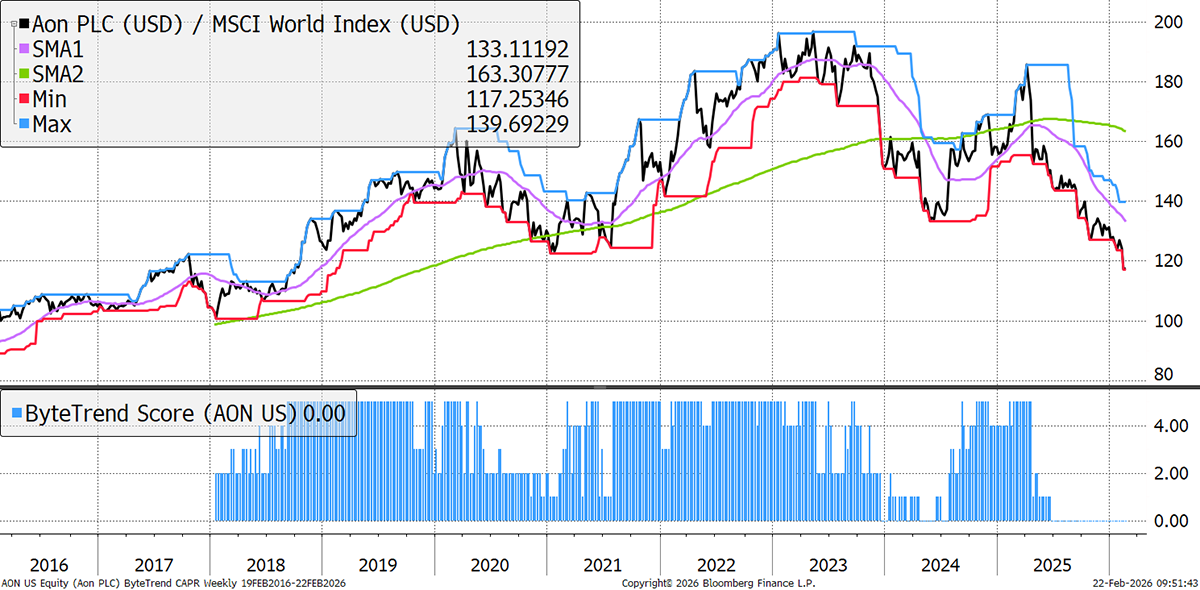
| Aon plc | 19 | 70 | FV | Med |
| Postal Savings Bank of China Co., Ltd. | 20 | 69 | FV | Low |
| Nongfu Spring Co., Ltd. | 25 | 68 | FV | Med |
| Hong Kong Exchanges and Clearing | 20 | 66 | FV | Med |
| PT Barito Renewables Energy Tbk | 35 | 64 | FV | Med |
| Meituan | 37 | 63 | Chp | High |
| Infosys Limited | 27 | 60 | FV | Good |
| Hindustan Unilever Limited | 18 | 60 | FV | Med |
| Saudi Telecom Company | 14 | 57 | FV | High |
| Recruit Holdings Co., Ltd. | 41 | 57 | FV | Good |
| PT Bank Central Asia Tbk | 23 | 53 | Val | Good |
Walt Disney
AI is a real threat to Disney. Any creative thinker is just a handful of prompts away from making a feature-length film, if you believe the hype, and while Disney’s IP is strong, historic, and broad, it’s hard to ignore that the barrier to entry for animated content is falling rapidly. Years of mixed management and executive turnover hardly strengthen its case, but its theme parks business continues to perform well, and its film business just had its ninth consecutive year as #1 globally. Disney is threatened, but far from finished.
AON
Insurance brokers are still struggling, and with the release of AI tools that could allow rapid personalisation of quotes and their purchase within a single portal, the traditional employee-heavy insurance brokerage business is now in the disrupters’ sights. The insurance market is softening after a few good years, making investors nervous despite solid recent results. The brokers may find themselves in a more competitive environment.
GTI 200 Spreadsheet
We are pleased to share the GTI 200 spreadsheet. Download the spreadsheet below to view the CAPR and local currency scores, and more, for the world’s largest 200 stocks. Have a look at the different groups and the main list “All stocks”. The Insights tab is interesting, and don’t forget to expand the columns by clicking on the “+” at the top of the page if you want to see more trend data.
Outlook
The World Index is changing shape more rapidly than usual. The rest of the world is now leading the USA for the first time since 2009. Tech and services are weak, yet hardware is king; it looks like a bubble that will break sooner or later. Energy is strong; the threat of war tends to do that.
Thanks for reading GTI.


