
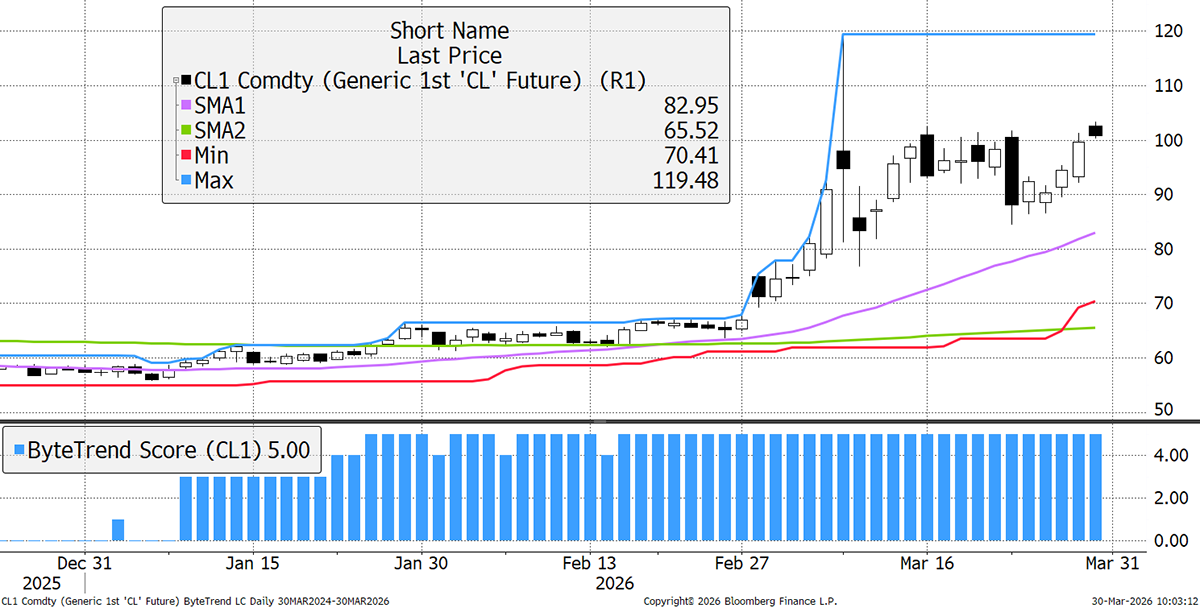
WTI Breaks $100 to Catch up with Brent


Issue 59;
- Global equities are on the brink amid the oil crisis.
- The VIX remains elevated but has yet to spike.
- Telecoms, Chinese banks, Chemicals, and Commodities provide shelter.
Global Trends is a deep dive into global equities. The aim of this analysis is to better understand which countries, sectors, industries, and stocks are driving market returns. Not only does it help investors identify opportunities, but it also highlights the risks. We try to condense as much important information as possible, focusing on what really matters each week. Embrace this as a weekly discipline, and you’ll soon have a much better understanding of global financial markets.
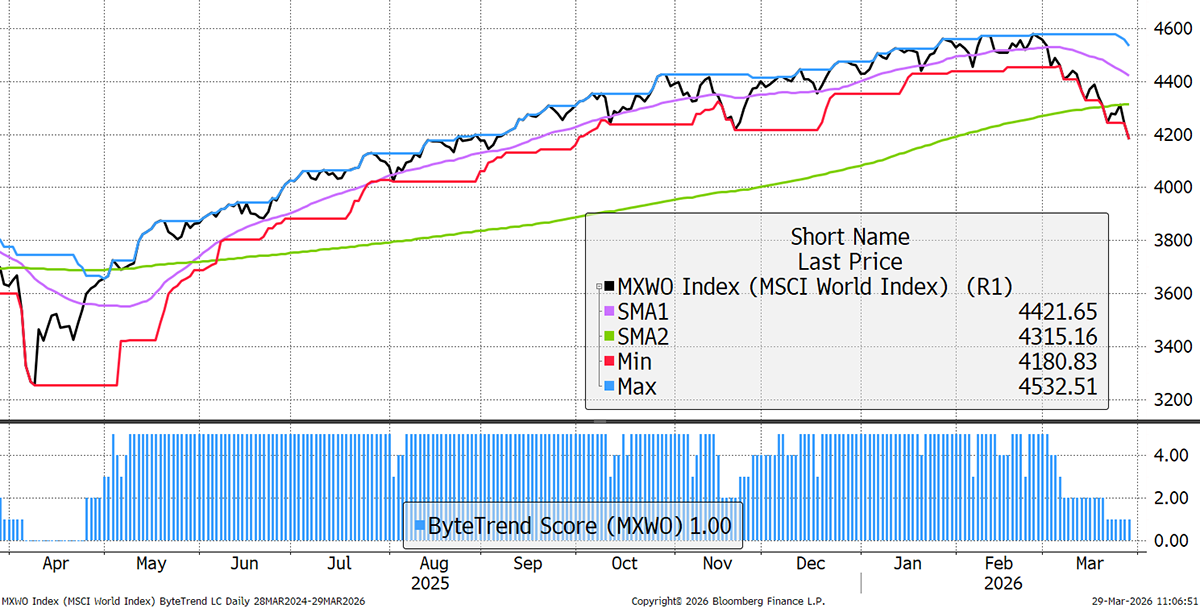
The World Index maintains a ByteTrend Score of 1 in USD. To get a score of 0, the 200-day moving average needs to turn down, which, if weakness persists, will happen soon.
World Index – Developed Markets – Daily
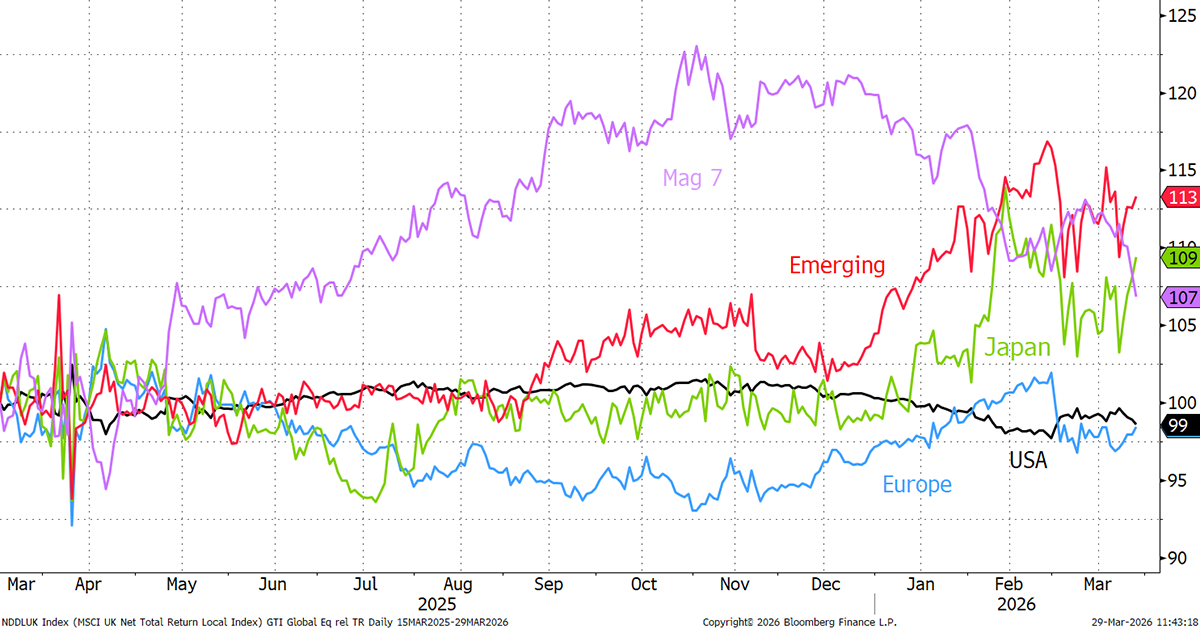
The Magnificent 7 Lag
The US is lagging the world, as CAPR returns to Emerging Markets, Europe and Japan. The weakness of the Magnificent 7, i.e. the largest US tech stocks, explains this.
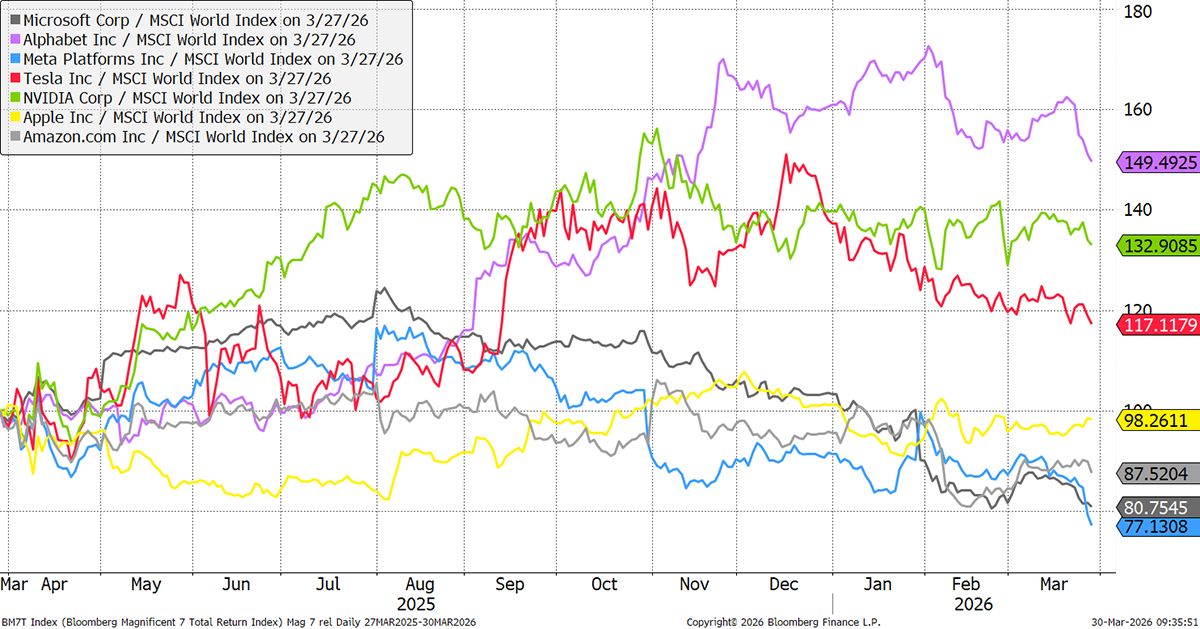
Magnificent 7 and Stocks - CAPR
Over the past year, the Magnificent 7 stocks have cooled. Four have lagged the world, and the leaders have now turned down. Continued weakness will become a drag on the S&P500.
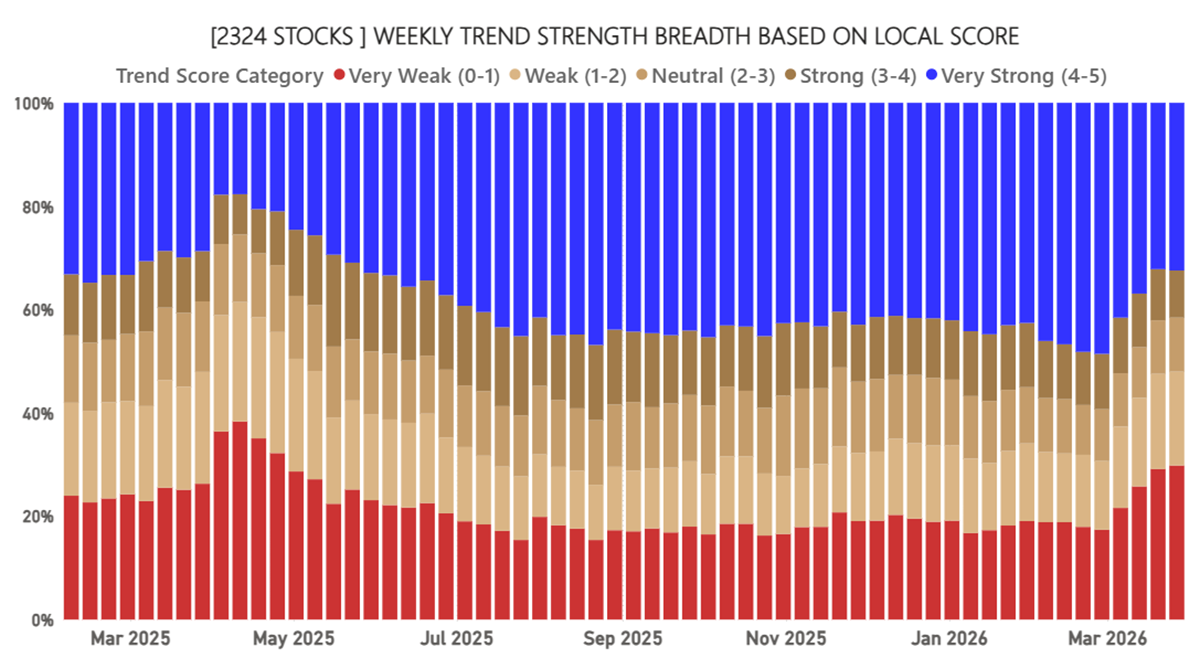
Global Equity Breadth – Local Currency
Surprisingly, breadth has been stable over the past week, as confirmed by other data sources. The World Index has been dragged down by the largest stocks, while the positive Trump narrative boosted many stocks last week. How long will the markets take Trump seriously?
Explosion in Bear Trends
The number of new price highs remains weak, but is fewer than last week. The number of bear trends is also slightly fewer than last week.

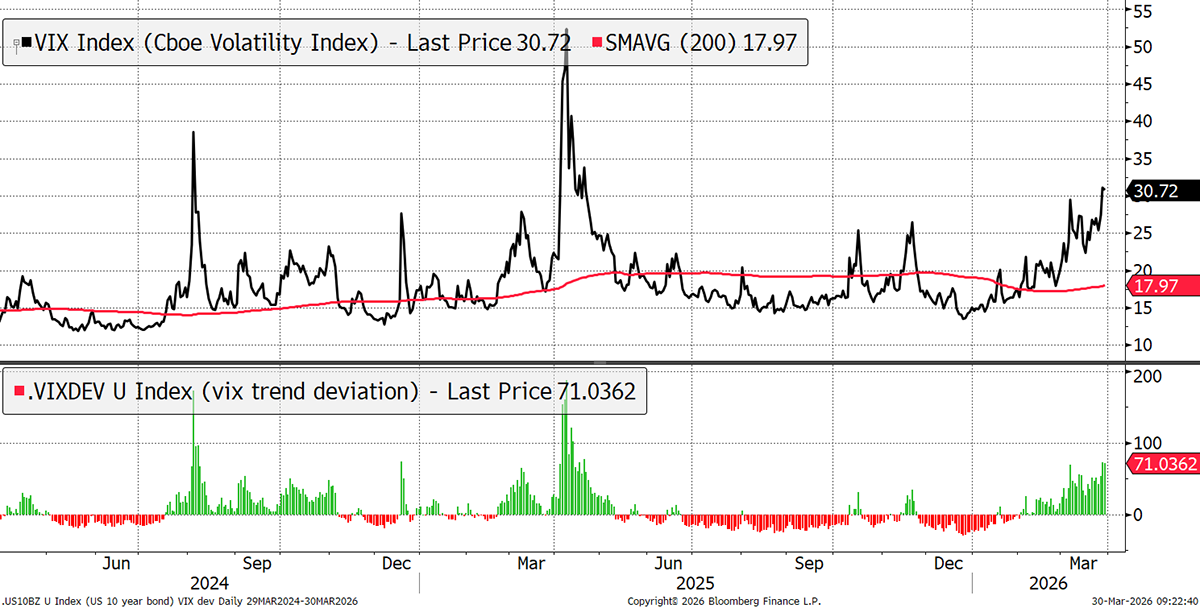
Equity Volatility
The VIX makes a new high, which is bearish. A contrarian bull signal would require the VIX to spike. That seems likely, in contrast to a calm market rally, which seems unlikely.
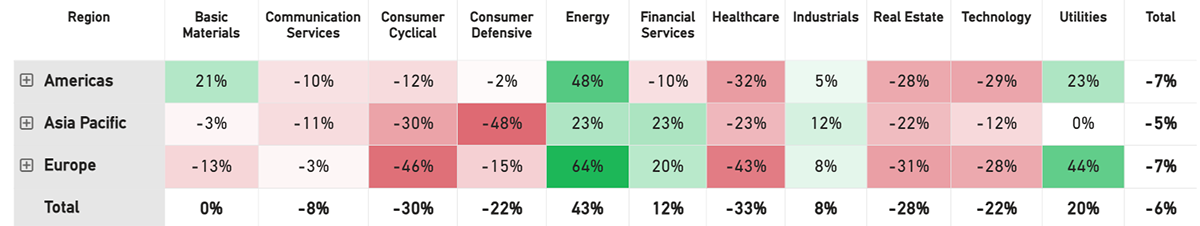
Net Winners
The winners, excluding losers, guide asset allocators. Energy, Utilities, Financial Services, and Industrials remain the overweights, while Healthcare, Consumer Cyclical, and Real Estate are the underweights.
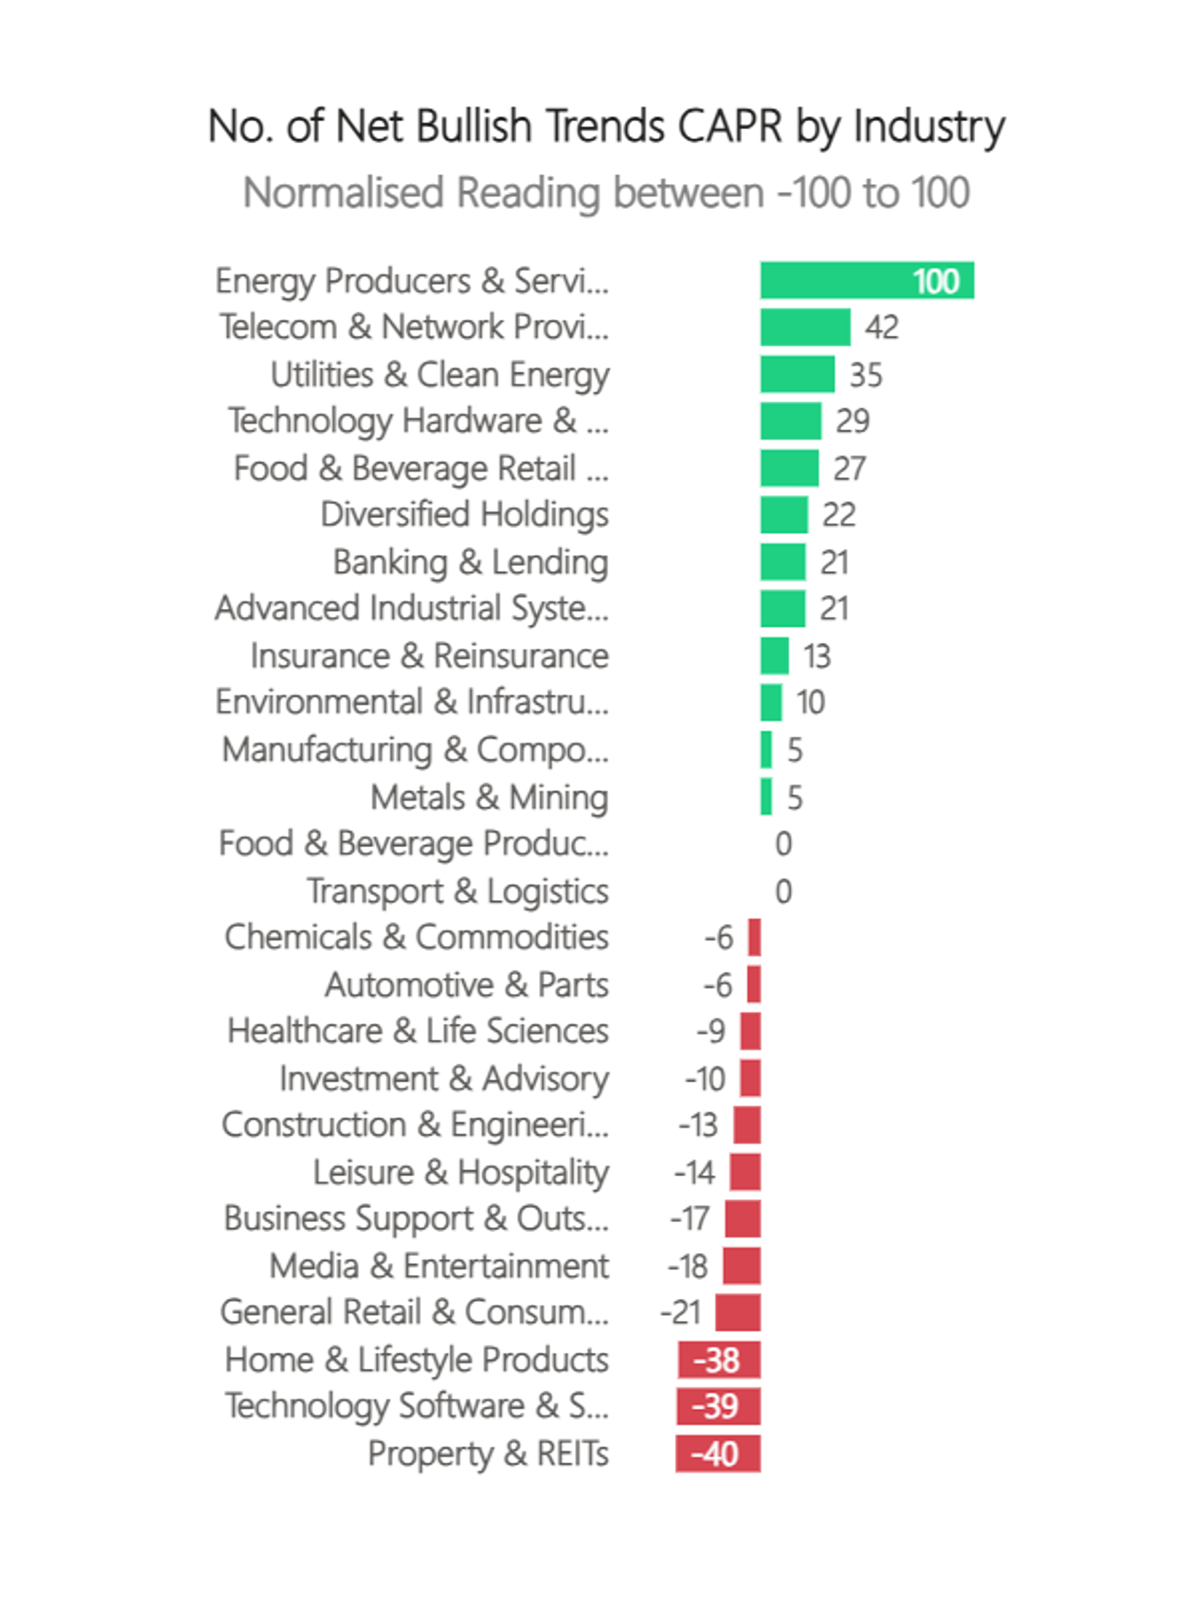
Industry Trend Changes in CAPR
Telecoms had a good week. These are the surprise defensive stocks, likely because they are heavily underowned despite being rate-sensitive. Clean Energy is buoyant alongside a rising oil price. Technology Hardware is off its peak, which was extreme. Home and Lifestyle (luxury) is weak alongside REITs, where the recovery has been postponed due to the higher rates outlook.
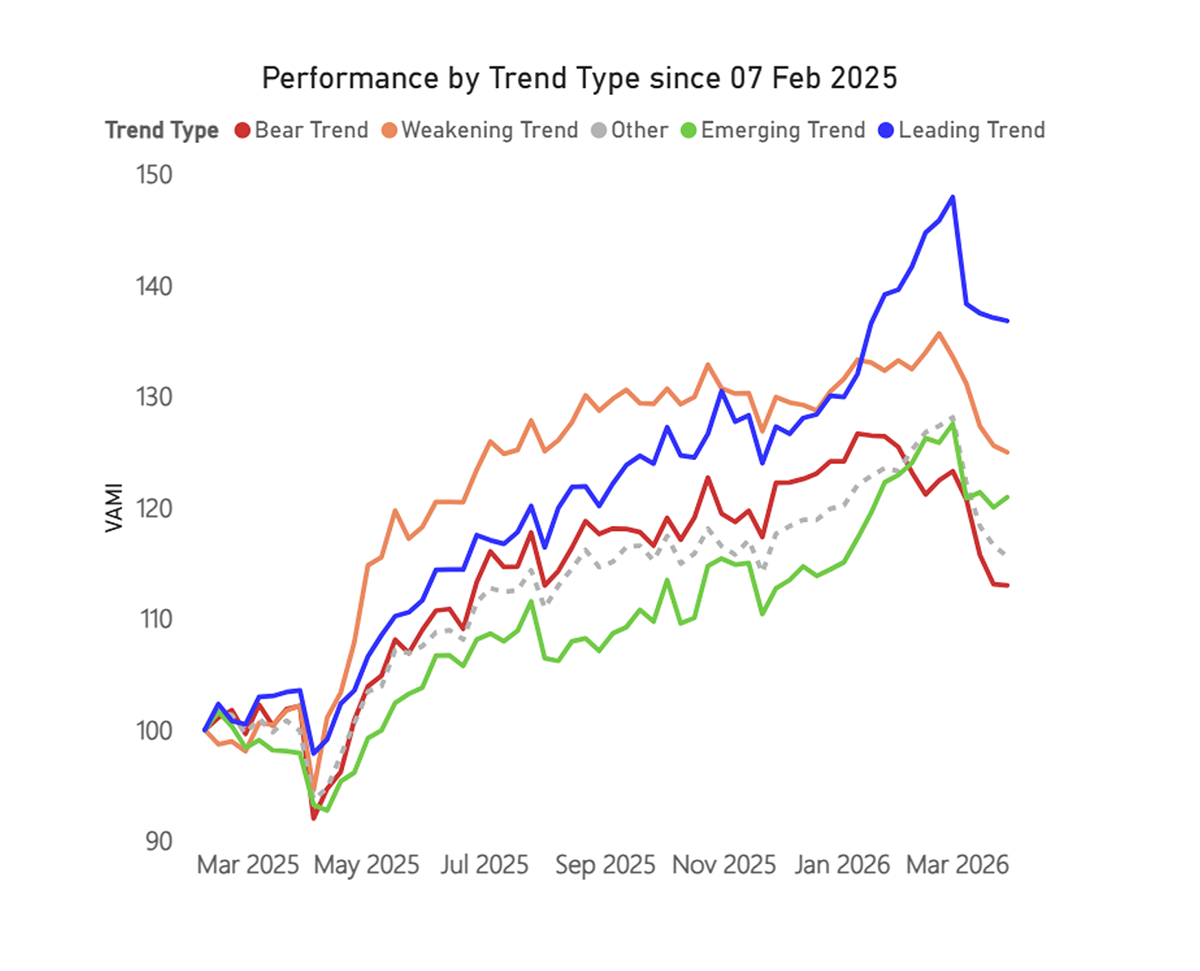
Trend Type Performance
This is still very much a momentum market in relative terms. The winners - energy, etc. - are holding up with losses concentrated within the weak groups. This is not always the case, and if we see a sharp drawdown in equities with a VIX spike, I would expect to see this chart rotate, with bearish stocks rallying while the leaders pull back. It feels much too early for this.
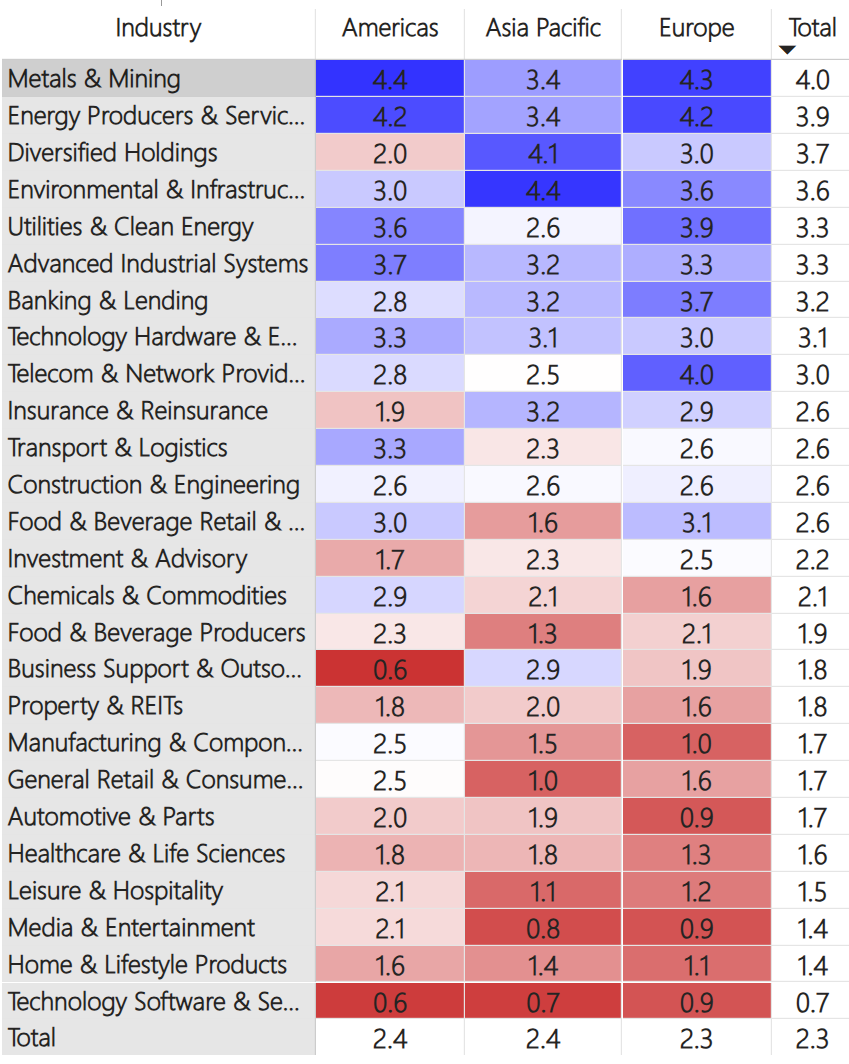
Regions and Industries Average CAPR Score
Energy Producers continue their rise to the top, but Metal and Mining hang on to the top spot despite a volatile week of trading for gold. It crashed first thing on Monday, 23 March, but steadily recovered ground as the war dragged on. Chemicals and Commodities are a notable riser too.
In relative terms, a number of other industries picked up last week, notably defensive sectors such as Utilities, Insurance, Telecoms, and Banking and Lending. On the downside, Advanced Industrials weakened further, as they are most sensitive to the refined products, gases, and other chemicals required for complex industrial processes. Technology Hardware maintains its strength as semiconductors remain strong.
User Guide
Refer to our GTI: User Guide for an overview of the key concepts and terminology used in this report. These concepts may take a little bit of getting used to, but they are very powerful once you do.
How to Read the Tables
The Value Composite Score (Value) is measured against the company’s own financial history and not in absolute terms. The columns are Cheap (Chp), Value (Val), Fair Value (FV), Overvalued (OV), and Expensive (Exp). The Growth Composite Score (Growth) is measured by sales, earnings, cash flow, dividends, and book value on a per share basis. The columns are High, Good, Medium (Med), Low, and Negative (Neg).
Leading Trends with New Highs
These stocks are trading at the 30-week CAPR highs with a ByteTrend Score of 5. All charts shown are CAPR rebased to 100.
| Name | Annual Vol 30w | Mkt Cap $Bn | Value | Growth |
| Exxon Mobil Corporation | 20 | 712 | OV | Neg |
| Costco Wholesale Corporation | 21 | 436 | OV | Good |
| Industrial and Commercial Bank of China | 19 | 378 | FV | Low |
| PetroChina Company Limited | 28 | 344 | OV | Med |
| Cisco Systems, Inc. | 26 | 316 | OV | Low |
| Shell plc | 20 | 261 | OV | Neg |
| Bank of China Limited | 16 | 252 | FV | Med |
| China Construction Bank Corporation | 19 | 248 | FV | Low |
| GE Vernova Inc. | 36 | 231 | OV | Med |
| AT&T Inc. | 24 | 204 | OV | Med |
| TotalEnergies SE | 20 | 192 | OV | Neg |
| The TJX Companies, Inc. | 14 | 173 | OV | Good |
| Iberdrola, S.A. | 14 | 149 | OV | Med |
| Petróleo Brasileiro S.A. - Petrobras | 31 | 133 | OV | Neg |
| Mitsubishi Corporation | 29 | 133 | Exp | Good |
| DBS Group Holdings Ltd | 15 | 126 | OV | High |
| British American Tobacco p.l.c. | 25 | 125 | OV | Neg |
| Chubb Limited | 19 | 124 | FV | Good |
| Delta Electronics, Inc. | 44 | 122 | Exp | Good |
| Enbridge Inc. | 17 | 119 | OV | Good |
| BP p.l.c. | 24 | 119 | OV | Neg |
| Mitsui & Co., Ltd. | 28 | 117 | Exp | Med |
| Dell Technologies Inc. | 46 | 116 | OV | High |
| Delta Electronics (Thailand) Public | 49 | 105 | Exp | High |
| Canadian Natural Resources Limited | 25 | 105 | OV | Low |
| Equinor ASA | 33 | 103 | OV | Neg |
| Vertiv Holdings Co | 52 | 96 | Exp | High |
| Equinix, Inc. | 25 | 95 | FV | Good |
| General Dynamics Corporation | 16 | 94 | FV | Med |
| The Williams Companies, Inc. | 23 | 90 | Exp | Neg |
| Bank of Communications Co | 17 | 88 | FV | Neg |
| Marvell Technology, Inc. | 49 | 83 | OV | Good |
| Quanta Services, Inc. | 26 | 82 | Exp | High |
| Eni S.p.A. | 22 | 81 | OV | Neg |
| The Bank of New York Mellon | 17 | 80 | OV | High |
| Suncor Energy Inc. | 23 | 79 | OV | Neg |
| Valero Energy Corporation | 35 | 76 | OV | Neg |
| Kinder Morgan, Inc. | 20 | 76 | OV | Low |
| Phillips 66 | 31 | 75 | OV | Neg |
| Oversea-Chinese Banking | 15 | 75 | OV | Good |
| Marathon Petroleum Corporation | 36 | 74 | OV | Neg |
| Ross Stores, Inc. | 18 | 69 | OV | Good |
| Hilton Worldwide Holdings Inc. | 19 | 68 | OV | Good |
| Japan Tobacco Inc. | 19 | 66 | OV | Good |
| Imperial Oil Limited | 33 | 65 | Exp | Neg |
| Cheniere Energy, Inc. | 29 | 64 | OV | High |
| Baker Hughes Company | 34 | 62 | OV | Good |
| ONEOK, Inc. | 24 | 59 | FV | Med |
| Diamondback Energy, Inc. | 26 | 57 | FV | Neg |
| Ciena Corporation | 57 | 57 | Exp | Good |
| Targa Resources Corp. | 29 | 54 | Exp | Good |
| Orange S.A. | 18 | 53 | Exp | Neg |
| Entergy Corporation | 23 | 50 | OV | Good |
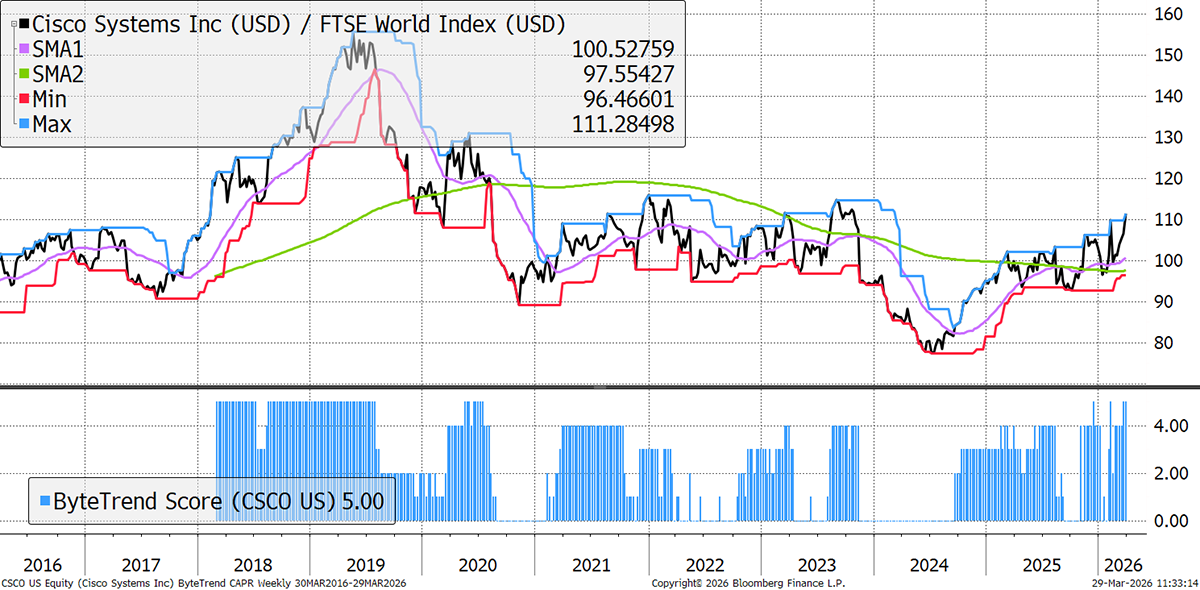
Cisco
Technology Hardware stocks have remained resilient during this crisis, which may surprise some. Cisco is now a networking and enterprise infrastructure company. It sells routers, switches, wireless gear, security products, and more for telecom networks. It is linked to the AI data centre trade, which is strong enough to offset some of the conflict weakness, and Cisco’s specific work on AI Agent infrastructure (it’s working with Nvidia) may also be helping.
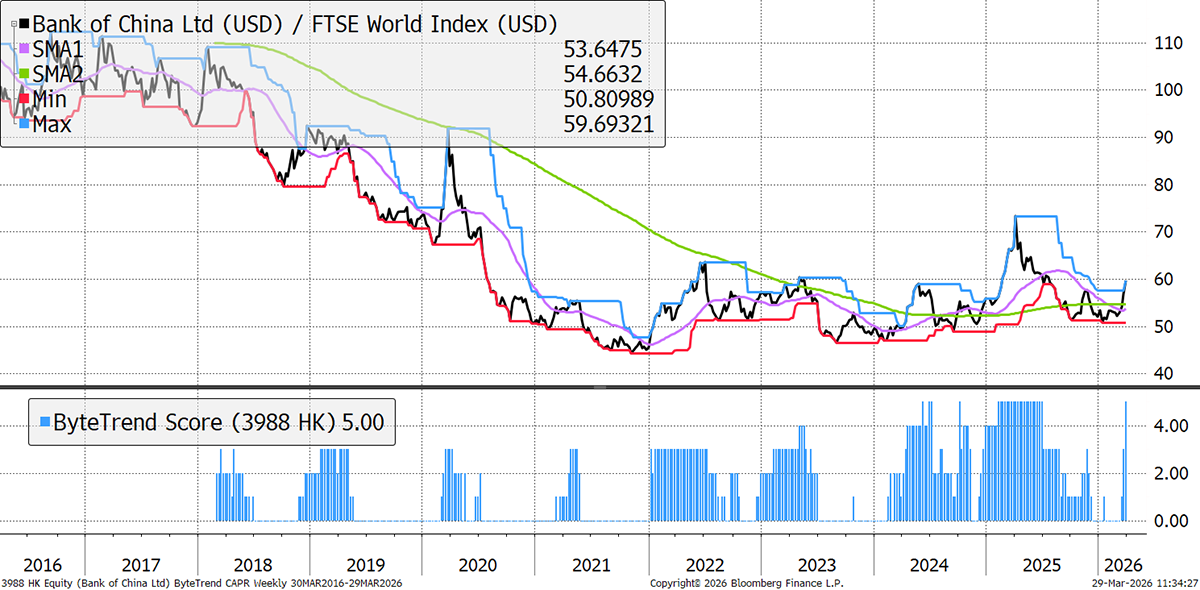
Bank of China
Chinese banks keep popping up. They have limited exposure to the Middle East in general, and EM investors may be gravitating toward the larger safe-haven countries rather than frontier markets during this crisis.
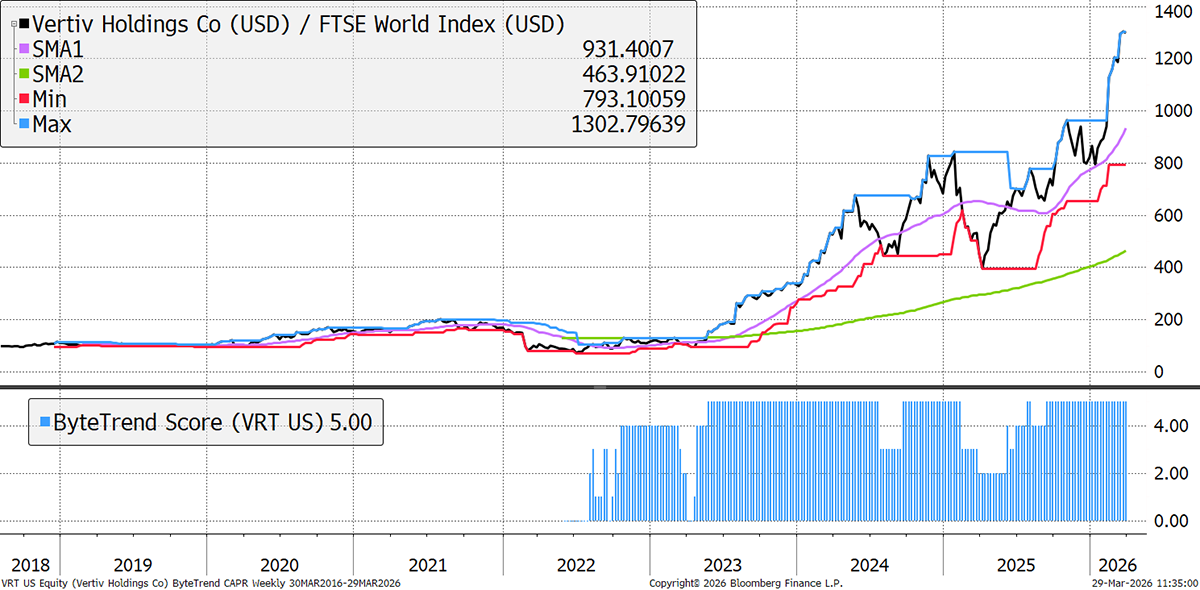
Vertiv
Vertiv makes power, cooling, and other critical infrastructure for data centres and networks, so it is an AI picks and shovels trade – hence the chart. This trade is not hugely exposed to the oil price, as data centres are more sensitive to electricity prices. Like many Tech Hardware peers, Vertiv is seeing rapid growth and rising backlogs with growing margins.
New Leading Trends
These stocks are trading at the 30-week CAPR highs with a ByteTrend Score of 5, except they are new trends this week, having previously had a score below 5. All charts shown are CAPR rebased to 100.
| Name | Annual Vol 30w | Mkt Cap $Bn | Value | Growth |
| Altria Group, Inc. | 25 | 112 | FV | Med |
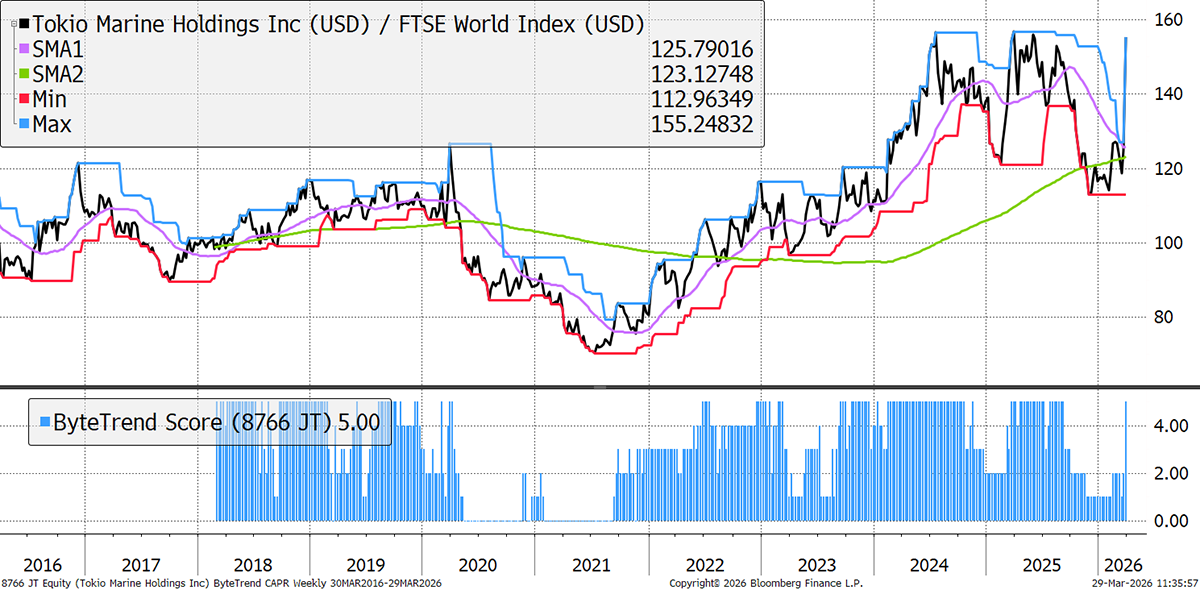
| Tokio Marine Holdings, Inc. | 39 | 89 | OV | High |
| China CITIC Bank Corporation | 21 | 66 | OV | Low |
Tokio Marine
Berkshire Hathaway bought a $1.8bn stake in Tokio Marine, the Japanese insurer, last week. Higher war-risk premiums around the Middle East may help its pricing, but they also raise claims and reinsurance uncertainty. Buffett bought the Japanese trading houses in 2019-2020, and Berkshire is following up with more Japanese financials. Take note.
Emerging Trends
These stocks are trading at the 30-week CAPR highs with a ByteTrend Score of less than 5. They don’t have to be in an uptrend, just emerging. All charts shown are CAPR rebased to 100.
| Name | Annual Vol 30w | Mkt Cap $Bn | Value | Growth |
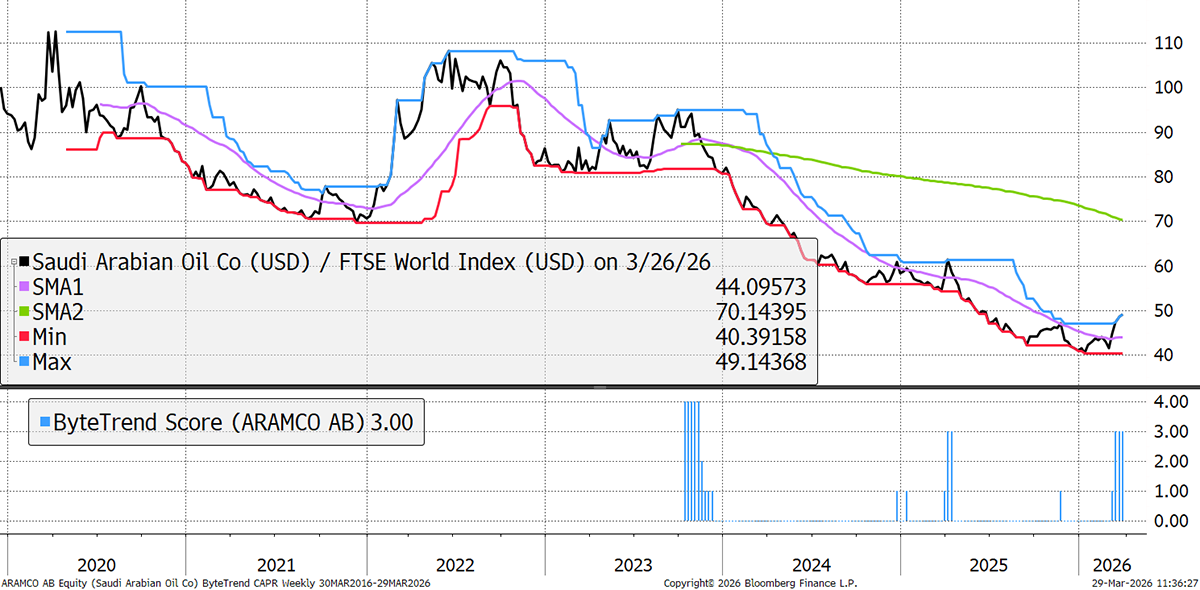
| Saudi Arabian Oil Company | 16 | 1742 | FV | Neg |
| Johnson & Johnson | 19 | 579 | OV | Good |
| Chevron Corporation | 19 | 422 | OV | Neg |
| The Coca-Cola Company | 16 | 326 | OV | Low |
| Merck & Co., Inc. | 32 | 296 | FV | High |
| Linde plc | 20 | 228 | OV | Med |
| Verizon Communications | 24 | 212 | FV | Med |
| NextEra Energy, Inc. | 21 | 190 | FV | Good |
| ConocoPhillips | 27 | 164 | OV | Neg |
| Pfizer Inc. | 27 | 154 | Val | Med |
| The Toronto-Dominion Bank | 13 | 153 | FV | High |
| Bristol-Myers Squibb | 25 | 119 | FV | Med |
| AIA Group Limited | 32 | 114 | FV | Good |
| The Southern Company | 17 | 107 | FV | Med |
| Duke Energy Corporation | 17 | 101 | FV | Good |
| Glencore plc | 30 | 84 | Exp | Neg |
| EOG Resources, Inc. | 25 | 81 | FV | Neg |
| SLB N.V. | 38 | 80 | FV | Good |
| América Móvil, S.A.B. de C.V. | 27 | 75 | FV | High |
| CSX Corporation | 21 | 74 | OV | Neg |
| American Electric Power | 21 | 70 | FV | Med |
| The Saudi National Bank | 25 | 67 | Val | Good |
| TC Energy Corporation | 18 | 66 | OV | High |
| Air Products and Chemicals | 26 | 65 | OV | Low |
| Occidental Petroleum | 30 | 64 | OV | Neg |
| Sempra | 24 | 63 | OV | Low |
| Digital Realty Trust, Inc. | 25 | 60 | FV | High |
| Takeda Pharmaceutical | 18 | 58 | OV | Neg |
| Corteva, Inc. | 23 | 55 | OV | High |
| Target Corporation | 26 | 54 | FV | Med |
| Dominion Energy, Inc. | 21 | 53 | FV | Good |
| BASF Se | 29 | 53 | OV | Neg |
| Cenovus Energy Inc. | 30 | 51 | OV | Neg |
| Electronic Arts Inc. | 17 | 51 | OV | Med |
Saudi Aramco
The world’s largest oil company faces obvious physical risk from this conflict, but it is rising. Its blockbuster IPO looks overpriced, and came before a weak period for oil, but having underperformed ever since, perhaps this is its moment. Ras Tanura has been the main Aramco facility hit so far. It was targeted by an Iranian drone, with the strike causing falling debris and a fire that led to a precautionary shutdown, but reports say the physical damage was limited.
Weakening
These stocks are trading at the 30-week CAPR lows with a ByteTrend Score above 0. They are weakening trends but not yet downtrends. All charts shown are CAPR rebased to 100.
| Name | Annual Vol 30w | Mkt Cap $Bn | Value | Growth |
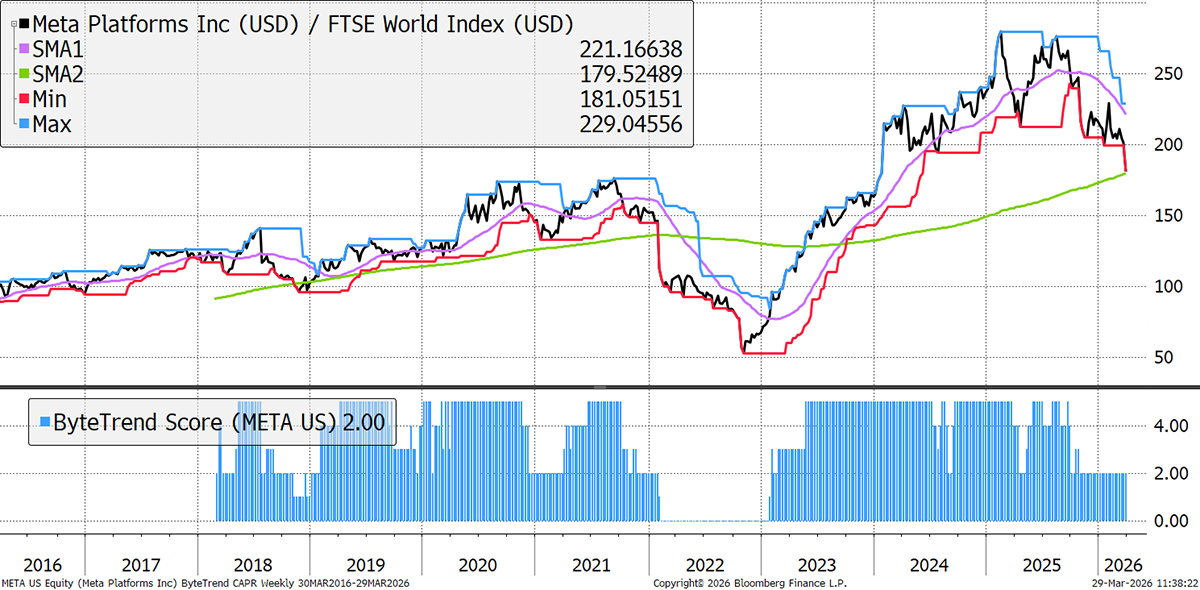
| Meta Platforms, Inc. | 36 | 1325 | FV | High |
| Hermès International | 29 | 196 | FV | Good |
| SAP SE | 26 | 192 | FV | High |
| Safran S.A. | 25 | 134 | OV | High |
| Prosus N.V. | 35 | 98 | Val | High |
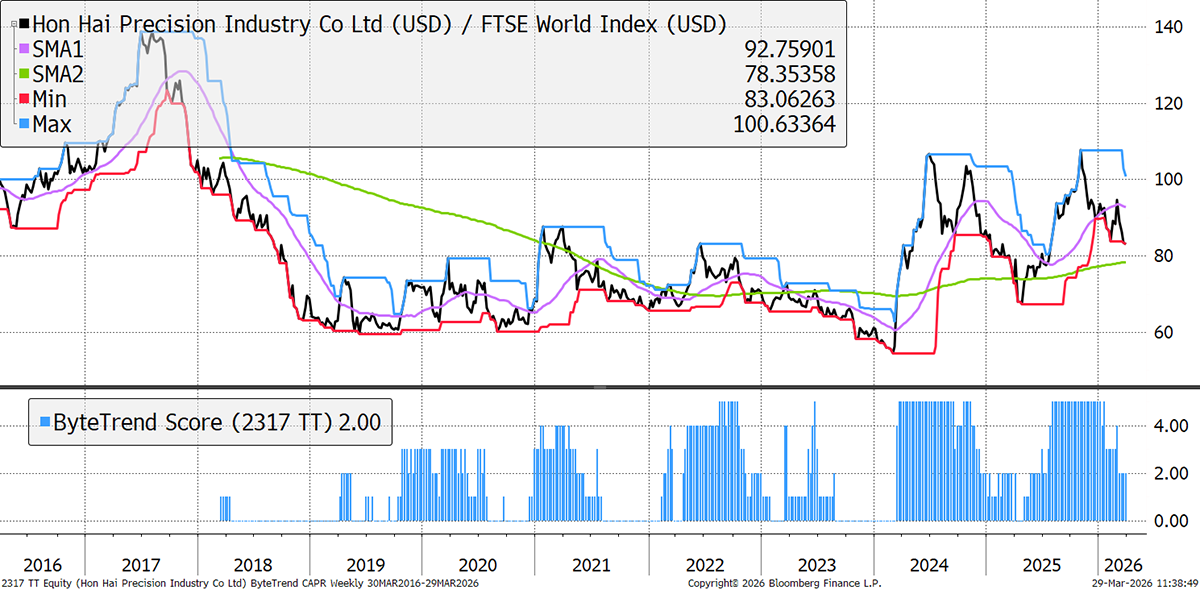
| Hon Hai Precision Industry Co., Ltd. | 30 | 87 | Exp | Good |
| MercadoLibre, Inc. | 39 | 81 | Chp | High |
| Rheinmetall AG | 46 | 74 | Exp | High |
| Cintas Corporation | 22 | 66 | OV | Good |
| TransDigm Group Incorporated | 25 | 64 | FV | High |
| DoorDash, Inc. | 47 | 64 | Val | High |
| Robinhood Markets, Inc. | 63 | 59 | OV | High |
Meta Platforms
Meta had a very bad week. It has huge capex plans (35% of sales already) with uncertain returns hanging over the stock. Then it suffered two major court losses last week, raising fears about content moderation failures on Facebook and Instagram. It also put a $9.6tn valuation into its latest round of stock options for senior staff, indicating a 620% gain from Friday’s close, within five years. Given the timing, this was seen as somewhat tone deaf.
Hon Hai Precision Industry
Hon Hai is known to us as Foxconn, the world's largest contract electronics manufacturer, building iPhones, EVs, and AI equipment for clients like Apple and Nvidia. Its financial performance is very strong, given its AI exposure, but heavy capex requirements are a fear, and a profit miss in its latest results on thinner margins caused concern. They are negatively impacted by the shortage of memory chips.
Bear Trends
These stocks are trading at the 30-week CAPR lows with a ByteTrend Score of 0. They are in a downtrend. All charts shown are CAPR rebased to 100.
| Name | Annual Vol 30w | Mkt Cap $Bn | Value | Growth |
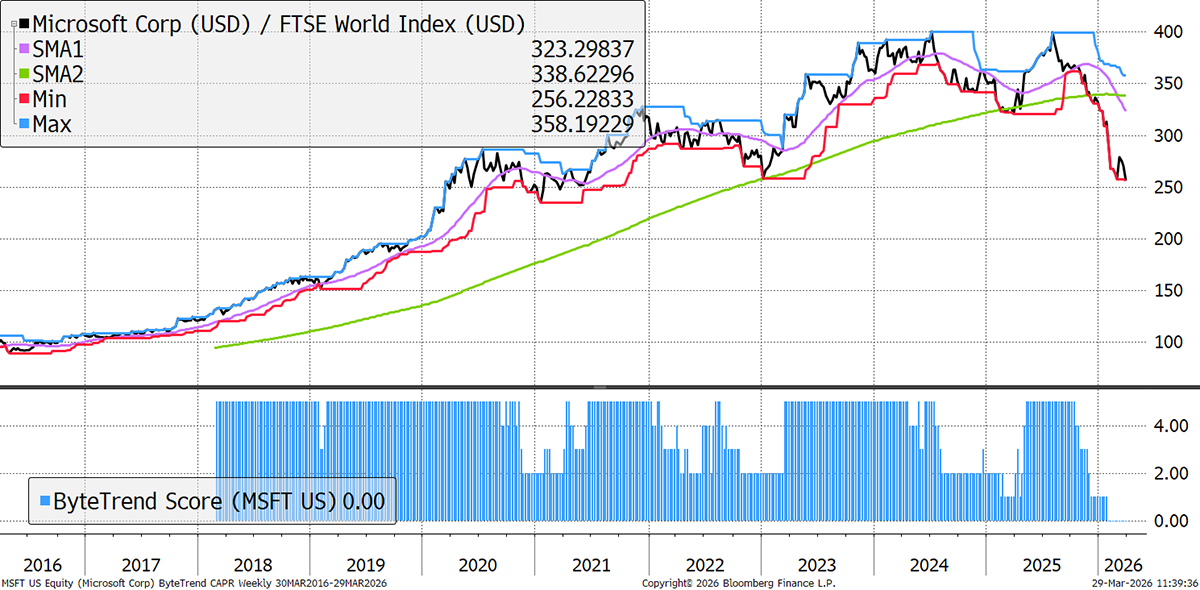
| Microsoft Corporation | 24 | 2649 | FV | Med |
| The Walt Disney Company | 19 | 164 | Val | High |
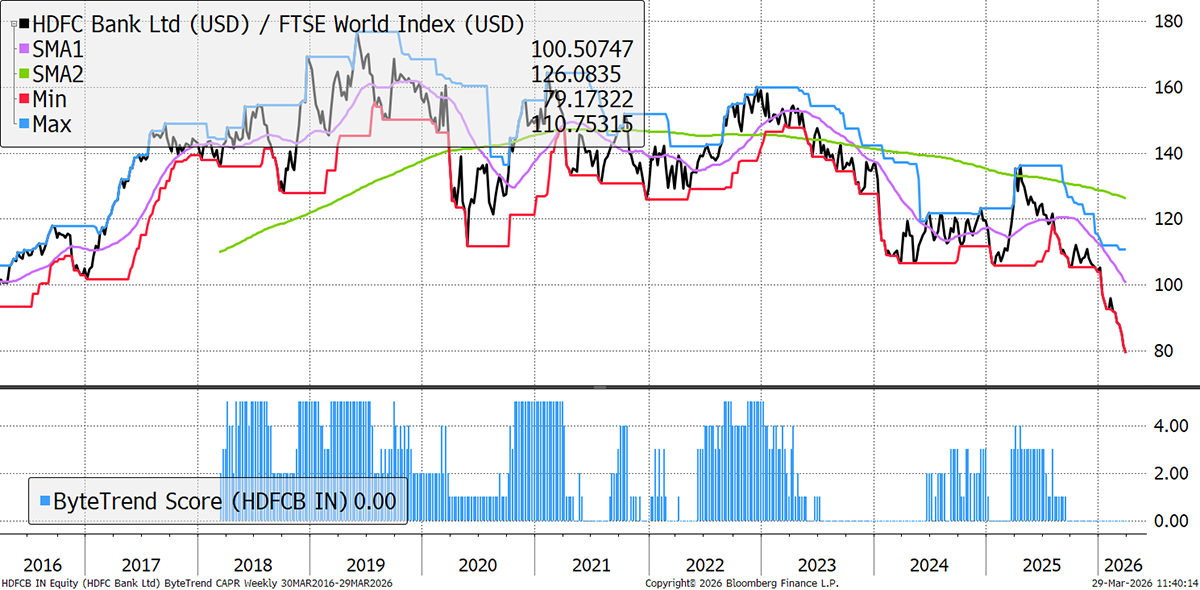
| HDFC Bank Limited | 16 | 123 | Val | High |
| Adobe Inc. | 34 | 96 | Chp | Good |
| ICICI Bank Limited | 17 | 93 | FV | High |
| Tata Consultancy Services | 23 | 91 | Val | Med |
| NIKE, Inc. | 34 | 76 | Val | Neg |
| Snowflake Inc. | 41 | 53 | FV | Good |
| Hindustan Unilever Limited | 16 | 51 | FV | Med |
Microsoft
Microsoft, one of the world’s leading companies, is not simply a victim of the Iran War. Instead, its underperformance began in late summer 2025. Its software offering is world-leading, but the software crash left no company untouched. Azure growth remains strong, but is slowing. Once again, huge capex is a fear, and its dependency on OpenAI is a final vulnerability. Its late October valuations (14x sales) were its highest since 2000, when it reached 28x.
HDFC
India has been weak for months. HDFC is India's largest private-sector bank by assets and market cap. The shock resignation of Chairman Atanu Chakraborty, citing “values and ethics” issues, is one factor creating fear, while three senior staff in the UAE have been fired for their association with Credit Suisse’s AT1 bond mis-selling scandal. It is also suffering from bloat and complications following its large 2023 merger.
GTI 200 Spreadsheet
We are pleased to share the GTI 200 spreadsheet. Download the spreadsheet below to view the CAPR and local currency scores, and more, for the world’s largest 200 stocks. Have a look at the different groups and the main list “All stocks”. The Insights tab is interesting, and don’t forget to expand the columns by clicking on the “+” at the top of the page if you want to see more trend data.
Outlook
The World Index remains below the 200-day moving average, and capitulation is yet to happen. The Chinese banks are interesting and cheap, as the country plays its neutral card. WTI (US oil) is the political hot potato. Despite an intraday break early in the war, Trump reassured markets whenever $100 was at risk. That level has been broken, announcement incoming.
WTI Oil
Thanks for reading GTI.


