Bull Market or Bubble?


Issue 25;
Since early May, the world Index has been in an uptrend with a ByteTrend Score of 5. The market is strong but not yet in a true bull market. The index is up 17% in 12 months, or 12% this year in USD, but when translated to GBP falls to 4%, and in EUR -1%. In terms of value creation, this bull is strong, but less so than it may seem.
World Index – Developed Markets – Daily rebased to 100
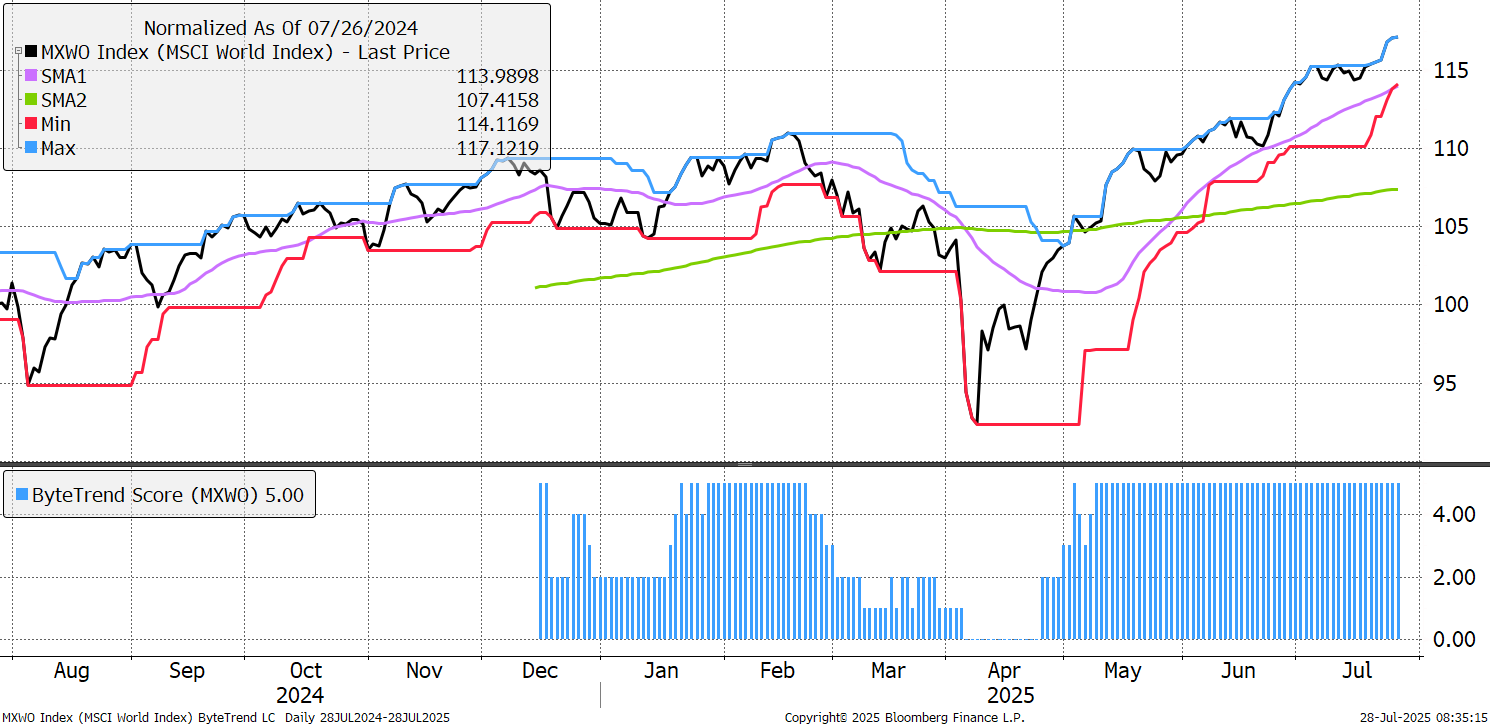
One powerful driver, other than the weak dollar, has been a weak bond market. Investors have been keen to diversify away from falling bonds and that has contributed to higher equity returns.
Yet the scale of the outperformance over bonds is remarkable. For reference see 1987, the great stockmarket crash, which was preceded by a 58% fall in the long bond. This time, the long bond capital value has fallen by 68%.
S&P 500 and the Long Bond (capital values)
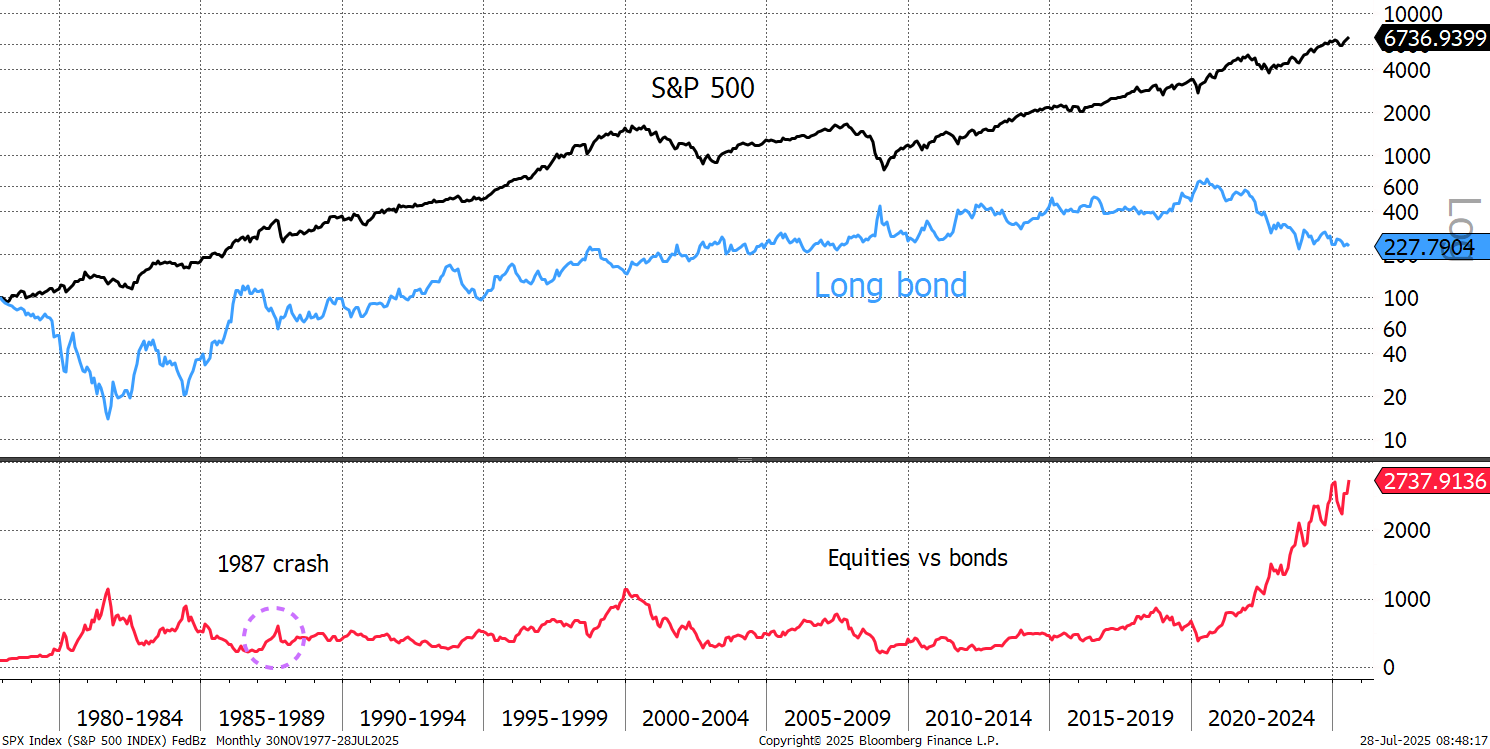
The risk is to this bull market, which is being driven by a strong money supply, budget deficits, a weak dollar, and growing earnings, is that those things going into reverse. Naturally a decline in earnings would not go down well, but fiscal prudence could be even worse. That would stabilise the bond market and restore confidence in bonds. The long bond real yield (yield after inflation) is 2.5%, which is historically high, and compelling once investors are convinced that inflation is back in the bottle. In other words, the risk to the stockmarket is that politicians do the right thing. Fortunately, that is unlikely.
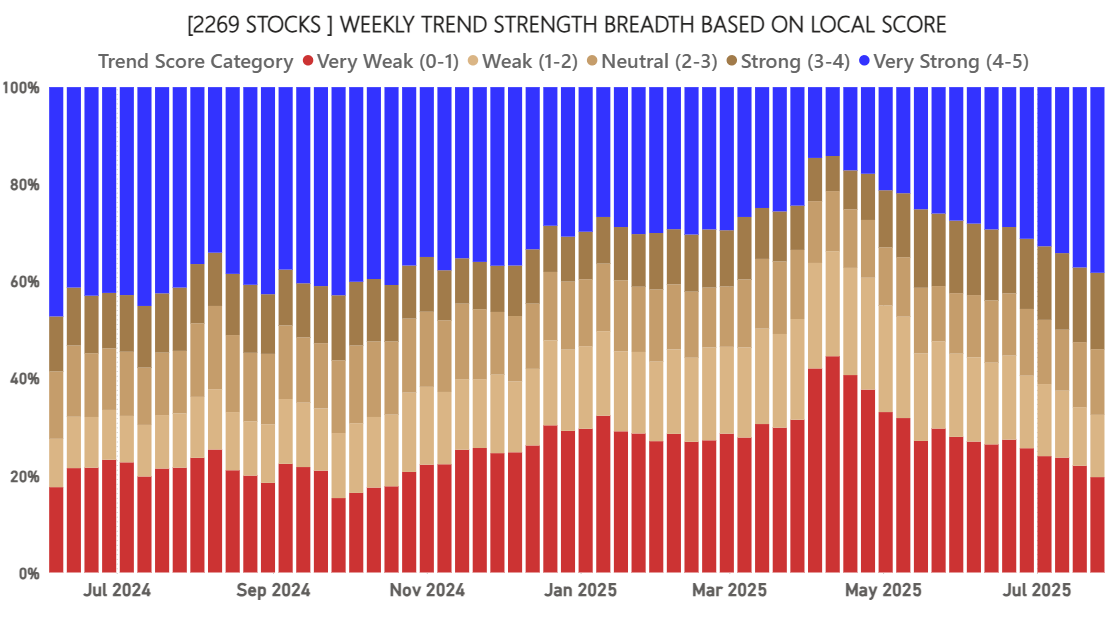
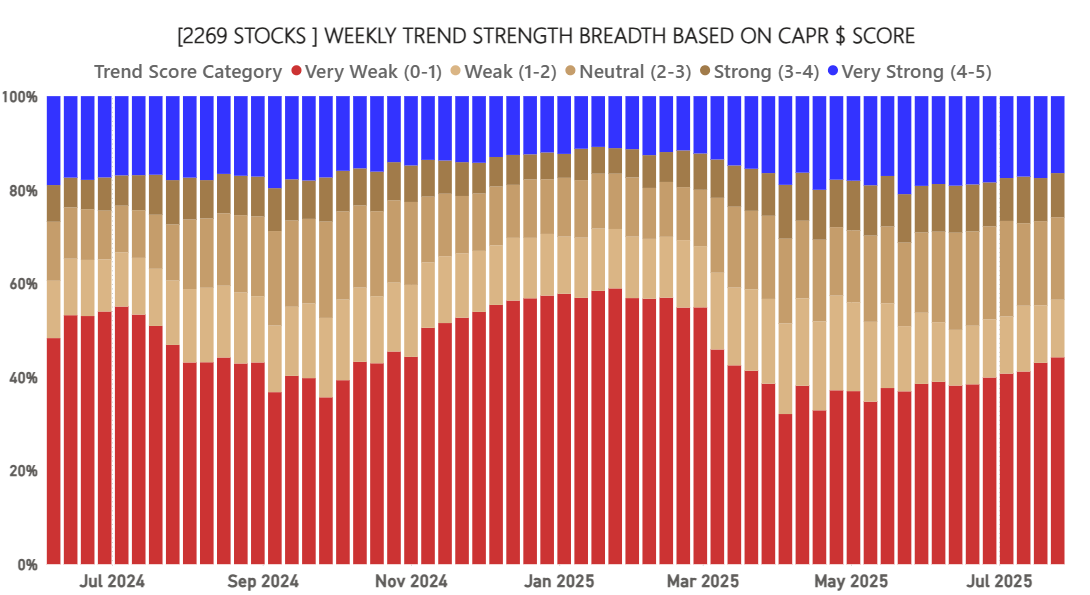
Market breadth remains supportive. The number of strong trends (blue) continues to grow, while the number of weak trends contracts.
ByteTrend: Weekly Breadth Signal – Local Currency
Yet beating the market is getting harder as the number of strong trends in CAPR is declining. With the market rising, and fewer stocks beating it, this implies the bias towards large caps is returning. GTI will be publishing new data on the size effect (mega, large, mid-caps) in the coming weeks.
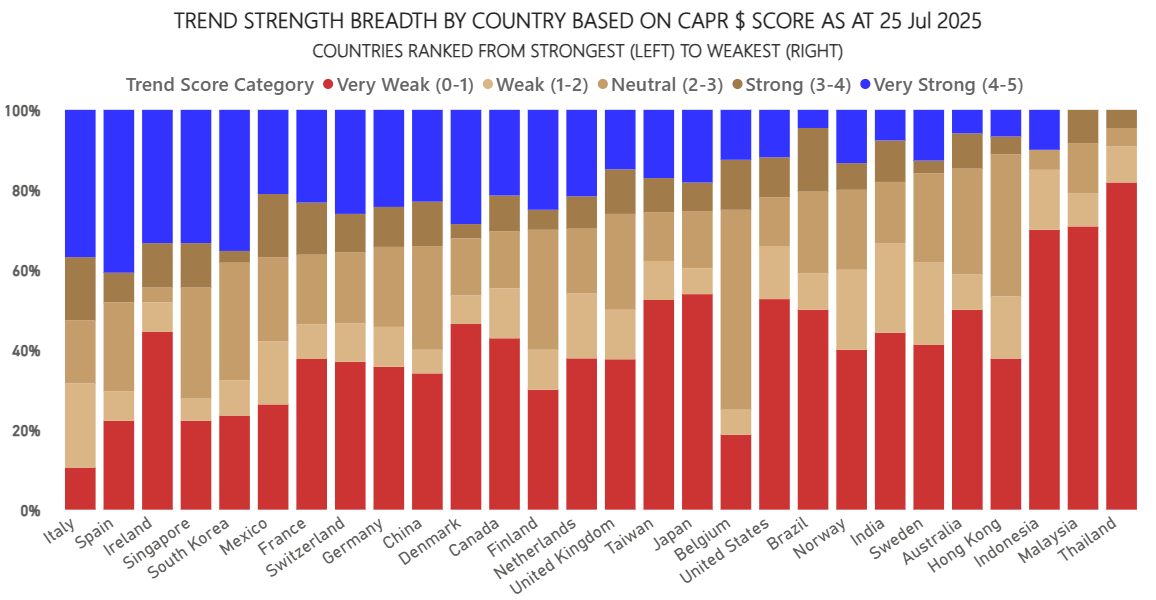
The strongest countries are Spain, Italy and Ireland, and the weakest are Indonesia, Malaysia and Thailand. With a hot war underway between Thailand and Cambodia, that might explain it. The USA was weaker in the spring but is now closer to the centre.
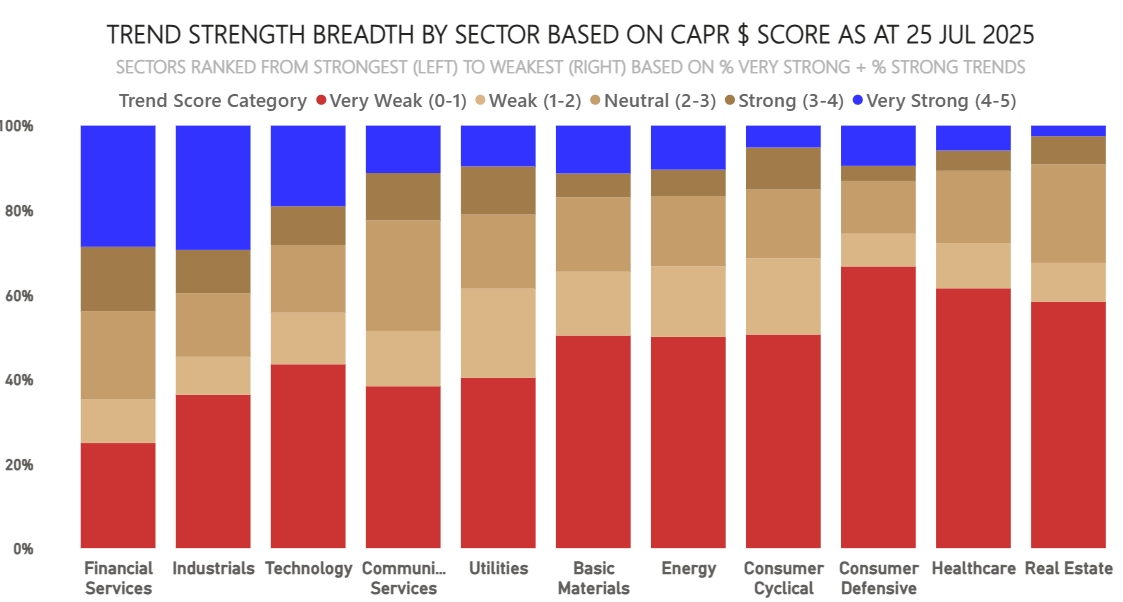
Financial services, industrials, and technology lead, while consumer defensives, healthcare and real estate lag.
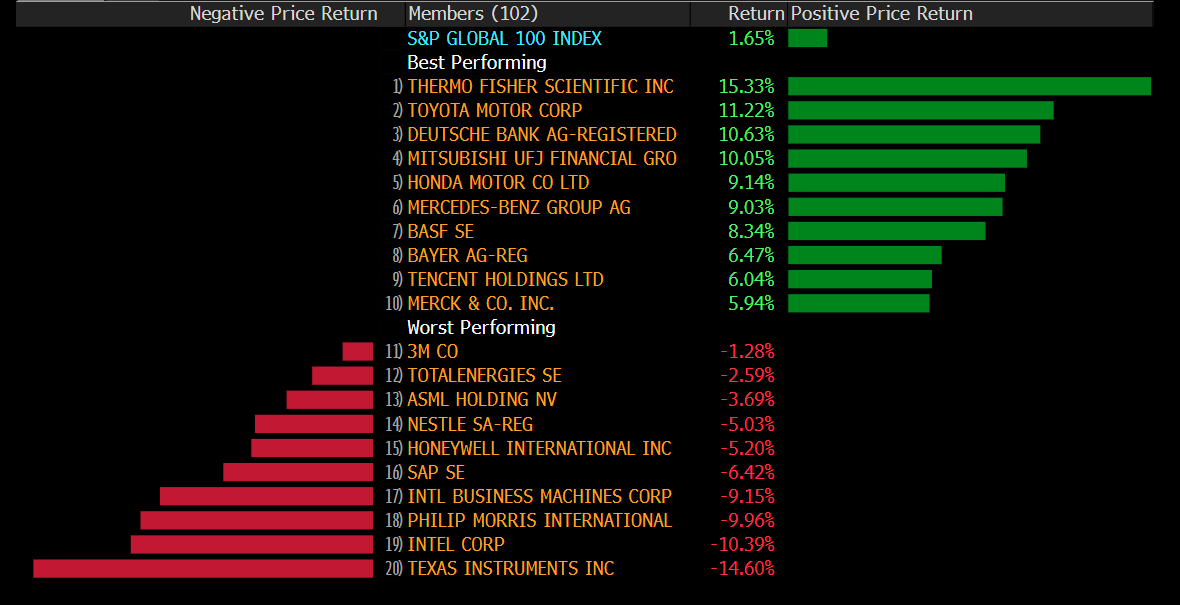
Leaders and Laggards
Thermo Scientific has been flagged on the bear list many times in recent weeks, as it has been ex-growth since 2022, yet last week it has its first counter rally on strong earnings. The car companies were also strong as tariffs were agreed with the USA, and the 50% tariff on steel imports into America hurts domestic car companies, meaning foreign automakers aren’t as bad off as feared.
Quality defensive stocks, which keep appearing on the GTI bear list, include Nestle, IBM, Philip Morris, SAP, and 3M which were all the weakest stocks of the week, from the global 100. They appeared alongside the chip stocks that can’t keep up with Nvidia and the other AI leaders.
Developed Markets Leaders and Laggards
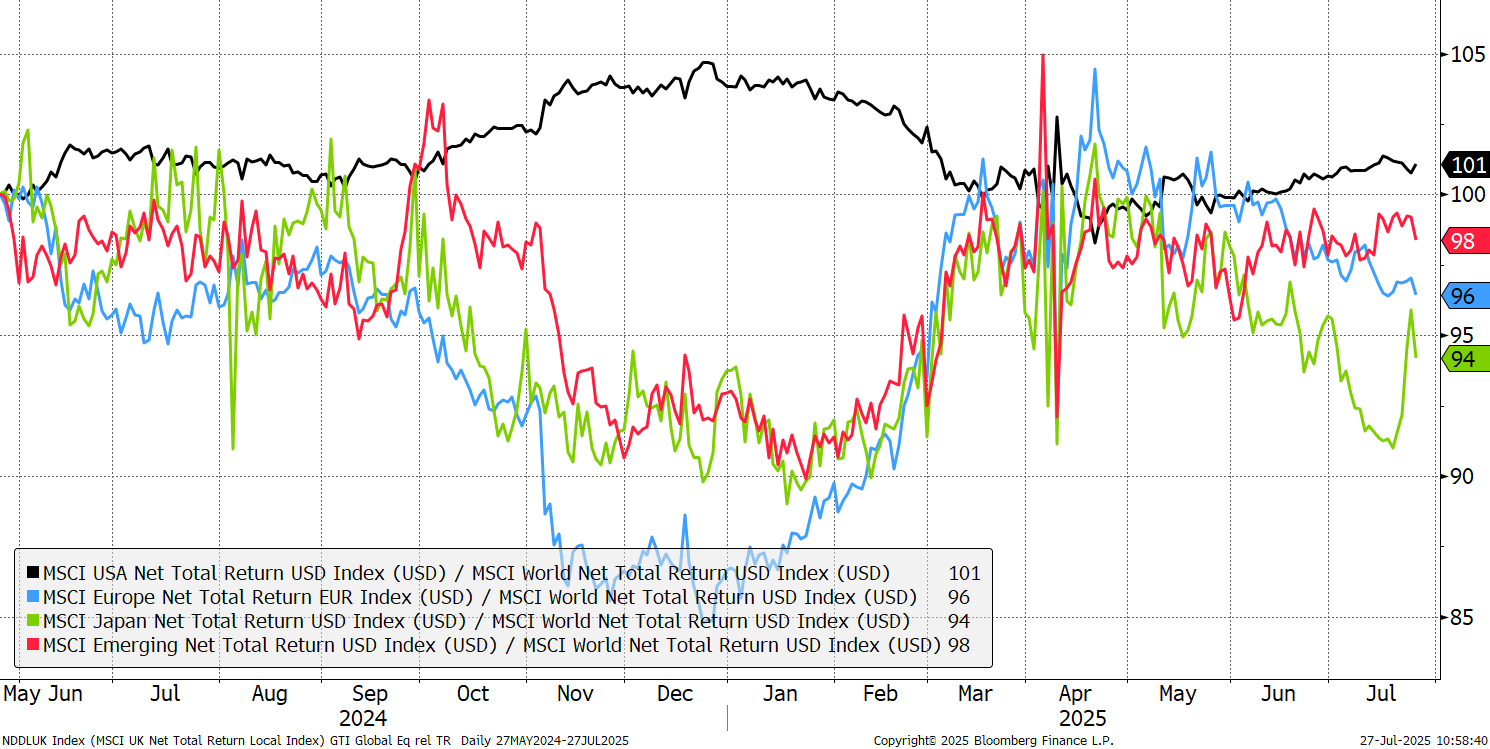
After the trade deal, Japan had a strong counter rally. Other than that, the US market is looking stronger again, while Europe is looking weaker.
CAPR: Europe, USA, Emerging Markets and Japan - Past Year
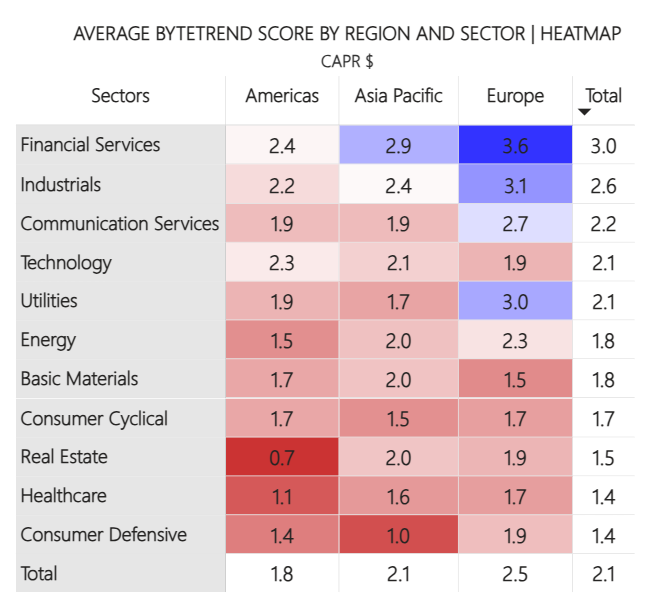
The world matrix sees US financials slightly weaker, and technology stronger. Real estate has recovered slightly, with the chart shown after the table. Healthcare is weaker again. In Europe healthcare strengthened, with financials still strong. Basic materials have improved globally, especially in Europe.
Average ByteTrend Score Heatmap - CAPR
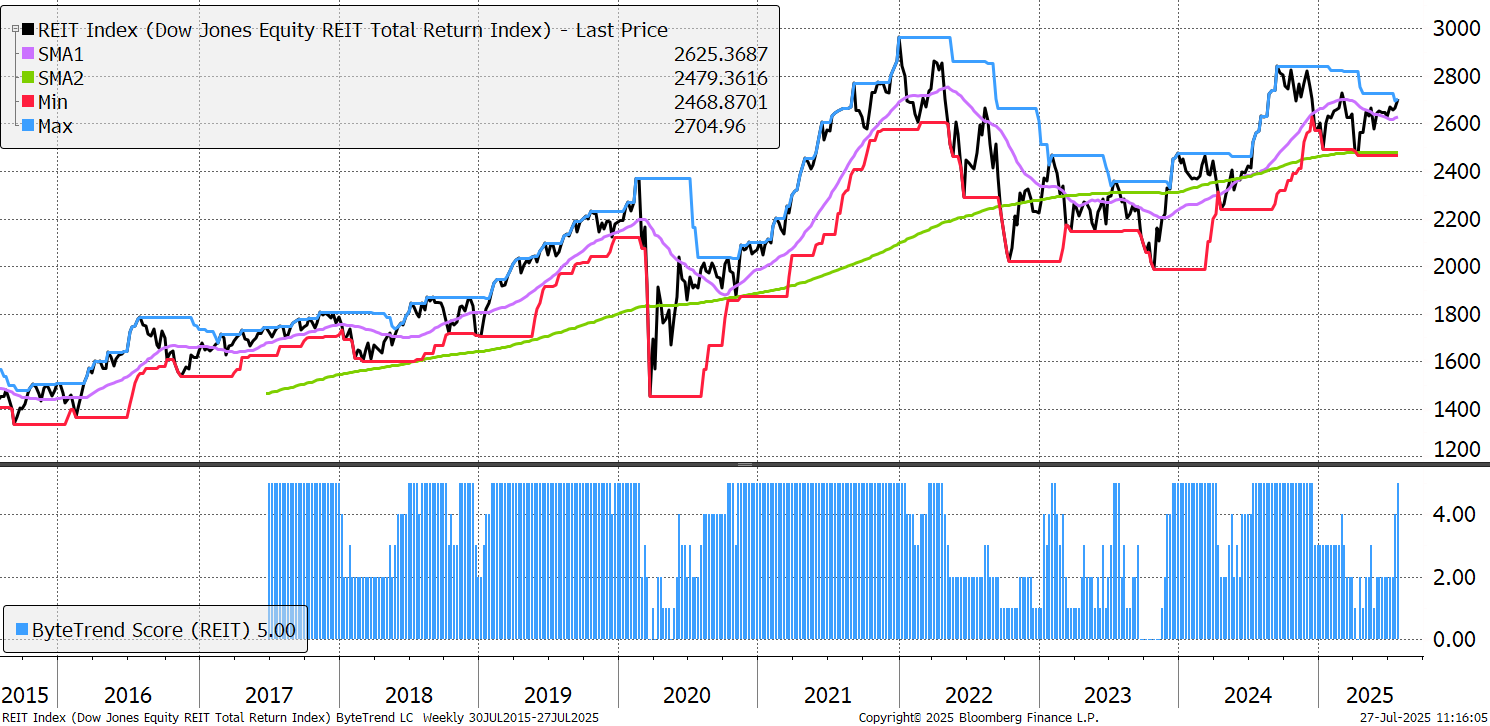
US REITs have been the weakest sector in terms of CAPR, but in USD terms, look interesting as the CAPR score goes to a 5 in USD terms. In EUR, this chart jumped from a 1 to a 2. Many technicians would say that this is a good chart, but in terms of CAPR, US REITs are global laggards.
US REITs in USD
Leading Trends with New Highs
These stocks are trading at the 30-week CAPR highs with a ByteTrend Score of 5. All charts shown are CAPR rebased to 100.
| AVGO | USD | Broadcom Inc. |
| PLTR | USD | Palantir Technologies Inc. |
| GE | USD | GE Aerospace |
| AMD | USD | Advanced Micro Devices, Inc. |
| RTX | USD | RTX Corporation |
| C | USD | Citigroup Inc. |
| GEV | USD | GE Vernova Inc. |
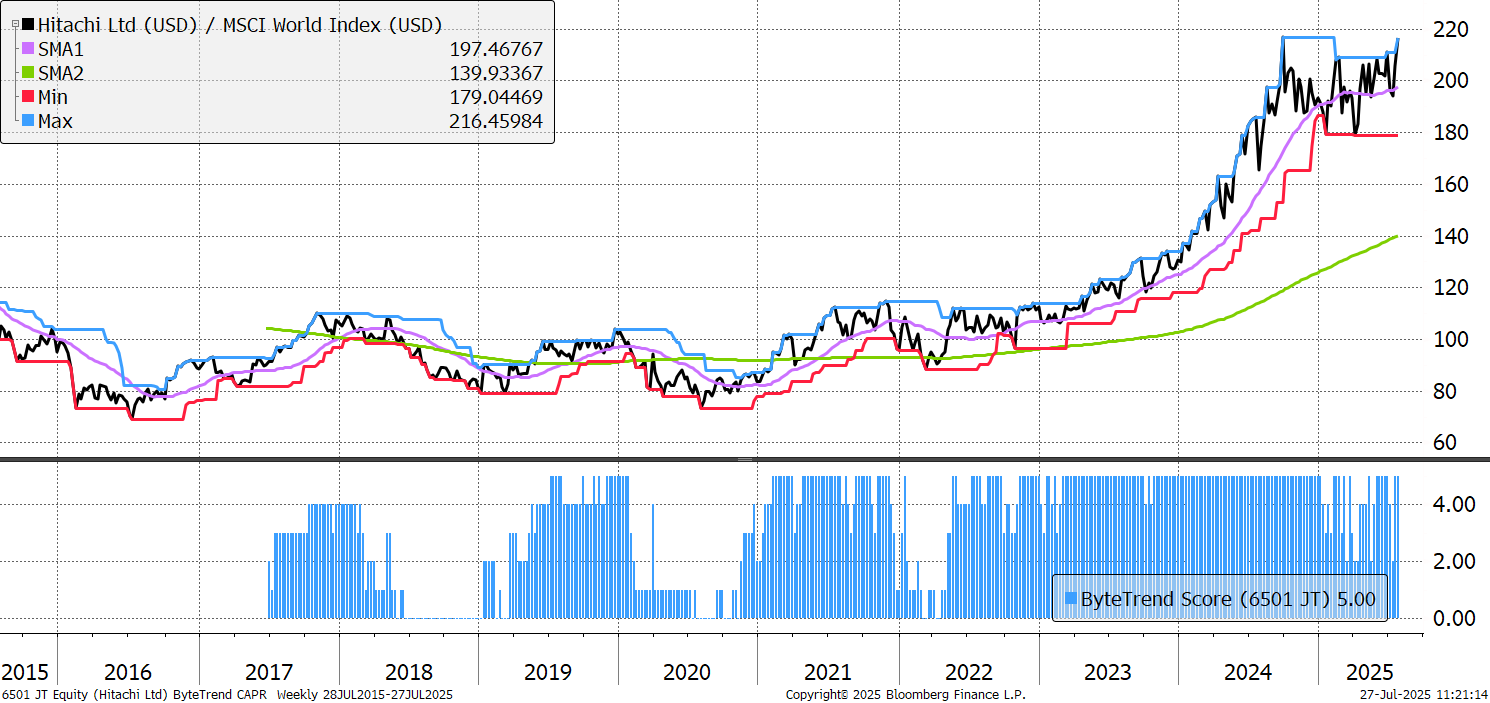
| 6501 | JPY | Hitachi, Ltd. |
| 2628 | HKD | China Life Insurance Company Limited |
| SAN | EUR | Banco Santander, S.A. |
| PRX | EUR | Prosus N.V. |
| APH | USD | Amphenol Corporation |
| ABBN | CHF | ABB Ltd |
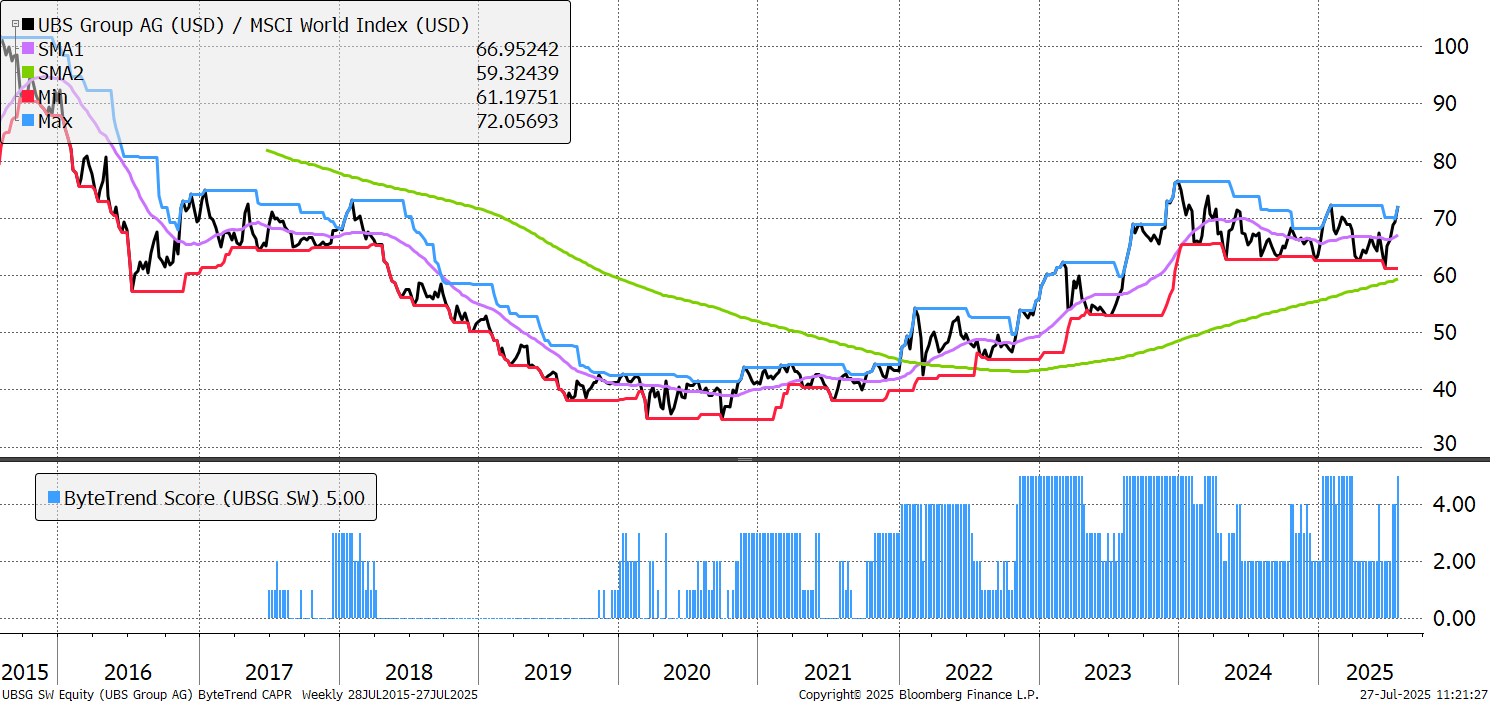
| UBSG | CHF | UBS Group AG |
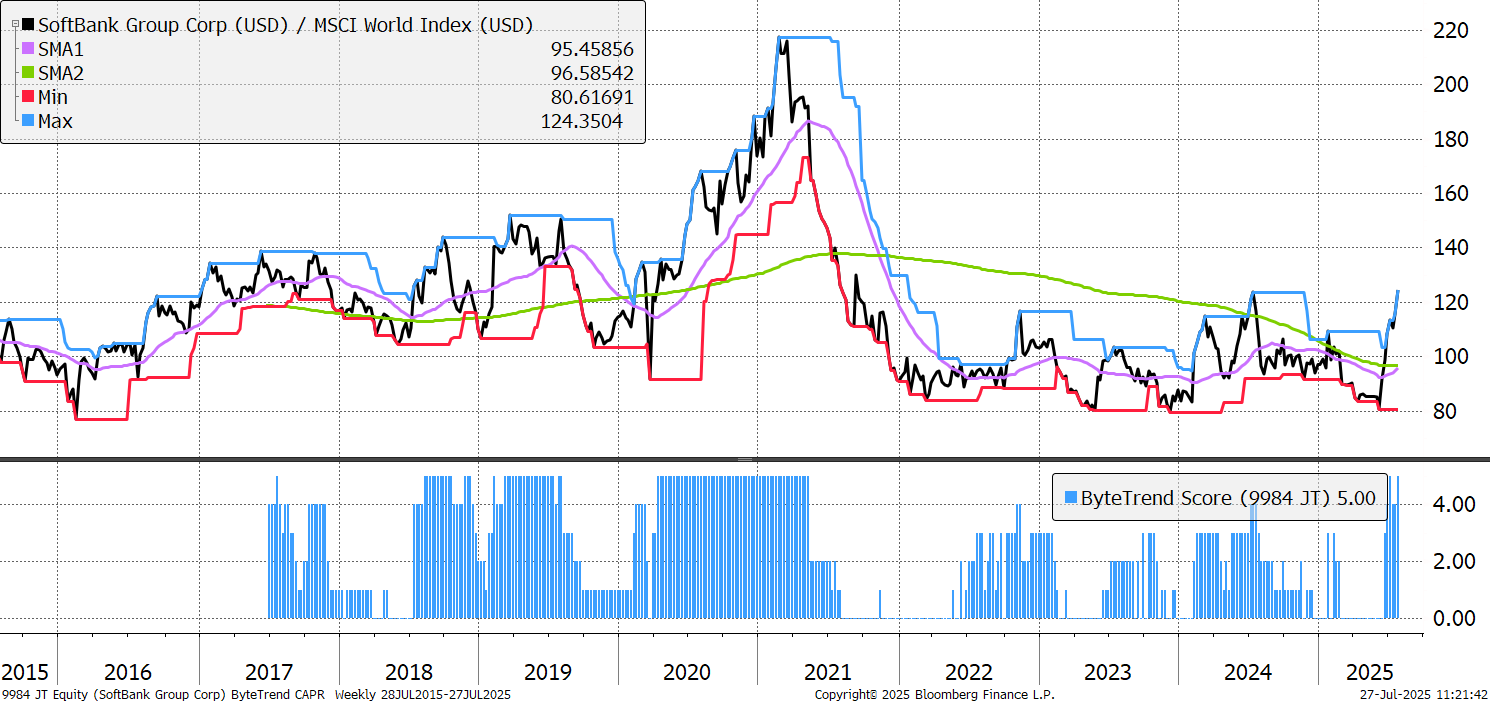
| 9984 | JPY | SoftBank Group Corp. |
| BATS | GBp | British American Tobacco p.l.c. |
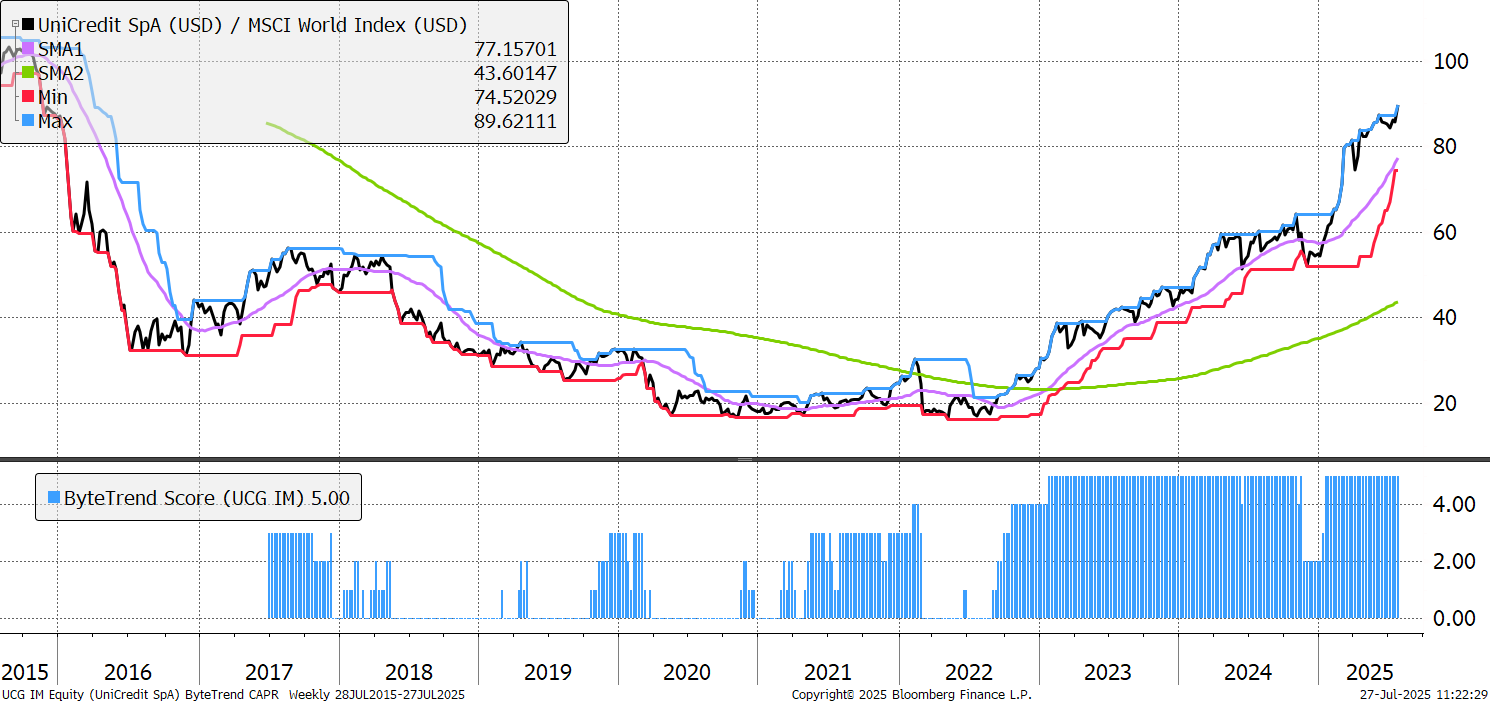
| UCG | EUR | UniCredit S.p.A. |
| SNPS | USD | Synopsys, Inc. |
| TT | USD | Trane Technologies plc |
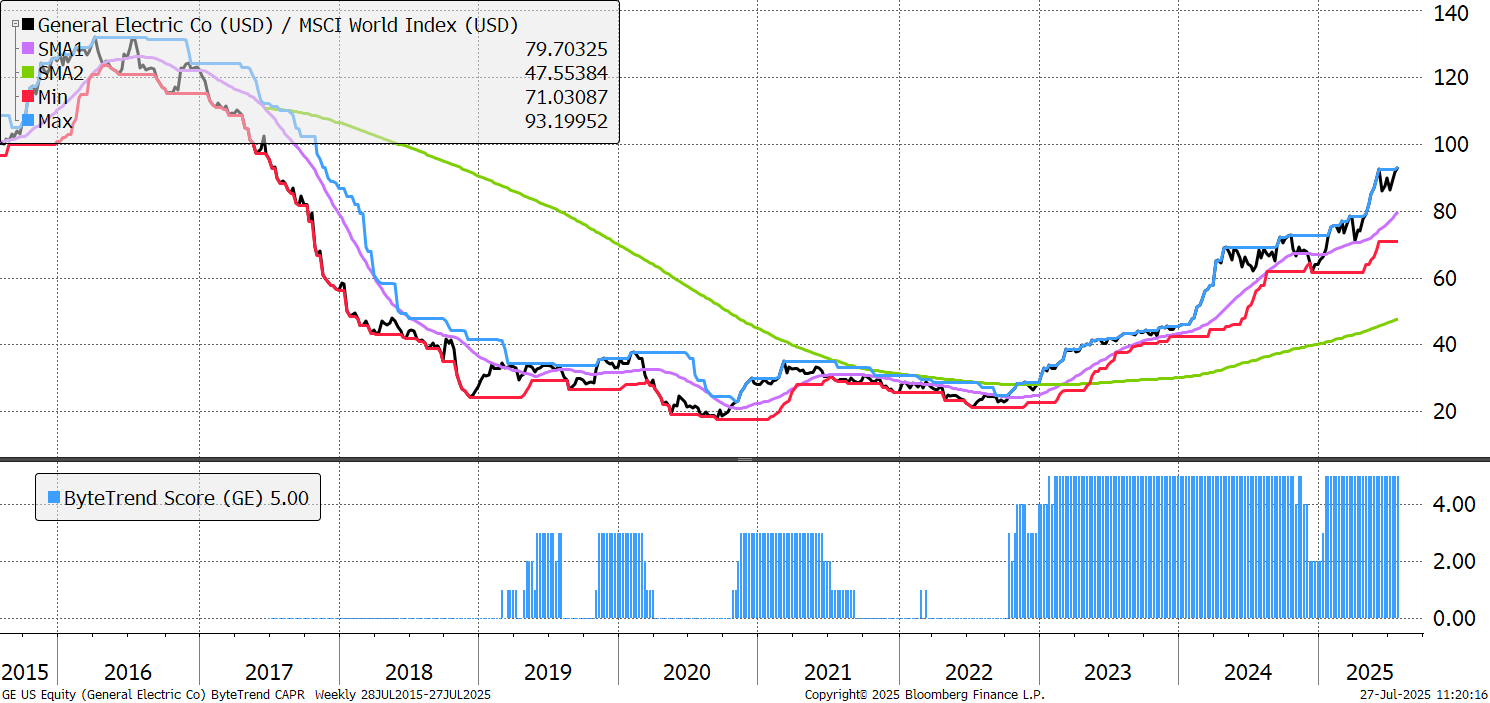
Both General Electrics are Leading trends this week, but here we focus on the Aerospace division. Vernova is its energy business, which was spun out recently, and is benefitting from gas turbine sales amid the data centre boom. As for GE Aerospace, the remaining core business which makes jet engines, it has thrived during the defence bull market since 2022, as sales, returns on capital, and valuation multiples have all soared. It was boosted recently by a big order from Qatar Airways and a pledge for a 20% rise in shareholder returns. Although its engines powered the Boeing plane which sadly crashed in India in June, investigations have shown no fault by either.
General Electric
Hitachi is a diversified Japanese conglomerate specialising in digital systems, power and renewable energy, railway systems, healthcare products, and financial services, operating globally. It is focused on energy and digitalisation, two huge megatrends. It’s working with Nvidia on Ai solutions for things like power grids and transport systems and is pioneering the commercialisation of 800kV extra-high-voltage switchgear as demand rises in the US for data centres and AI-driven power transmission. Being international, it benefits from the weak yen that has persisted for so long.
Hitachi
We highlighted Citigroup last week, this week it’s UBS, a new entrant to the Leading Trend category. It was growing book value per share before the Credit Suisse acquisition, and despite the immense task of integrating it, has managed to grow it again since completion. It reports on Wednesday this week, July 30.
UBS
We flagged SoftBank last week as an Emerging trend (new high with a ByteTrend score of 4) and this week it is a leader (new high with a 5). It’s 200-week moving average is now sloping upwards, which was the final piece of the puzzle. As we flagged last week, high vol stocks are leading this market rally, and SoftBank’s is 49, high for such a large company. Look at its record in 2000 and you’ll see why investors aren’t so trusting.
Softbank
Global financials continue to excel, and UniCredit is a prime example. It reported a record-breaking second quarter in 2025, with net profit reaching €3.3 billion, a 25% increase year-over-year, and a strong net profit margin of 49%, up from 43%. This allowed the company to claim it was “turning a transitional year into our best year ever”. They raised guidance and promised large shareholder returns. Higher interest rates have allowed financials of all shapes and sizes to return to profitability after a long winter in zero-rate territory, and the good ones are making hay while the sun shines.
UniCredit
There are 82 additional leading trends with new CAPR highs in the GTI universe. It is dominated by banks and increasingly, capital markets, while consumer stocks remain poorly represented. Industrials are the other strong group, with a global representation. Antofagasta shows up in Copper, with Zijin in gold. Energy is practically absent.
Emerging Trends
These stocks are trading at the 30-week CAPR highs with a ByteTrend Score of less than 5. They don’t have to be in an uptrend, just emerging. All charts shown are CAPR rebased to 100.
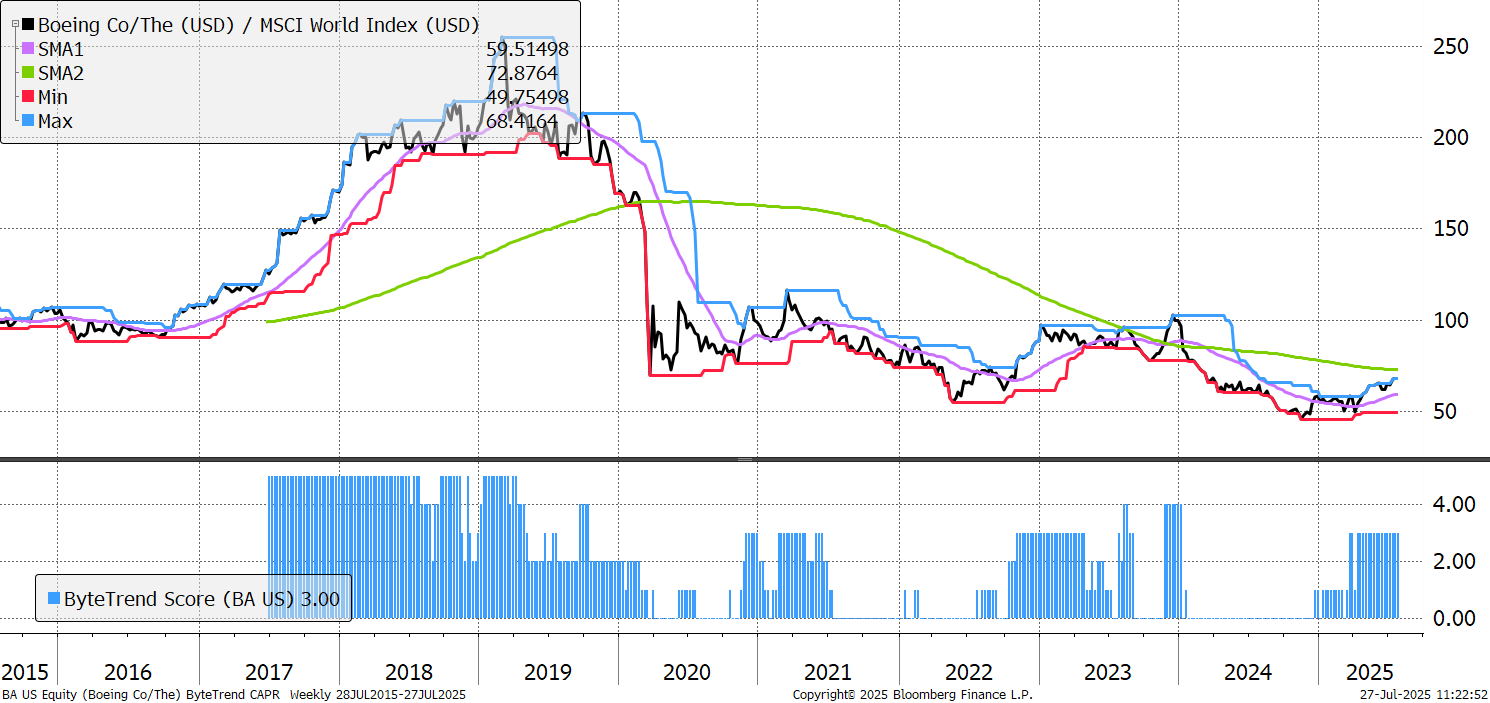
| BA | USD | The Boeing Company |
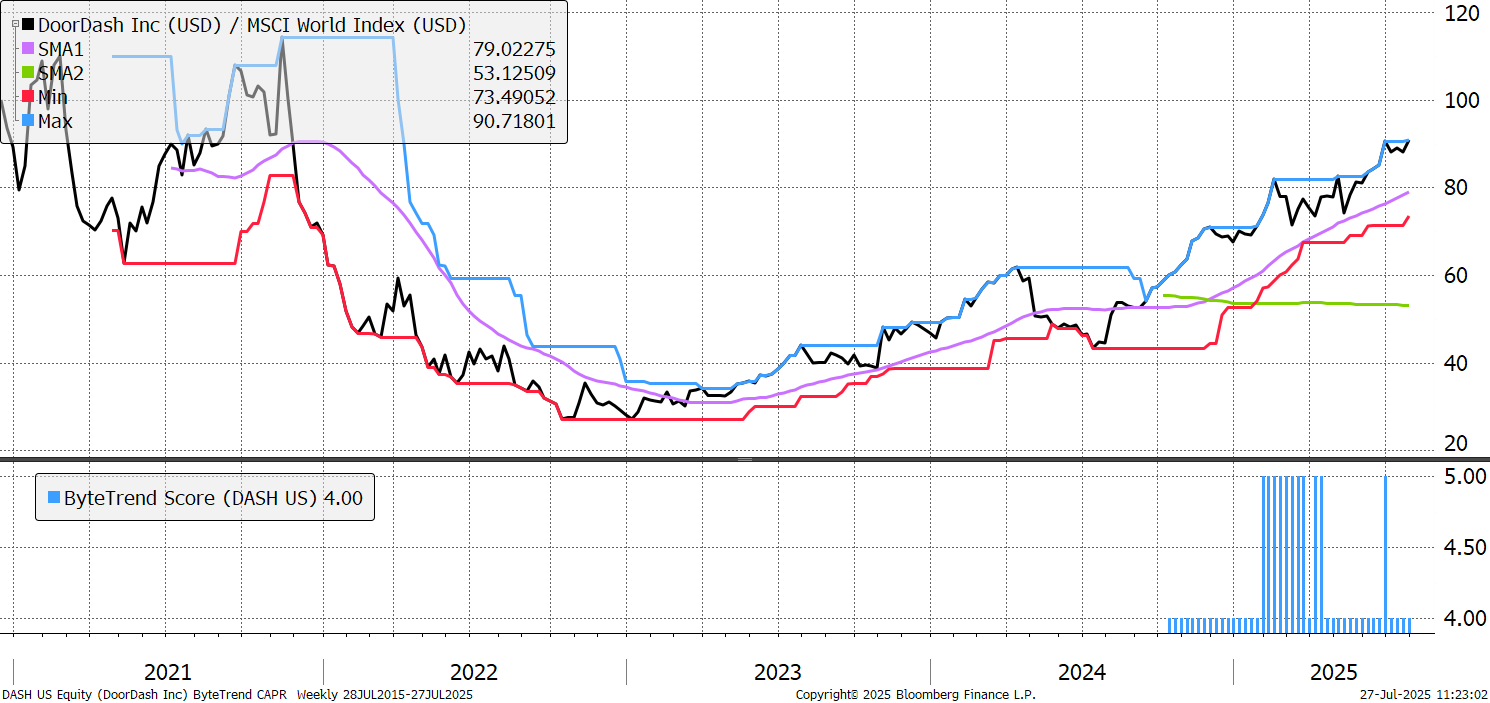
| DASH | USD | DoorDash, Inc. |
It’s a short list this week with the GTI 200 cut off, reflecting stable trends.
Boeing is still emerging, with a ByteTrend score of 3. It’s the largest emerging trend by market capitalisation, despite having fallen so far. The internal turnaround is underway, but the question investors face is how deep rooted its process issues are. Safety has become a concern, and buyers of planes have slow standards and are slow to trust. Accidents are a killer for airlines, so trust in the manufacturer is paramount, and it has been broken. Winning it back will take Boeing a long time, but if it can, this could be the start of a long revival.
Boeing
A post-pandemic bubble IPO, DoorDash managed to raise money at a very suitable time, giving away fewer shares for its capital raise, but the share price suffered for a couple of years as a result. Revenue growth at IPO was triple digit, today its around 20-30%, but returns on capital are flirting with positive territory for the first time and a key concern for all of these high-cash-burn, high-growth, rich-valuation stocks was whether sustainable profitability would ever come. 360-day volatility has fallen from 85 to below 40, but DoorDash has grown its share capital by 33% during its brief history as a public company. A lot going on here.
DoorDash