Don't Bet Against Hong Kong


Issue 19;
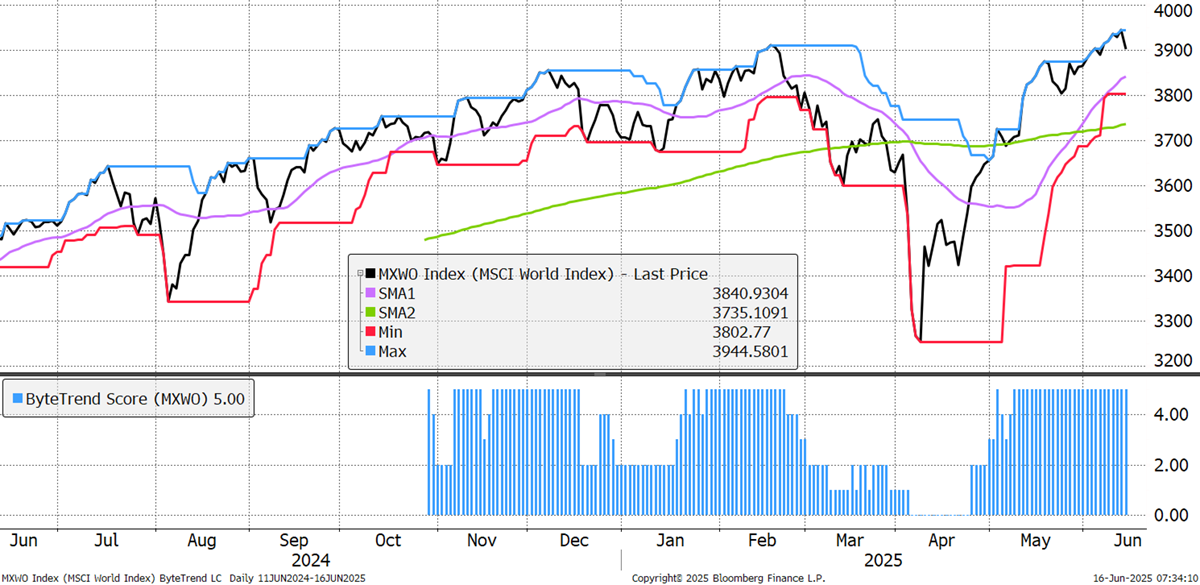
The World Index closed the week in slightly negative territory following the strikes on Iran. Despite that, the World Index trend remains healthy with a ByteTrend Score of 5.
World Index – Developed Markets - Daily
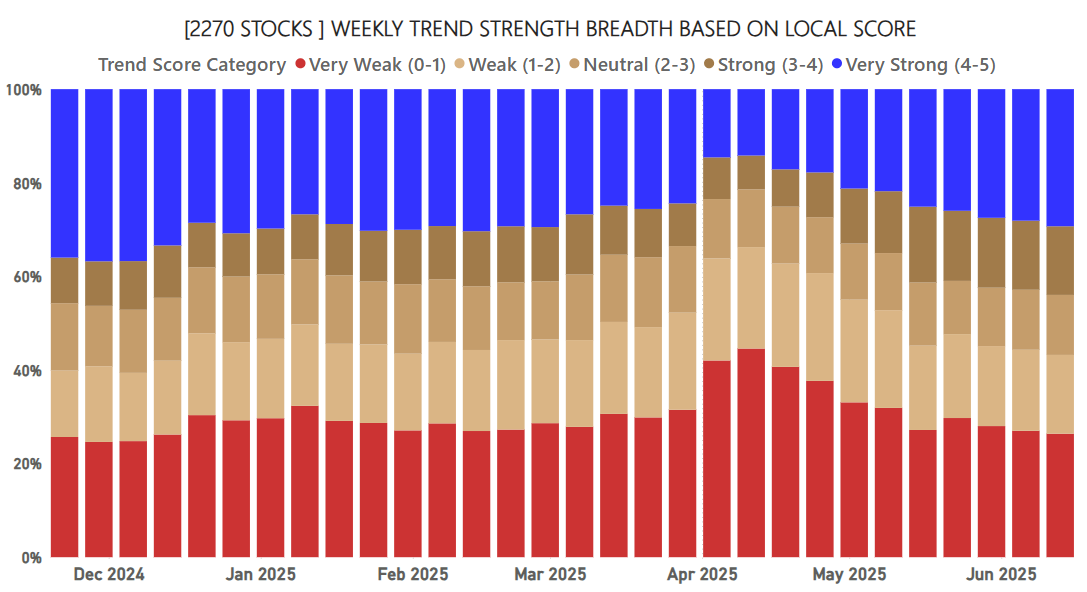
This is the 10th consecutive week with improved market breadth. That is, the number of bullish trends is growing faster than the number of weak trends. This is supportive for the stockmarket.
ByteTrend: Weekly Breadth Signal
Leaders and Laggards
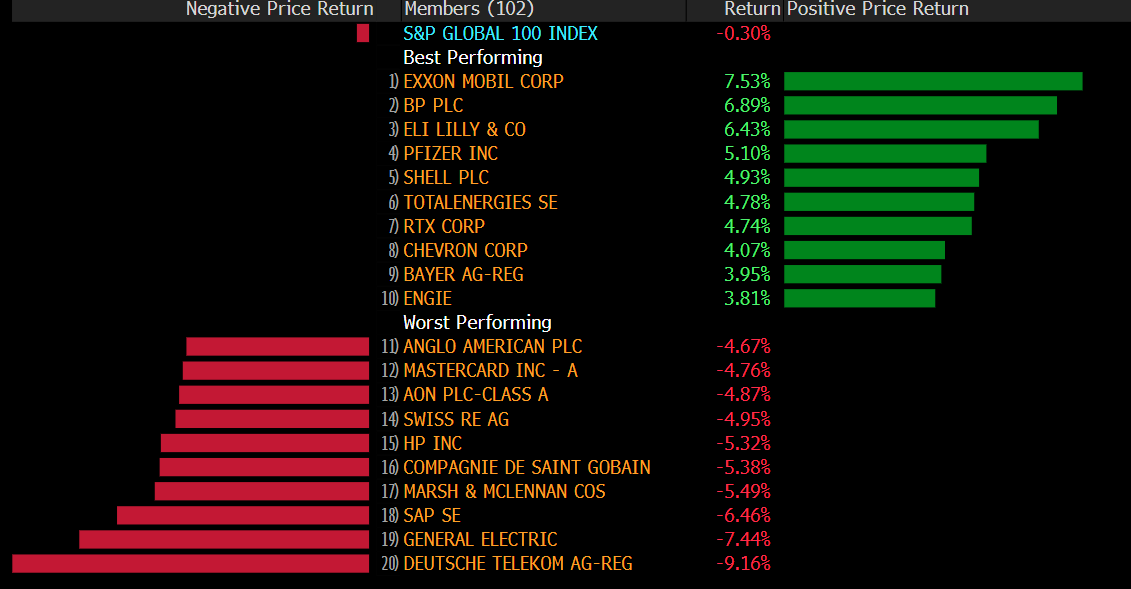
With war in the Middle East, the oil price has risen, with 6 of last week’s top 10 winners coming from the energy sector. Insurance featured heavily among the worst performers. Property insurance has slowed down, along with potential claims in LA following the riots.
Developed Markets Leaders and Laggards
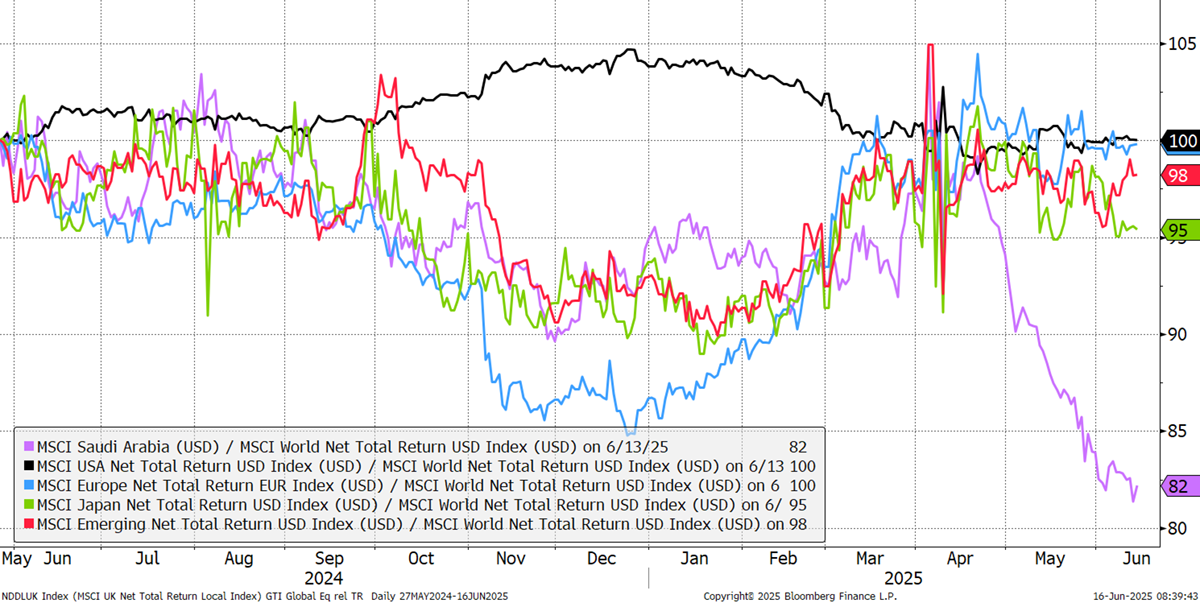
The regional CAPR chart sees the US flat, alongside Europe. EM has been strong recently, while Japan has lagged. This week’s special guest is Saudi Arabia, which has been hit by low oil prices, until recent events, and regional instability. This shows up in the bear section below.
CAPR: Europe, USA, Emerging Markets, Japan, and Saudi Arabia - Past Year
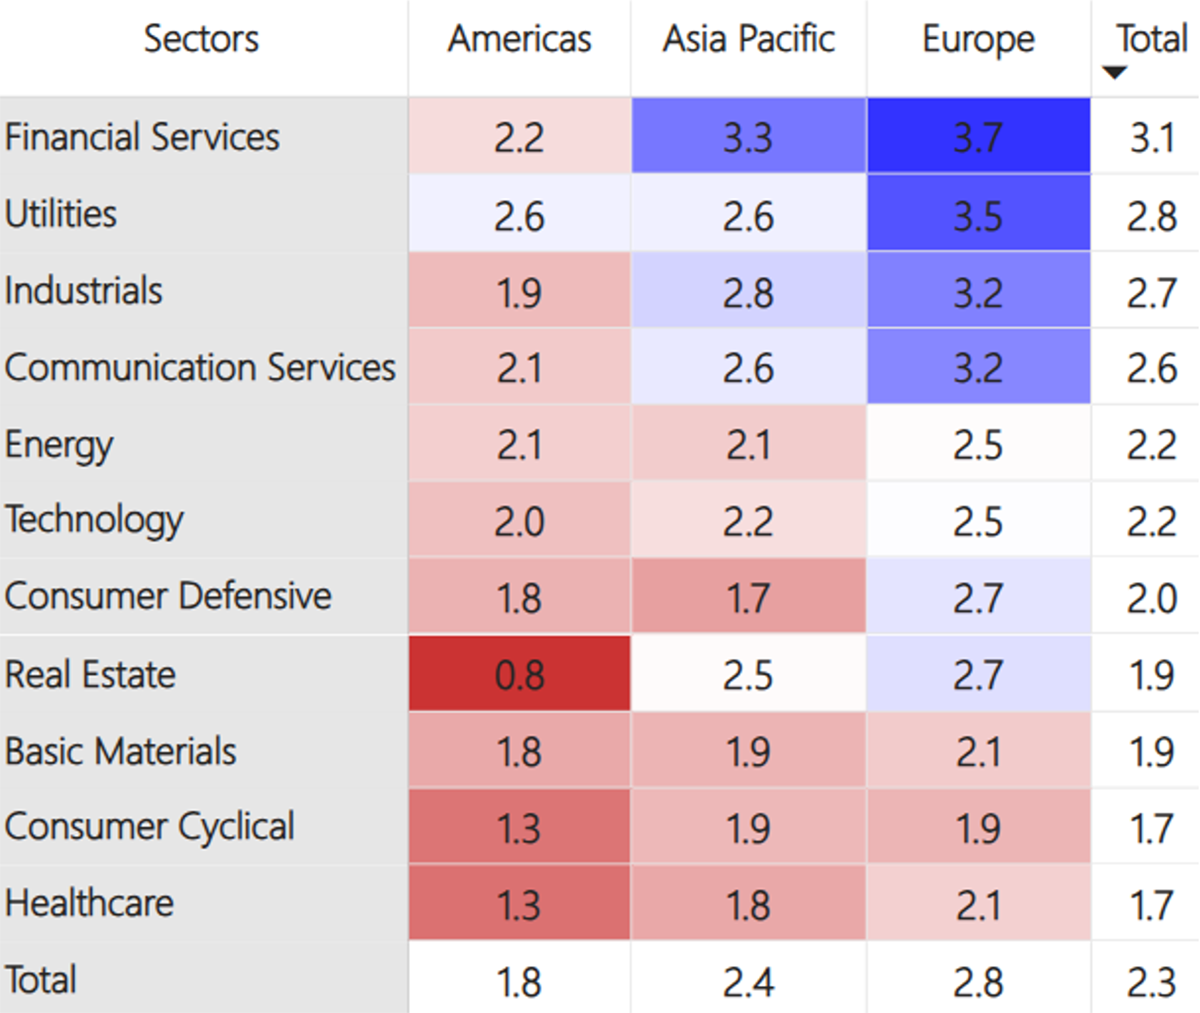
At the stock level, the world matrix sees the most strength in Europe. Asia sees an improvement in its financial sector. Consumer stocks are sluggish, with materials and healthcare weak globally. US REITs are the weakest single area.
Average ByteTrend Score by Region and Sector Heatmap - CAPR
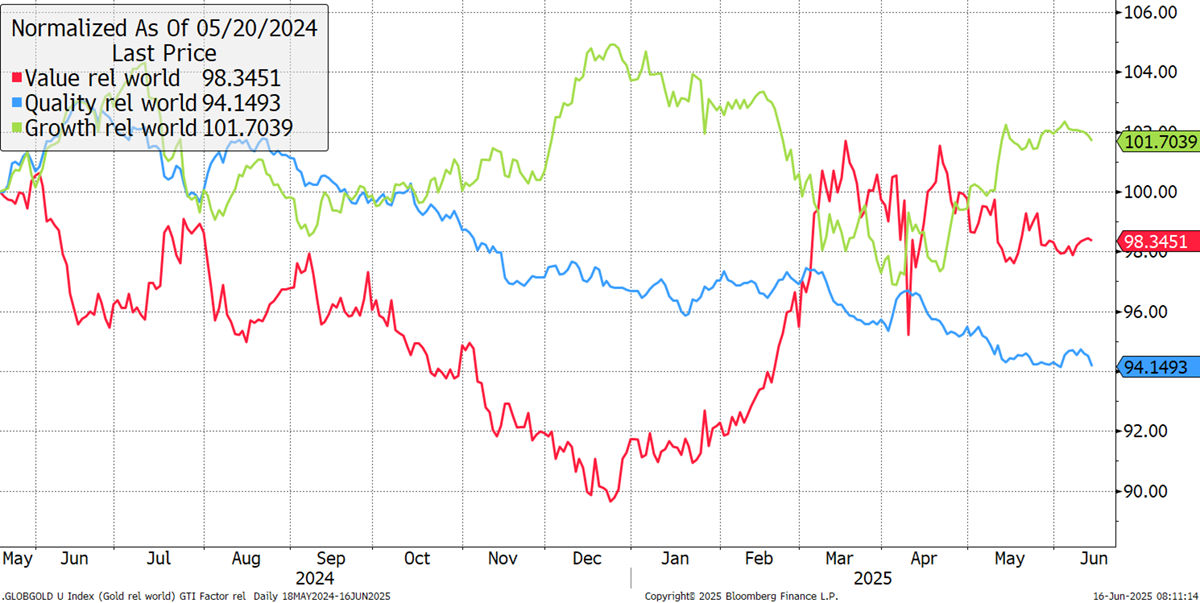
Growth has enjoyed a rebound since the April stockmarket rout. Value is stable, with Quality stocks lagging. Rising bond yields normally drive this, but this time, Quality has to face up to high valuations, which are proving unsustainable.
Global Factors
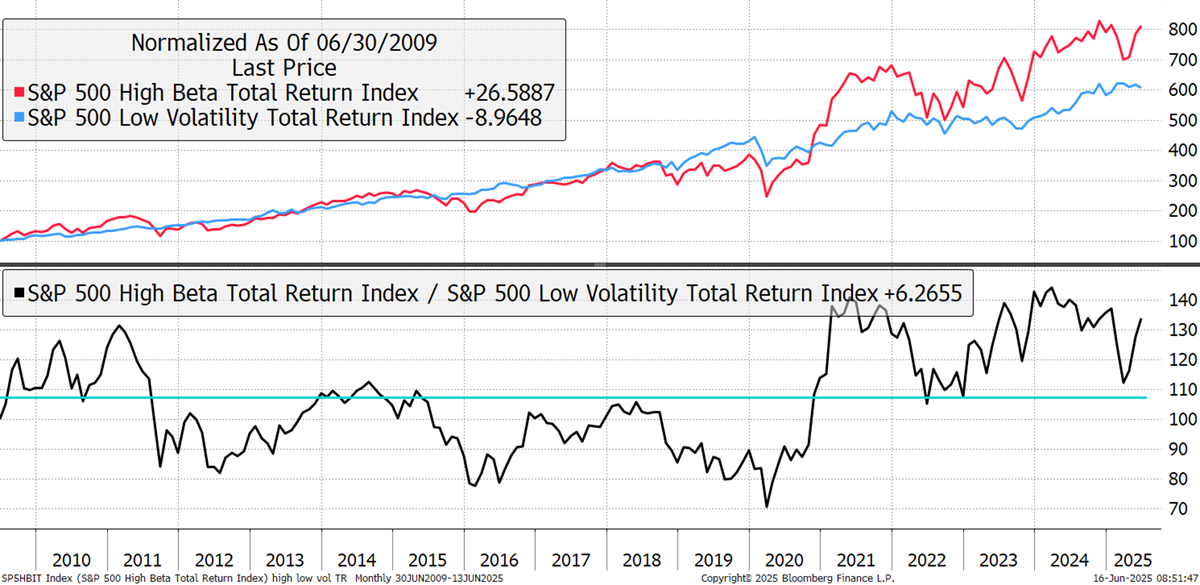
Quality and volatility were discussed in our recent webinar. The chart shows the performance of low-volatility stocks against high beta stocks since 1991, including dividends. Low volatility is a proxy for Quality stocks, which are generally non-cyclical. High beta stocks are more volatile and highly cyclical. Like the race between the hare and the tortoise, the tortoise always wins. High beta stocks are riskier and, over the long term, have not rewarded investors with higher returns.
Low Volatility vs High Beta – Since 1991
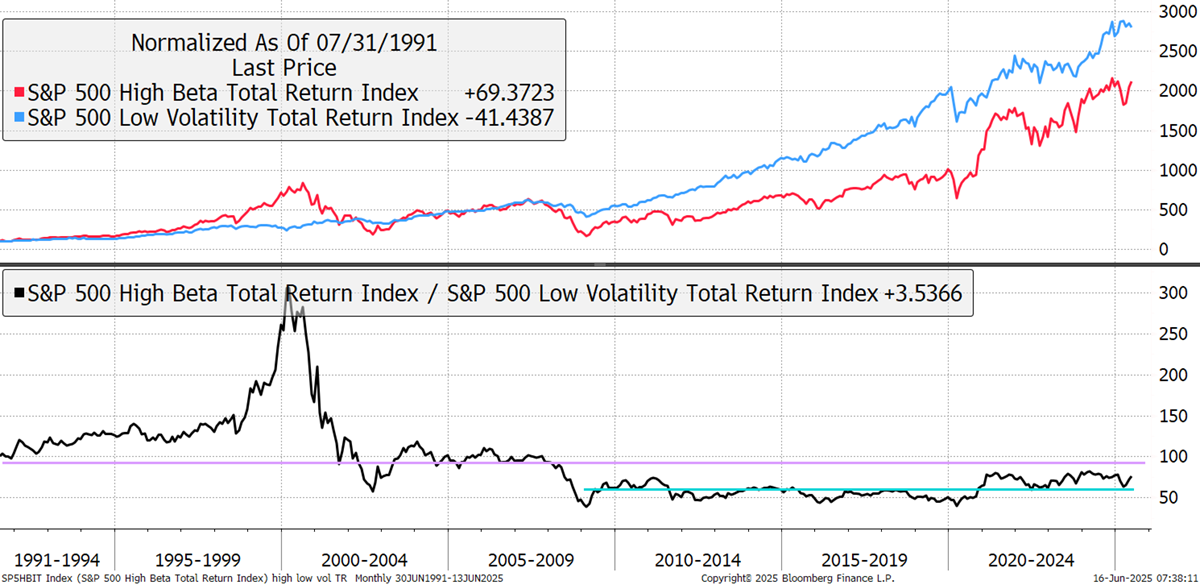
The lower section of the chart shows the relationship between low volatility and high beta. The purple line is the long-term average, and the green line is the average since 2009, after the financial crisis. That is shown below. Since the pandemic struck in 2020, high beta has tended to perform well following the vast stimulus programme at the time. It corrected in 2022 and in April this year, but has recovered from both setbacks. While these risky stocks have performed well, low-volatility stocks are now rolling over. The chart also shows that market speculation remains above average, as volatile stocks are strong.
Low Volatility vs High Beta – since 2009
This week sees strength in AI, Asian financials, and defence. Consumer defensives, highly rated stocks, insurance and Saudi Arabia are weak.
Leading Trends with New Highs
These stocks are trading at the 30-week CAPR highs with a ByteTrend Score of 5. All charts shown are CAPR rebased to 100.
| Ticker | FX | Name | Score CAPR | % Dev from CAPR 30W High | % Dev from CAPR 30W Low | Annual. Vol 30w | MCap Bn USD | Sector | Industry |
|---|---|---|---|---|---|---|---|---|---|
| MSFT | USD | Microsoft Corporation | 5 | 0 | 17 | 27 | 3530 | Tech | Software Infra |
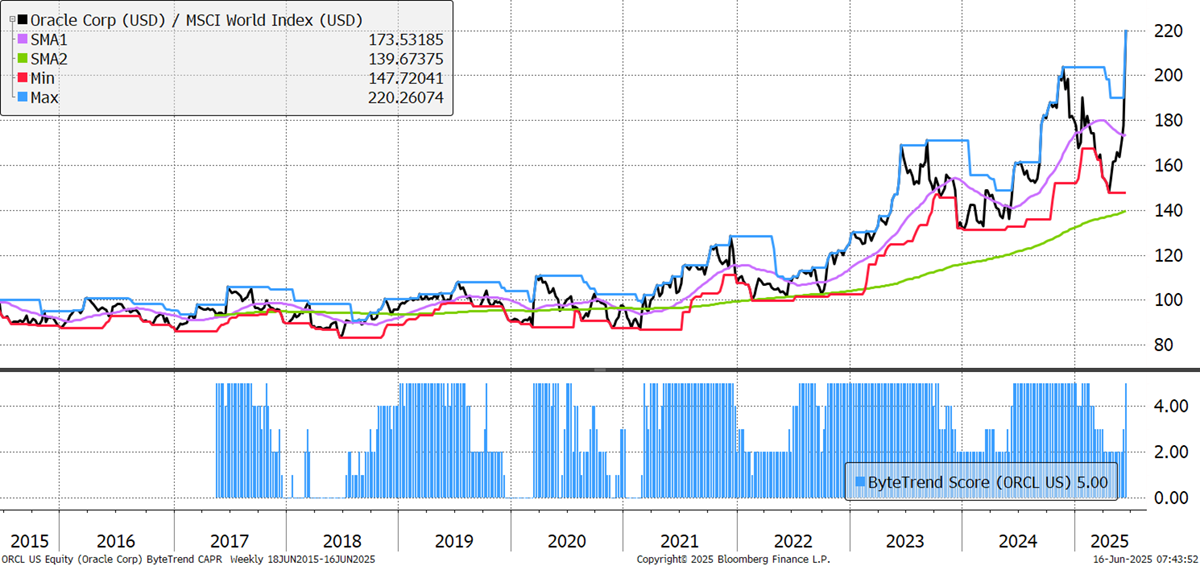
| ORCL | USD | Oracle Corporation | 5 | 0 | 49 | 52 | 604 | Tech | Software Infra |
| PLTR | USD | Palantir Technologies Inc. | 5 | 0 | 106 | 80 | 311 | Tech | Software Infra |
| PM | USD | Philip Morris International Inc. | 5 | 0 | 48 | 23 | 287 | Con Disc | Tobacco |
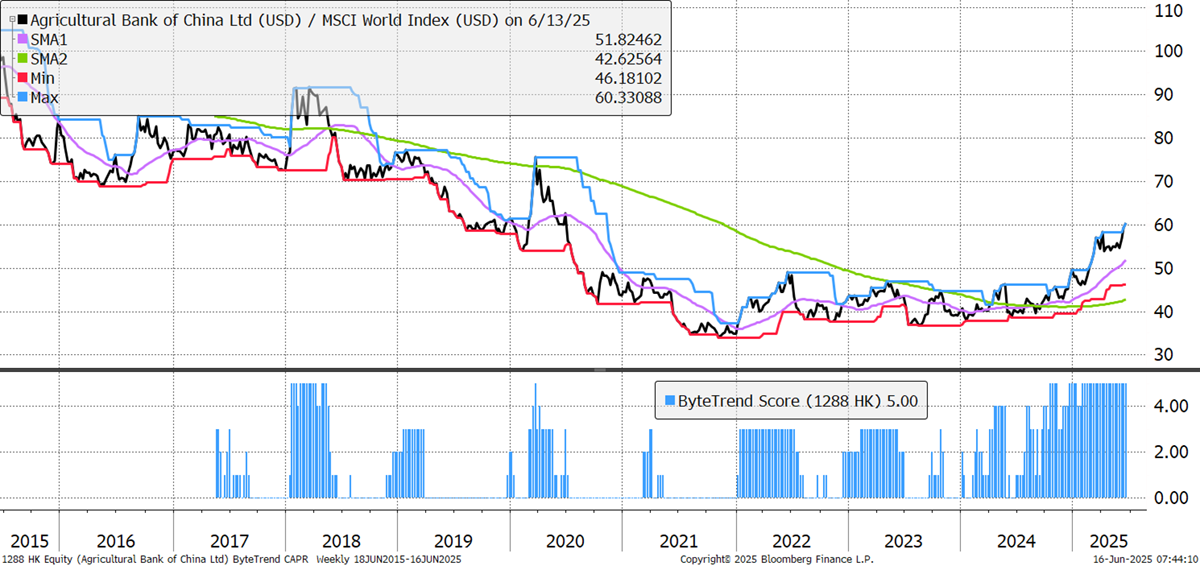
| 1288 | HKD | Agricultural Bank of China Limited | 5 | 0 | 38 | 21 | 271 | Finance | Banks |
| IBM | USD | International Business Machines Corporation | 5 | 0 | 22 | 31 | 258 | Tech | IT |
| RTX | USD | RTX Corporation | 5 | 0 | 22 | 28 | 195 | Indust | Aerospace |
| SPOT | USD | Spotify Technology S.A. | 5 | 0 | 50 | 41 | 143 | Comms | Internet |
| MU | USD | Micron Technology, Inc. | 5 | 0 | 52 | 64 | 129 | Tech | Semis |
| CRWD | USD | CrowdStrike Holdings, Inc. | 5 | 0 | 38 | 50 | 120 | Tech | Software Infra |
| 660 | KRW | SK hynix Inc. | 5 | 0 | 46 | 41 | 119 | Tech | Semis |
| PRX | EUR | Prosus N.V. | 5 | 0 | 47 | 39 | 118 | Comms | Internet |
| KLAC | USD | KLA Corporation | 5 | 0 | 32 | 44 | 115 | Tech | Semis |
| LRCX | USD | Lam Research Corporation | 5 | 0 | 29 | 47 | 115 | Tech | Semis |
| BATS | GBp | British American Tobacco p.l.c. | 5 | 0 | 31 | 22 | 107 | Con Disc | Tobacco |
| 9999 | HKD | NetEase, Inc. | 5 | 0 | 49 | 34 | 84 | Tech | Gaming |
| 7011 | JPY | Mitsubishi Heavy Industries, Ltd. | 5 | 0 | 80 | 52 | 82 | Indust | Ind Mach |
| BA | GBp | BAE Systems plc | 5 | 0 | 76 | 33 | 77 | Indust | Aerospace |
Oracle’s founder, Larry Ellison, owns 41% of the company he founded, making him worth over $233 billion, as he overtakes Jeff Bezos. Oracle has navigated change over the years and remains well placed in cloud infrastructure. Unfortunately, the valuation has doubled from 5x sales (2002 to 2024 average) to 10x. A bubble in the making, perhaps.
Oracle
The China slowdown and property crash haven’t stopped the Agricultural Bank of China from making money. Growth is slow, but profits are rising, while non-performing loans have shrunk. The bank is valued at just 0.7x book, and stability is seen to be good news.
Agricultural Bank of China