
Exploding Bear Trends


Issue 33;
- The size effect at extremes.
- Defensives lie in wait.
The World Index powers ahead again, maintaining its ByteTrend Score of 5. It’s bullish, and still not heavily extended in the big scheme of things.
World Index – Developed Markets – Daily
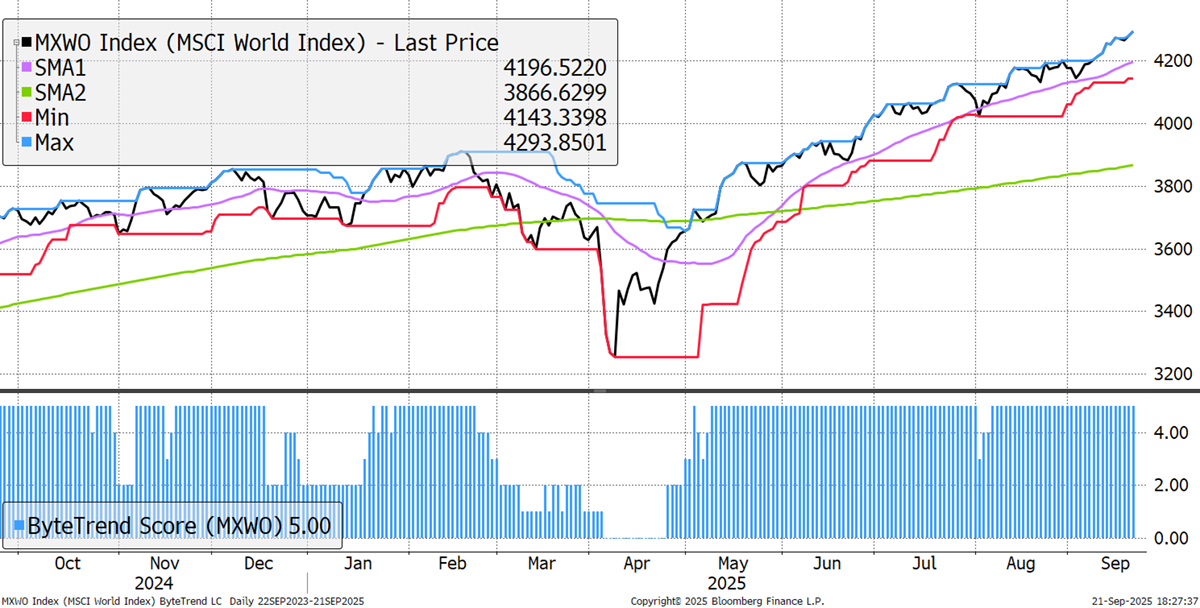
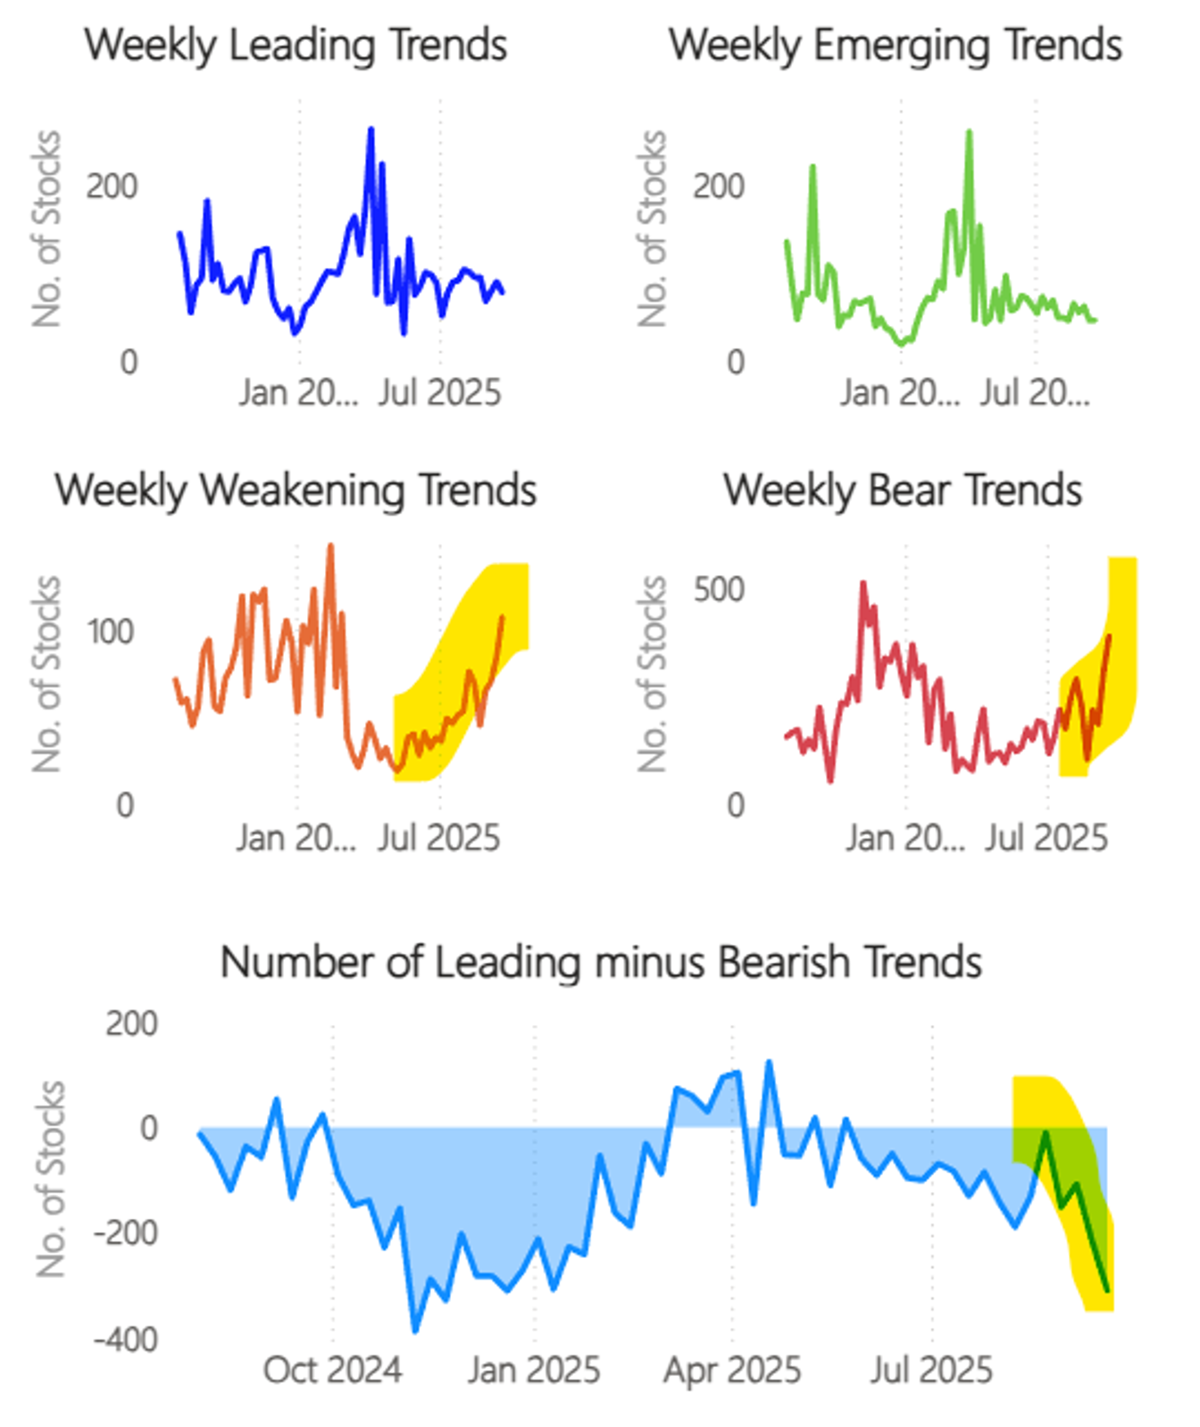
But under the surface, we can see some cracks are appearing as the number of bullish leading and emerging trends is holding steady, while the number of more concerning weakening and bearish trends spikes. Net-net, there are more bearish trends, i.e., stocks underperforming the World Index rather than beating it. Another fine addition to the spreadsheet, courtesy of Rashpal Sohan.
ByteTrend: Global Trend Classification
If the market is strong but more stocks are lagging than leading, it must be true that the few largest stocks are leading the market, while the many smaller stocks are lagging. ByteTrend demonstrates that with our new analysis of the size effect.
Average Trend Score by Size in Local Currency
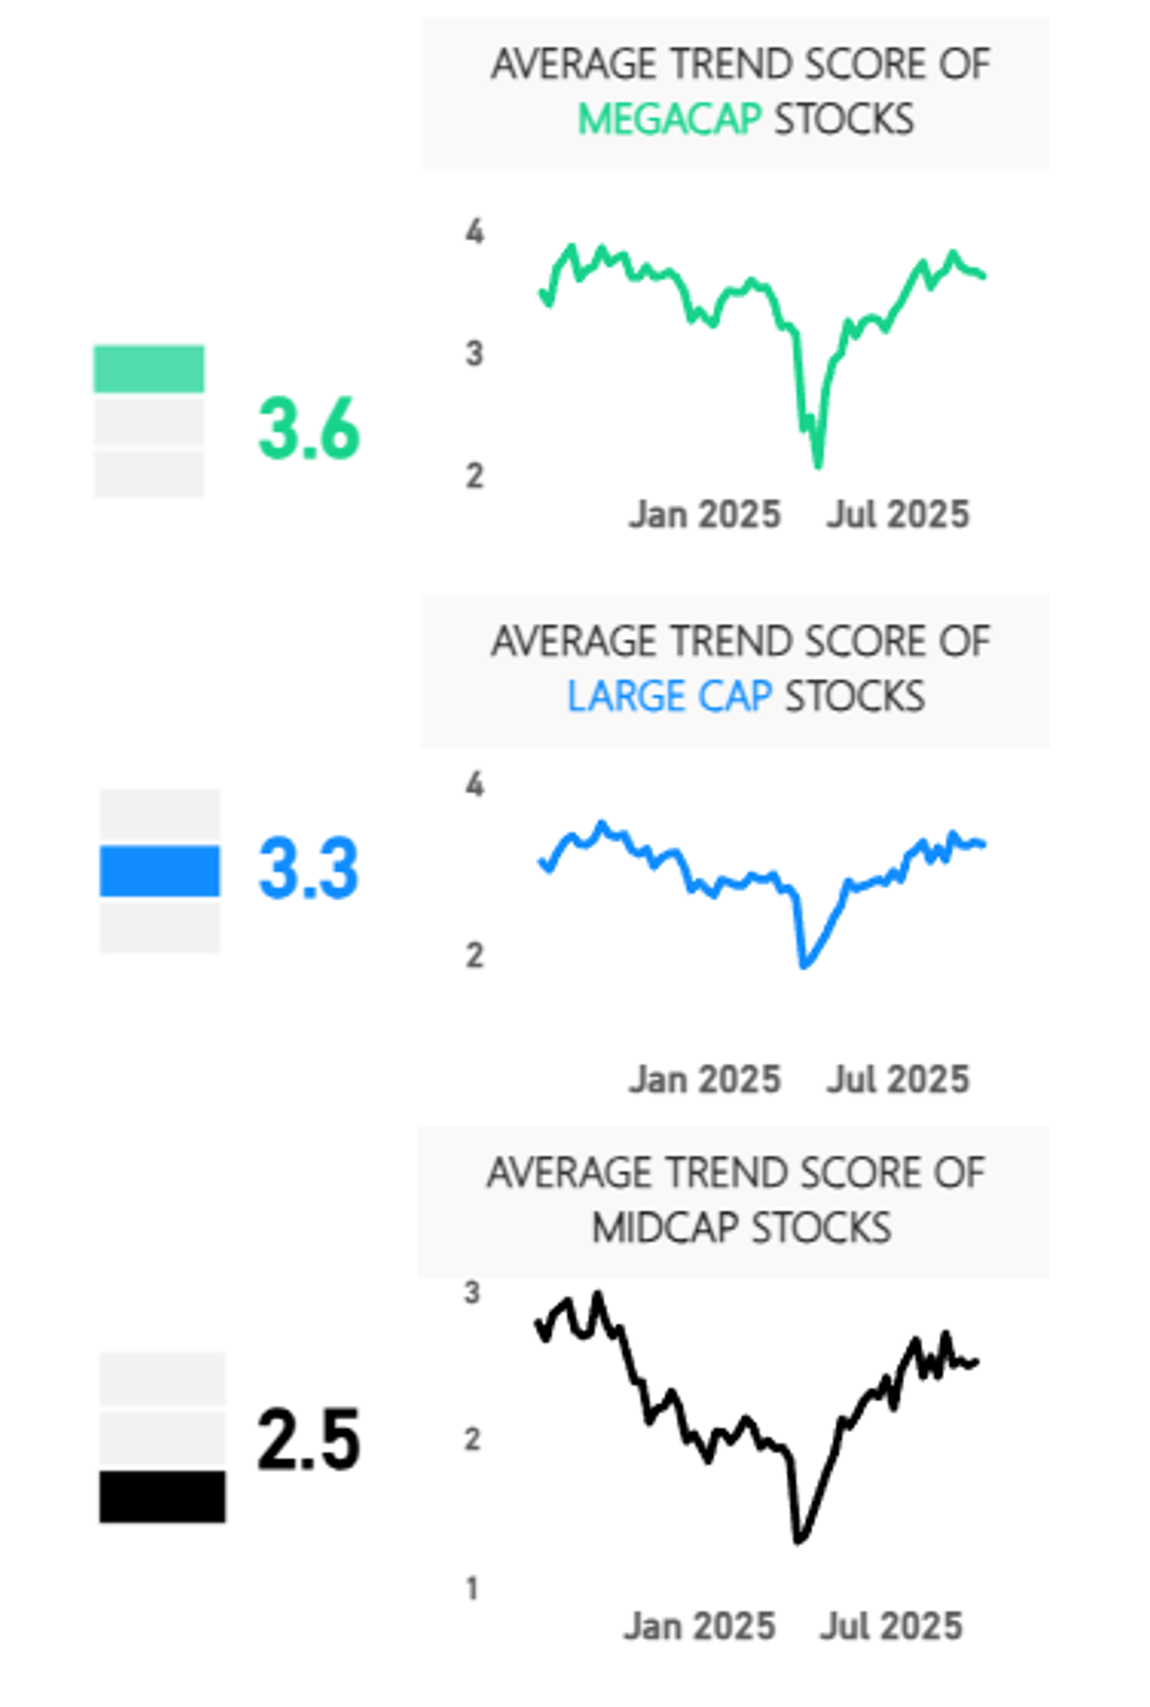
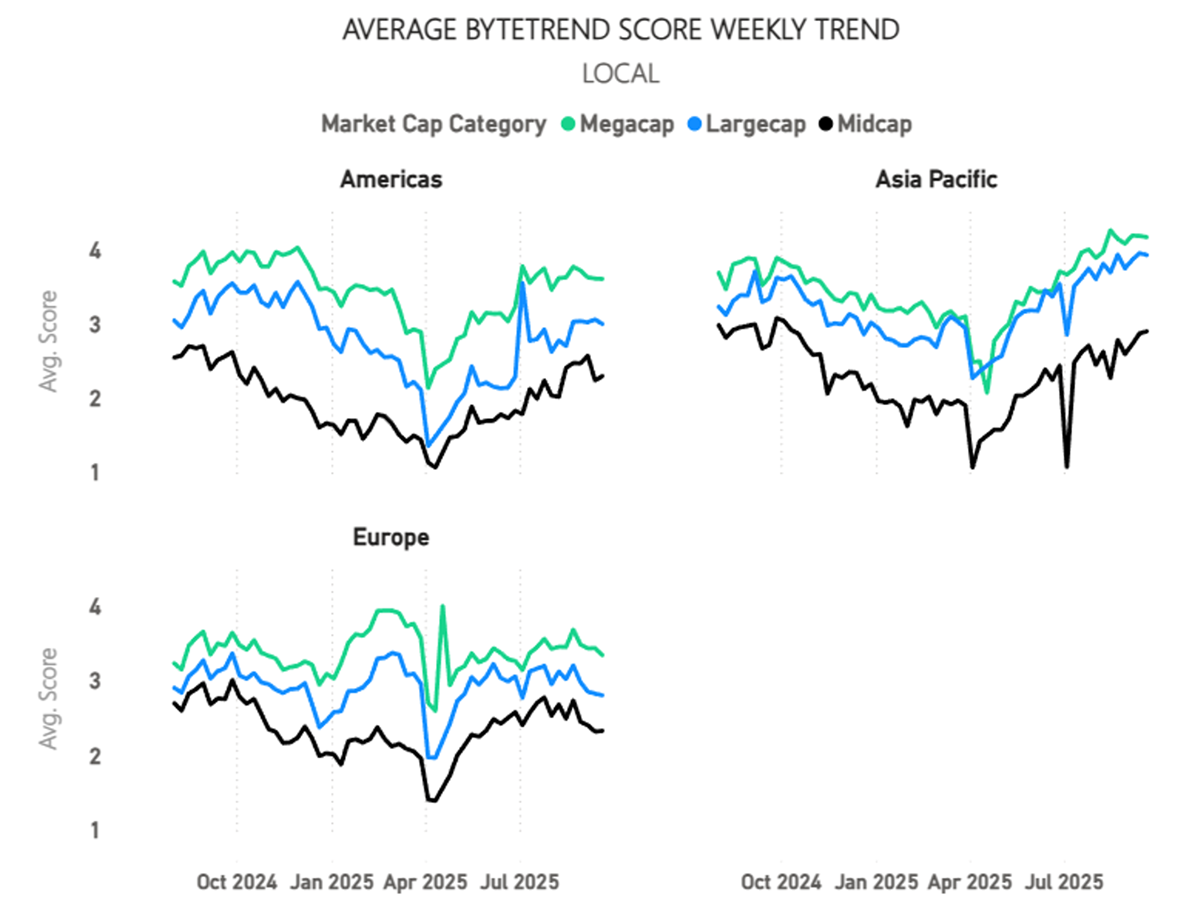
The total market cap of the 2,500 (ish) stocks we cover comes to $111 trillion. We have split it into three groups, each with $37 billion of combined value. The top 33 stocks are the mega-caps, the next 288 are large-caps, and the remaining 2,147 stocks are mid-caps. That is an extraordinary split, with the mega-caps leading the large-caps, which are leading mid-caps in every region. To be absolutely clear, this is not normal, as the mega caps are normally laggards, just not during an AI frenzy.
Average ByteTrend Score Weekly Trend
We show the same data numerically, where mid-caps are a long way behind mega-caps and large-caps.
Average ByteTrend Score by Region and Size
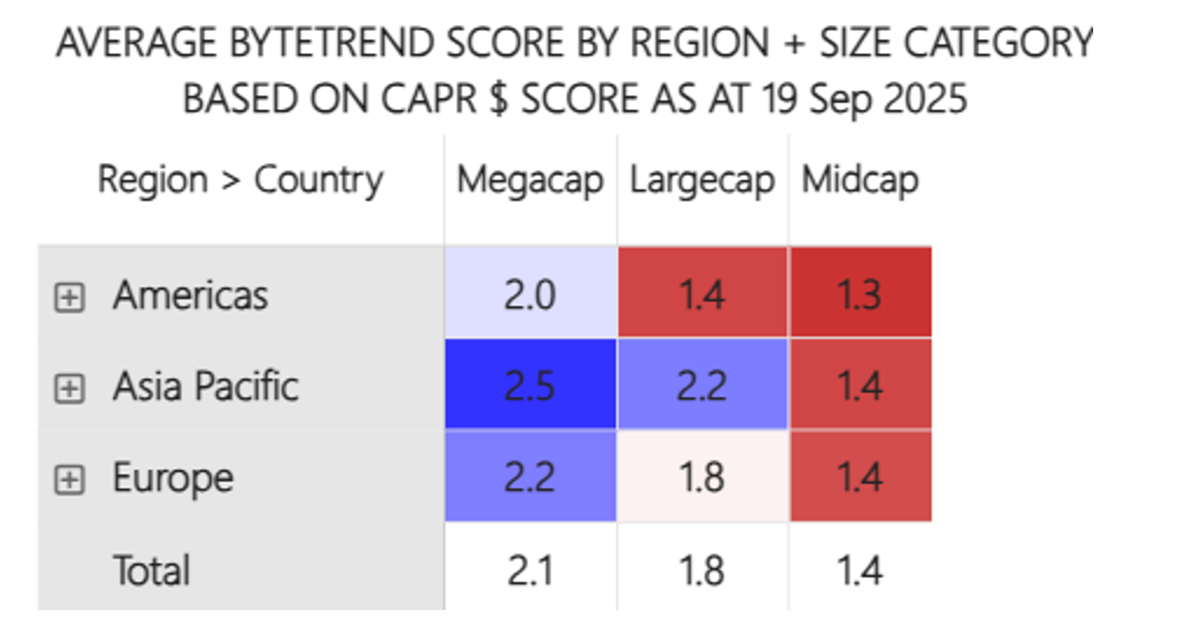
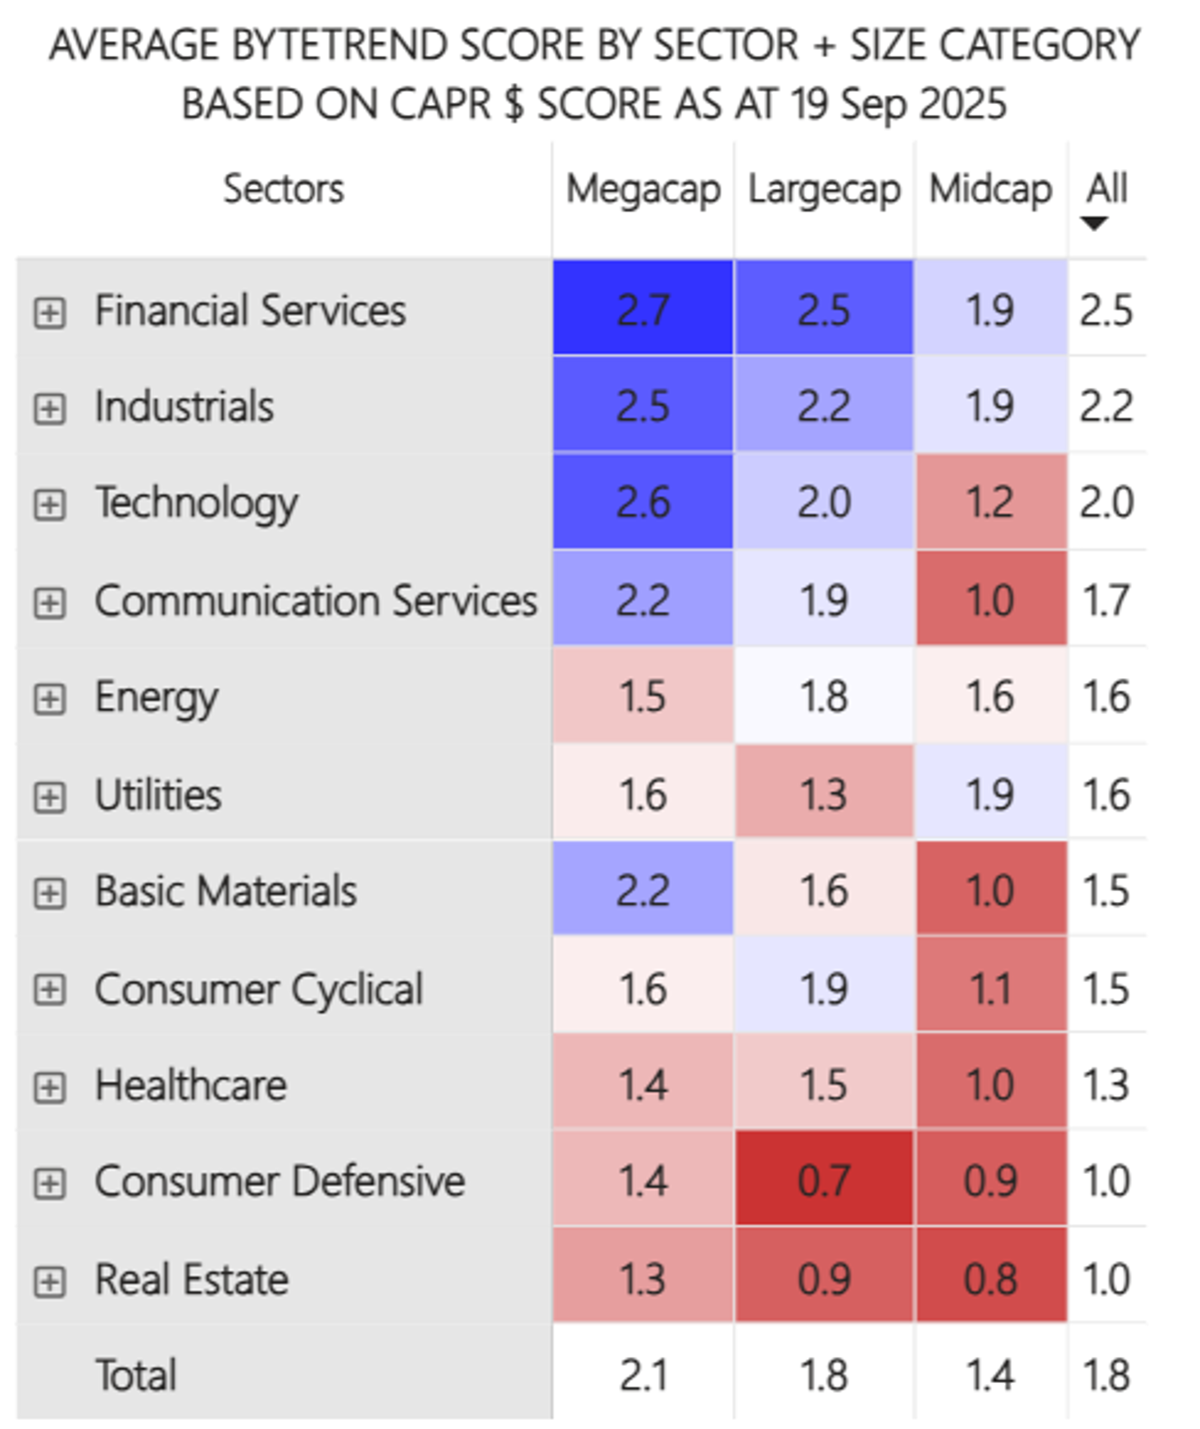
That narrow focus on large-caps is also prevalent at the global sector level.
Average ByteTrend Score by Sector and Size
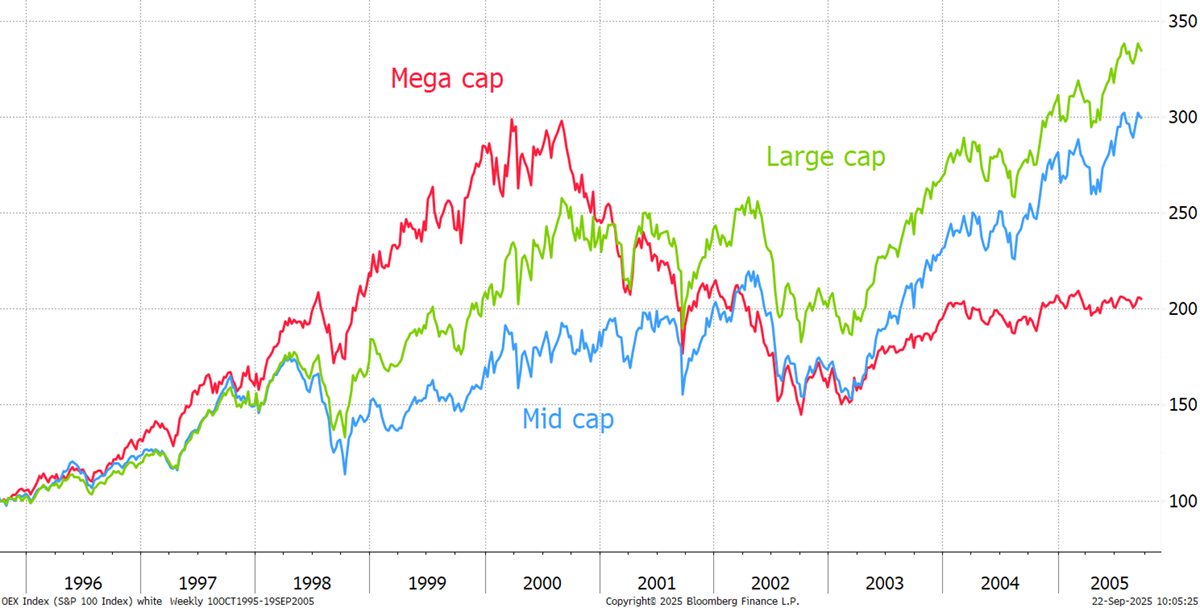
Have we seen this before? Naturally, we have. In the late 1990s, the technology and related stocks became very large as valuations soared. The mega-caps led the way until the top and then collapsed. Investors in the rest of the market didn’t fare too badly.
The Mega-Cap Bubble of the Late 1990s
Our top recommendation from this week’s global trend data will be recommended to ByteTree Pro clients in Venture later today.
Leading Trends with New Highs
These stocks are trading at the 30-week CAPR highs with a ByteTrend Score of 5. All charts shown are CAPR rebased to 100.
| GOOGL | USD | Alphabet Inc. |
| ORCL | USD | Oracle Corporation |
| JPM | USD | JPMorgan Chase & Co. |
| GE | USD | GE Aerospace |
| MS | USD | Morgan Stanley |
| GS | USD | The Goldman Sachs Group, Inc. |
| HSBA | GBp | HSBC Holdings plc |
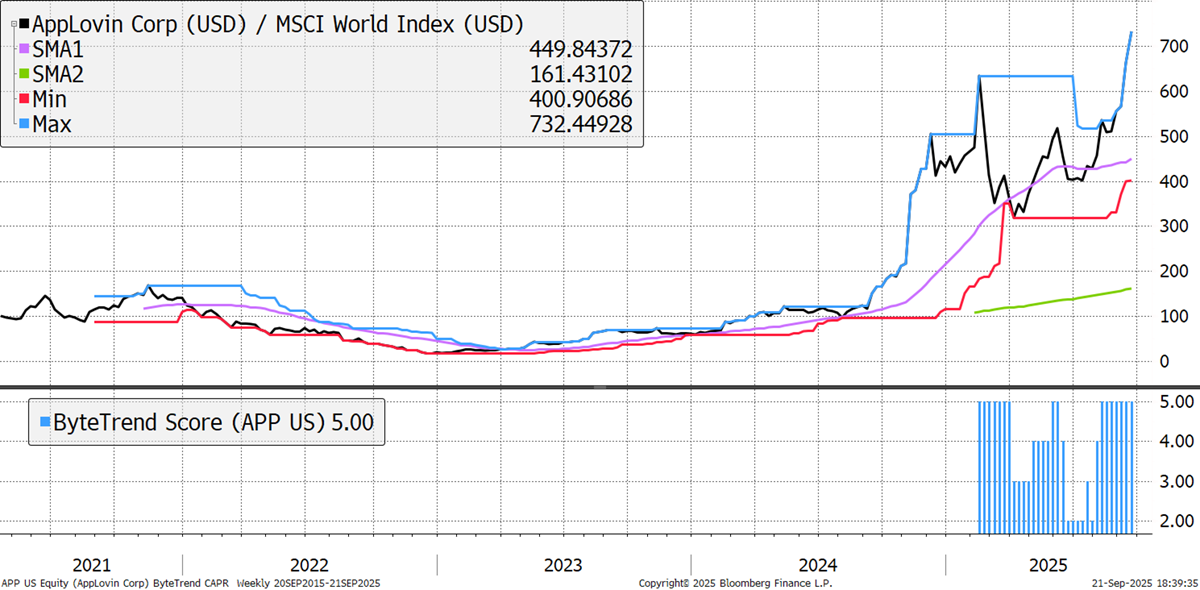
| APP | USD | AppLovin Corporation |
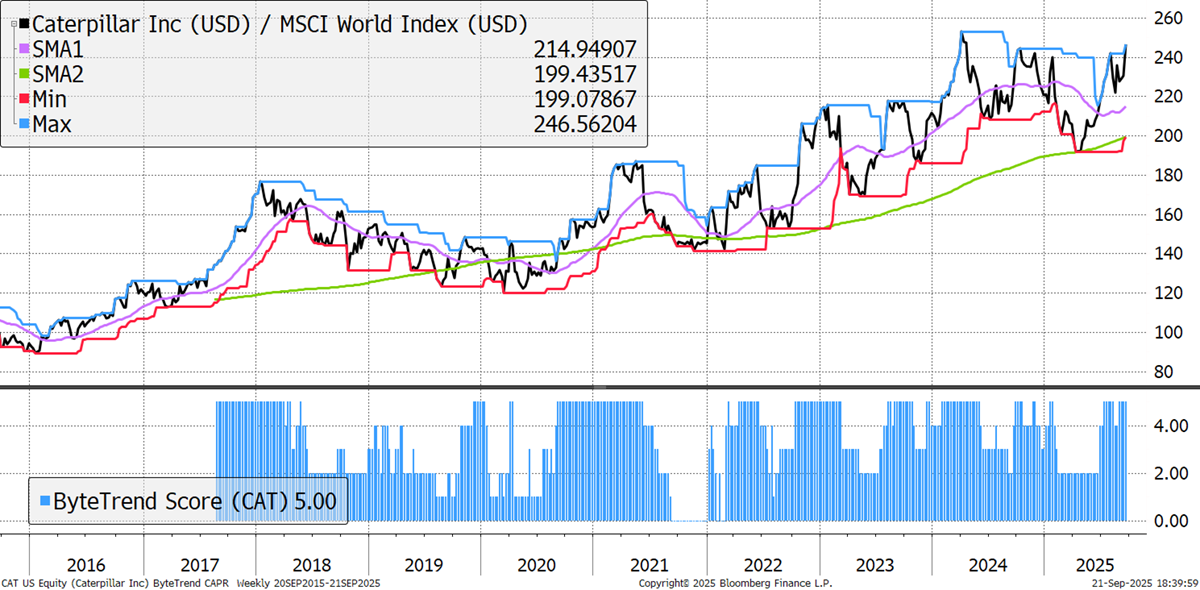
| CAT | USD | Caterpillar Inc. |
| C | USD | Citigroup Inc. |
| ANET | USD | Arista Networks, Inc. |
| MU | USD | Micron Technology, Inc. |
| 660 | KRW | SK hynix Inc. |
| LRCX | USD | Lam Research Corporation |
| APH | USD | Amphenol Corporation |
| SAN | EUR | Banco Santander, S.A. |
| PRX | EUR | Prosus N.V. |
| KLAC | USD | KLA Corporation |
| UBSG | CHF | UBS Group AG |
| RR | GBp | Rolls-Royce Holdings plc |
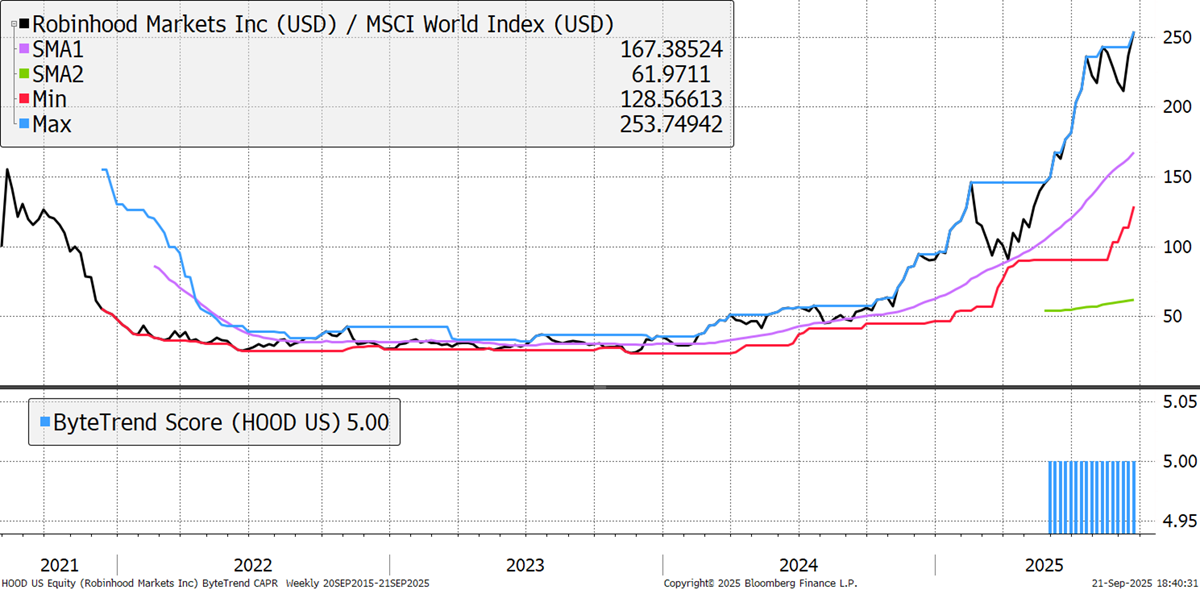
| HOOD | USD | Robinhood Markets, Inc. |
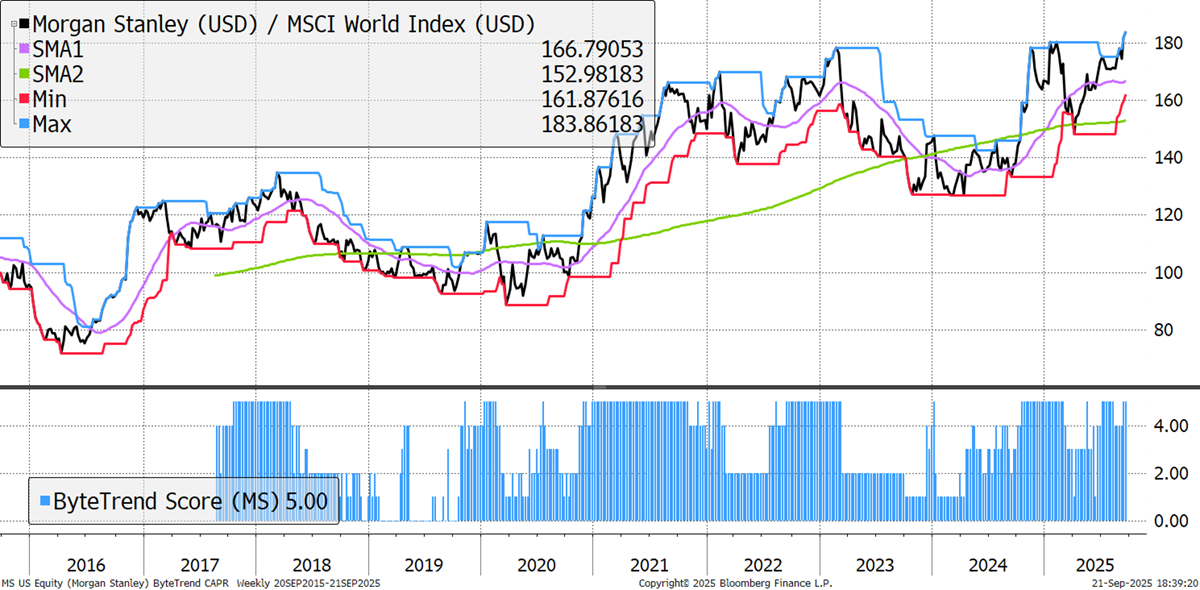
Morgan Stanley
This is Morgan Stanley’s second week as a 5. The global investment bank’s performance in 2025 has been bolstered by strong earnings results, steady revenue growth from its wealth management, investment banking, and trading divisions, and continued cost management. It has benefited from expansion in wealth management and advisory services, which drive recurring revenues. Its Price/Book ratio is back to pre-2008 levels and double its post-crash average.
AppLovin
Advertising software company AppLovin is set to join the S&P today. That is often a case of buy the rumour, sell the news, and the first part has certainly come true as investors have piled in at speed. Revenue growth of nearly 100% and net income of 150% are extraordinary numbers. Analyst price targets are up 5x in the last twelve months alone. Valuations are extreme, but so is the growth, giving it a 360-day volatility of 92, which is extreme.
Caterpillar
Mining equipment provider Caterpillar delivered its biggest surge in free cash flow per share ever in 2023. This came after two decades of steady growth, which has underpinned its steady outperformance. The critical minerals frenzy drove that particular surge, which largely continues today as countries emphasise security of supply. The reasons may change, but the world always needs raw materials, and Caterpillar is still the company they turn to for the pick and shovels.
Robinhood
Robinhood is cashing in. After the 2022 bear market, when revenues fell, it recovered and has delivered 30%-60% growth ever since. Revenues increased 115% YoY to $1 billion in Q4 2024, fuelled by a surge in transactions, especially cryptocurrency trading, which soared over 700% to $358 million. Its Gold subscription offering is also seeing healthy uptake, adding a recurring revenue stream.
There are 62 additional leading trends with new highs in the GTI universe, which is the lowest number we have yet observed. Technology, gold, and large banks dominate the list. There are also banks from Italy and Ireland. Cameco features, but looks lonely in energy. Utilities have practically disappeared.
Emerging Trends
These stocks are trading at the 30-week CAPR highs with a ByteTrend Score of less than 5. They don’t have to be in an uptrend, just emerging. All charts shown are CAPR rebased to 100.
| TSLA | USD | Tesla, Inc. |
| BAC | USD | Bank of America Corporation |
| 5930 | KRW | Samsung Electronics Co., Ltd. |
| ASML | EUR | ASML Holding N.V. |
| BX | USD | Blackstone Inc. |
| INTC | USD | Intel Corporation |


