
Feeding the Bear


Issue 36;
- Trump blows the markets with a threat over China sanctions, then backtracks.
- Precious metals provide sanctuary.
- Defensives catch a bid.
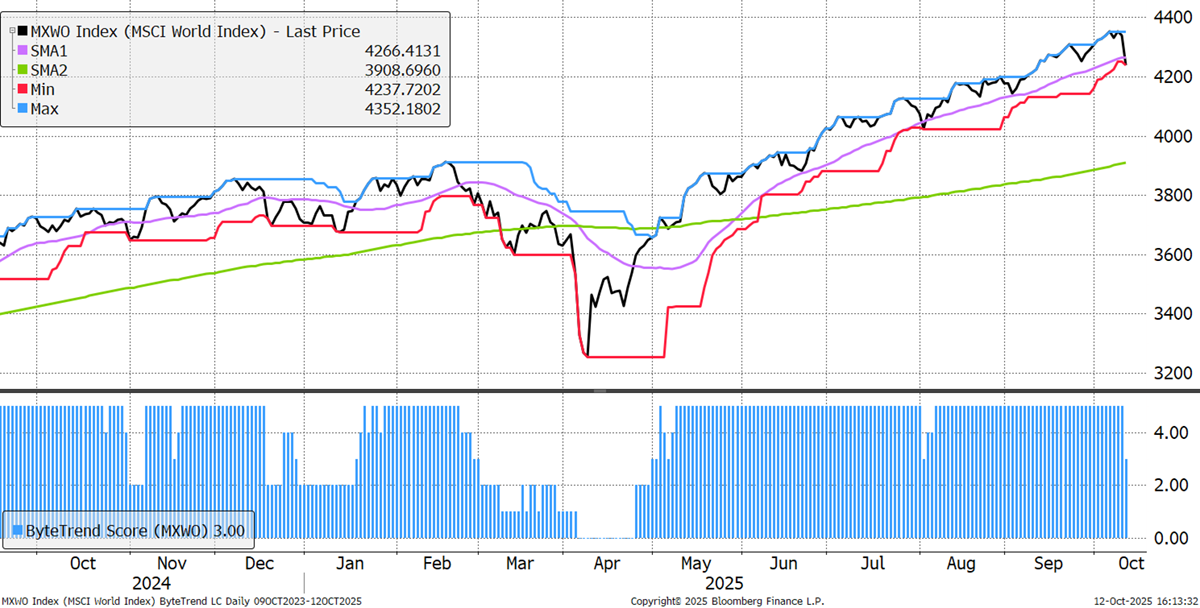
The World Index dropped to a 3 from a 5 last week, following Trump’s renewed trade war with China. The greatest fears were averted as he reversed his position over the weekend. This is not how healthy bull markets should operate.
World Index – Developed Markets – Daily
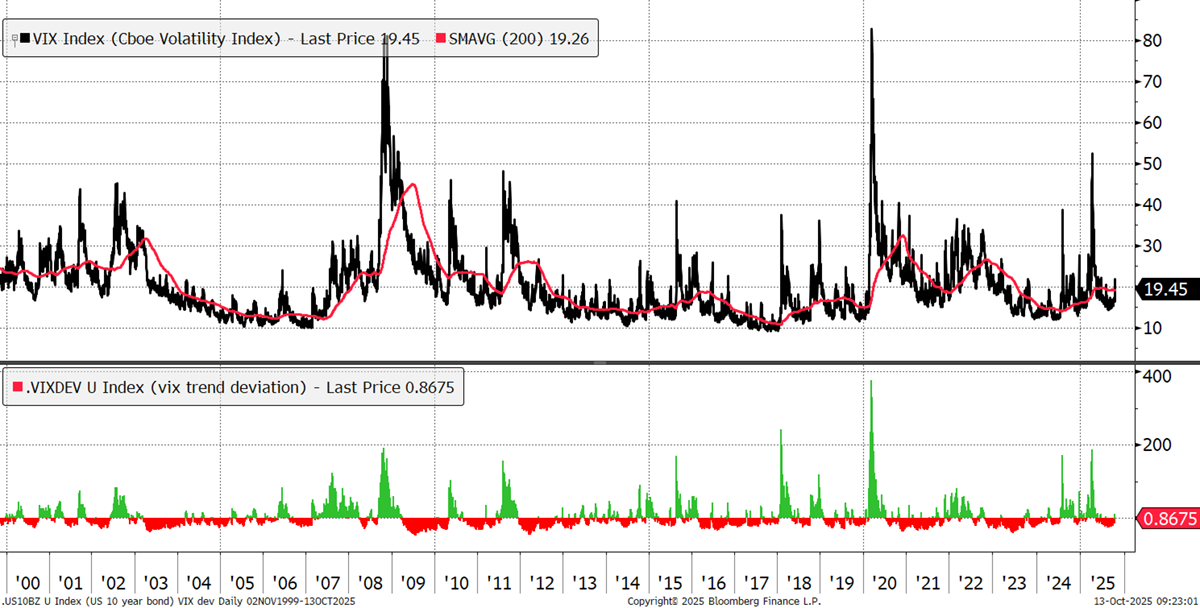
The measure of implied volatility spiked on Friday afternoon to 22% and has cooled to 19% on Monday morning. The VIX is currently above its 200-day moving average, which urges caution.
S&P 500 Implied Volatility – The VIX – Daily
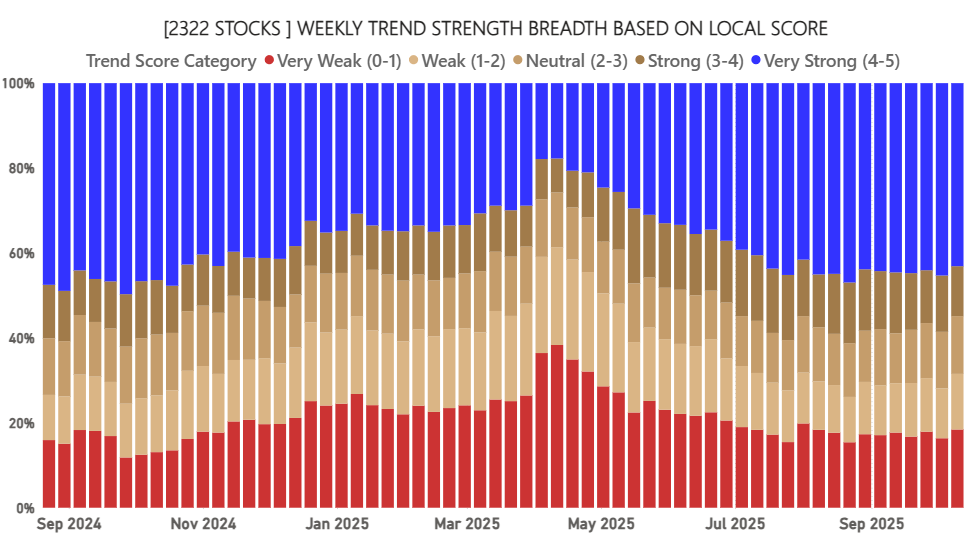
Global market breadth retreated slightly. There are fewer blue stocks with a score of 5, and a few more red stocks with a score of 0. This is not yet material, but something to monitor.
ByteTrend: Weekly Breadth Signal – Local Currency
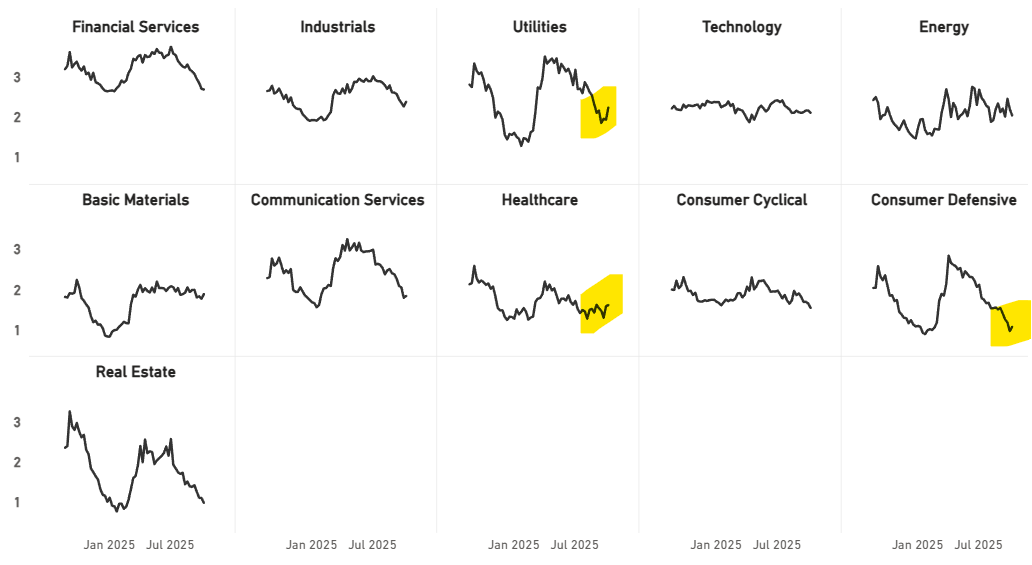
Defensive sectors outperformed the market, as shown in yellow. Healthcare continues to make progress.
Global Sectors in CAPR
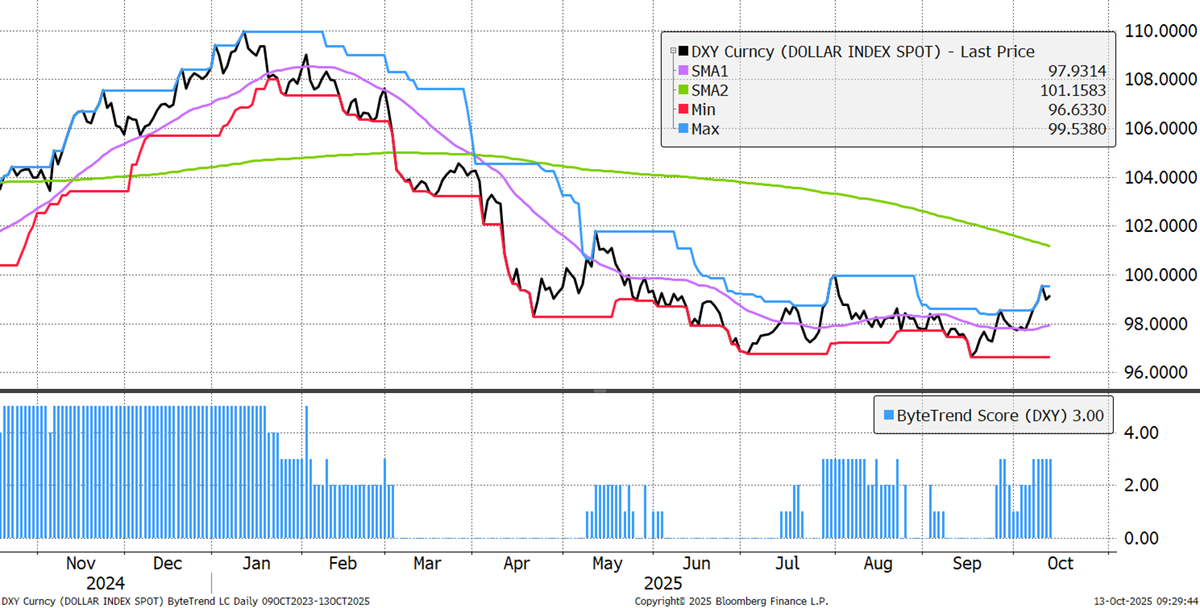
The dollar has risen to a ByteTrend Score of 3 on the daily chart. The downtrend is being challenged.
The US Dollar Index DXY - Daily
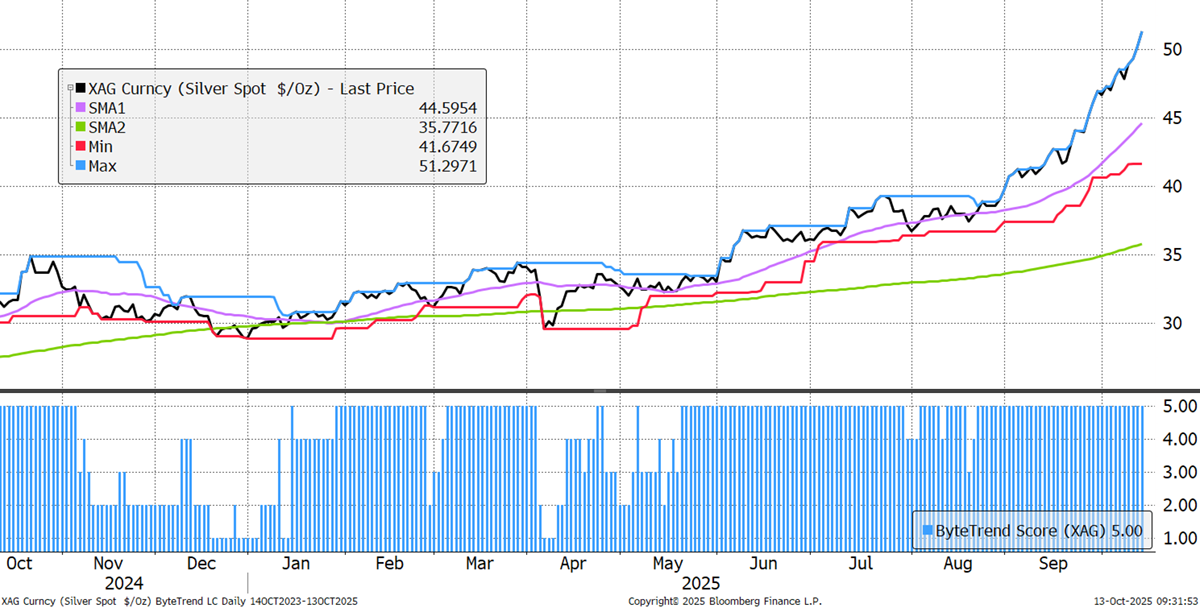
Despite dollar strength, precious metals continue to run, and silver has come through a turbulent weekend at an all-time high above $50 per ounce. All the silver held in the world’s ETFs amounts to a market cap equivalent to Porsche. Precious metals have shrugged off the events over recent days, which won’t go unnoticed by asset allocators.
Silver - USD - daily
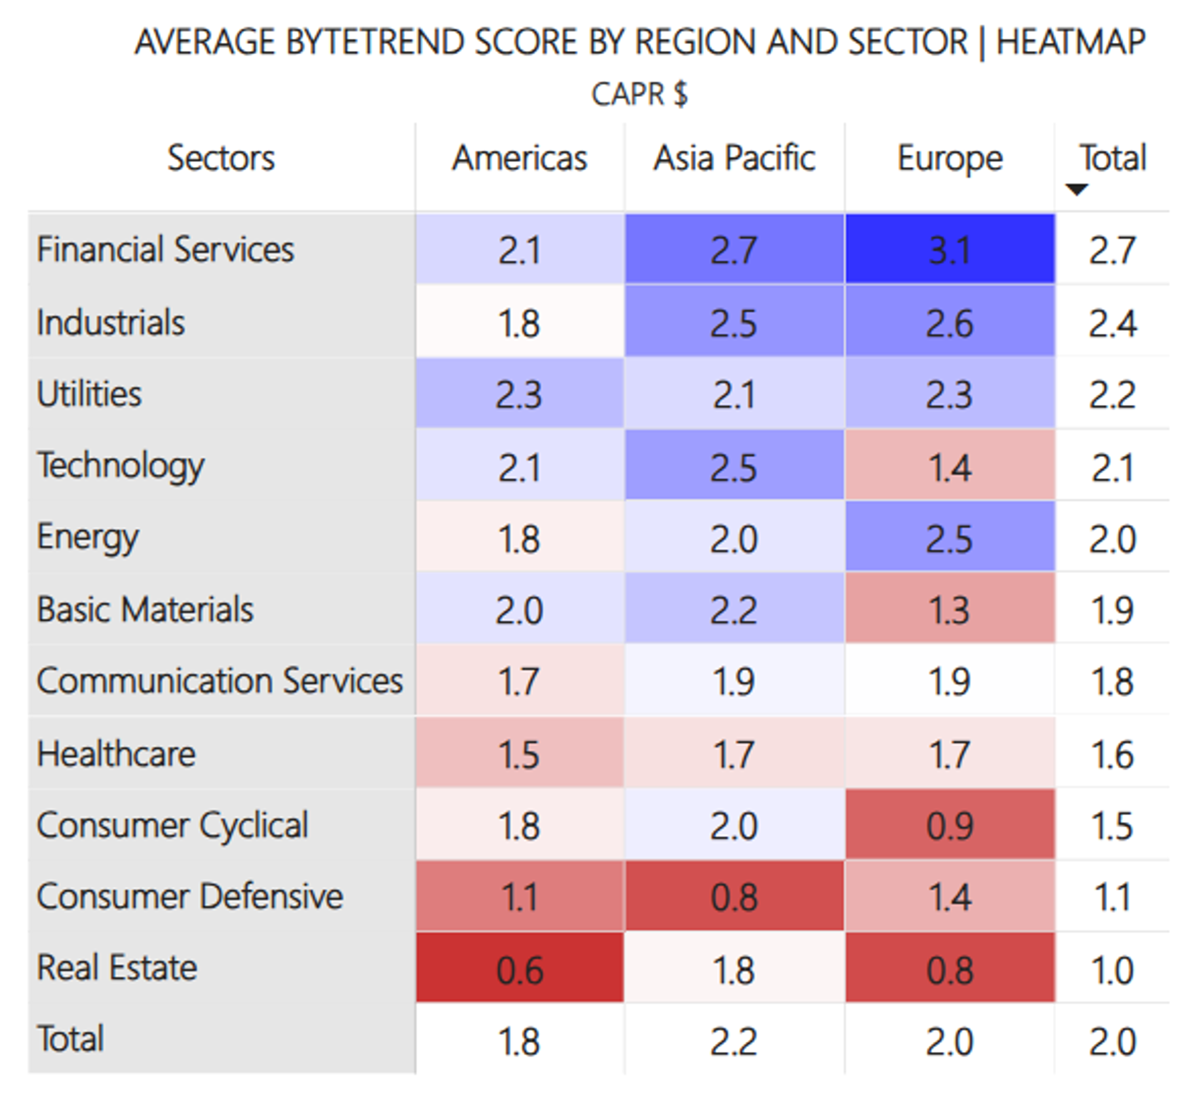
The world matrix sees a rise in defensive sectors such as utilities, healthcare and consumer defensives. Basic materials also improved. Energy declined as the oil price slid below $65 on Friday, and real estate also declined. Asia Pacific improved.
Average ByteTrend Score by Region and Sector Heatmap - CAPR
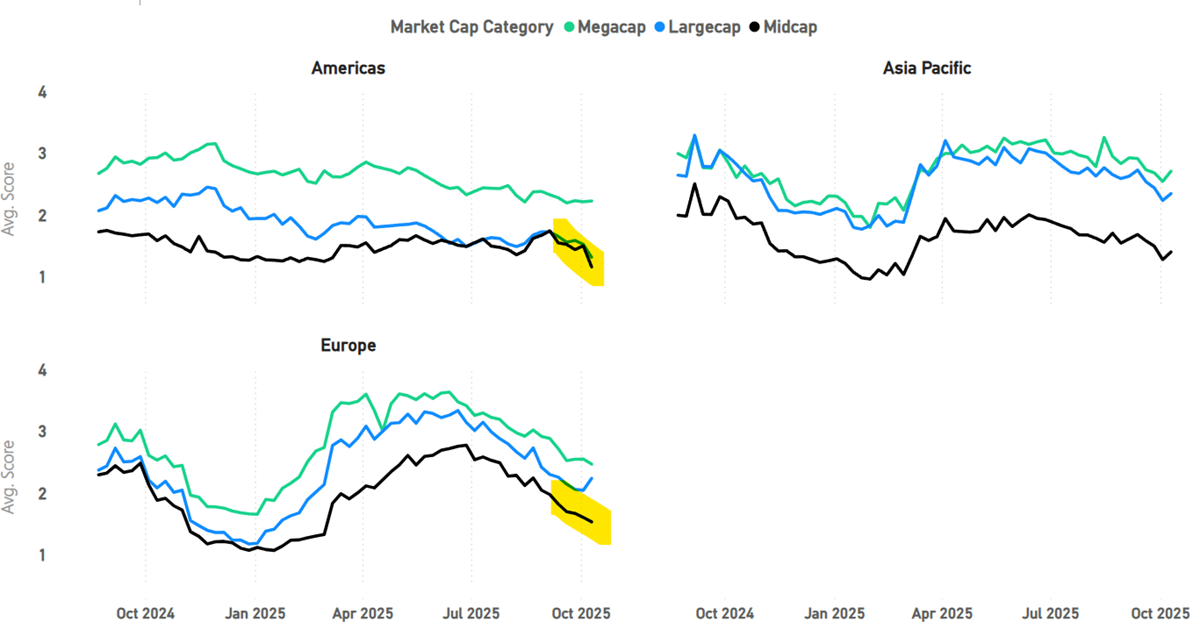
In assessing the damage on Friday, it is also noticeable that midcaps are deteriorating in CAPR, in the US and Europe. On closer examination, the worst sectors were mid-cap technology and REITs. This was most noticeable in the US and Europe.
Average ByteTrend Score by Stock Size - CAPR
Leading Trends with New Highs
These stocks are trading at the 30-week CAPR highs with a ByteTrend Score of 5. All charts shown are CAPR rebased to 100.
| 2330 | TWD | Taiwan Semiconductor Manufacturing Company Limited |
| AMD | USD | Advanced Micro Devices, Inc. |
| CAT | USD | Caterpillar Inc. |
| 9984 | JPY | SoftBank Group Corp. |
| 660 | KRW | SK hynix Inc. |
| ANET | USD | Arista Networks, Inc. |
| AIR | EUR | Airbus SE |
| ABBN | CHF | ABB Ltd |
| D05 | SGD | DBS Group Holdings Ltd |
| IBKR | USD | Interactive Brokers Group, Inc. |
| CEG | USD | Constellation Energy Corporation |
| 2899 | HKD | Zijin Mining Group Company Limited |
| 1088 | HKD | China Shenhua Energy Company Limited |
| DELL | USD | Dell Technologies Inc. |
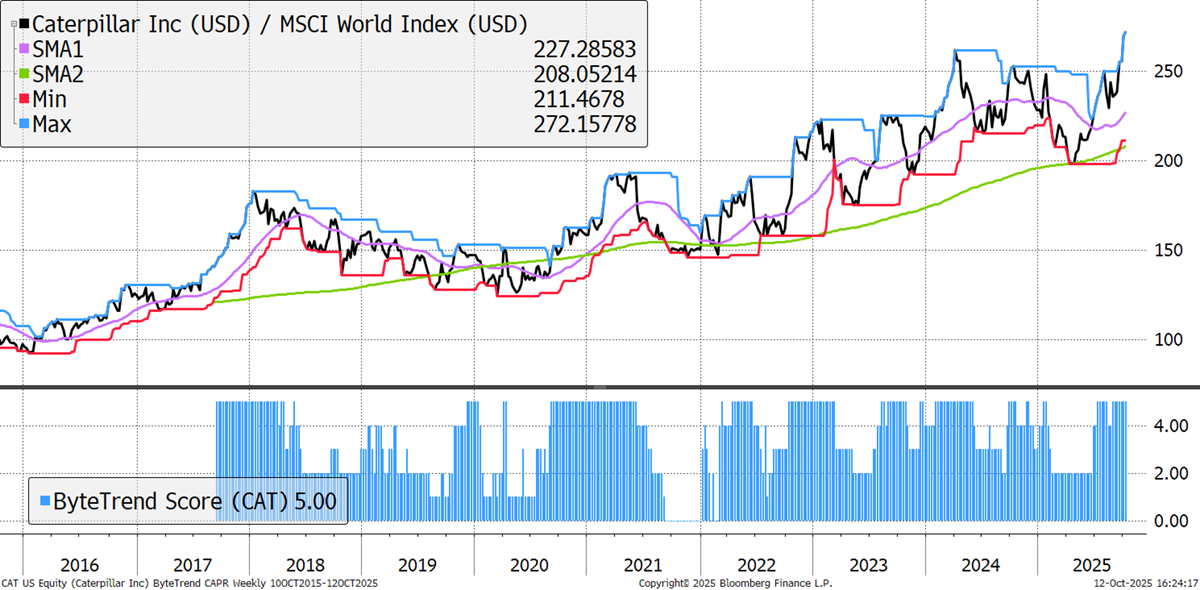
Caterpillar
Caterpillar returns. It first featured during the “Weather Warning”, the brief dip in the World Index in early August, when CAT’s resilience gave it a CAPR boost. It has held onto its score of 5, as other metals are beginning to show signs of following gold higher. Are Caterpillar and commodities warning of higher inflation again?
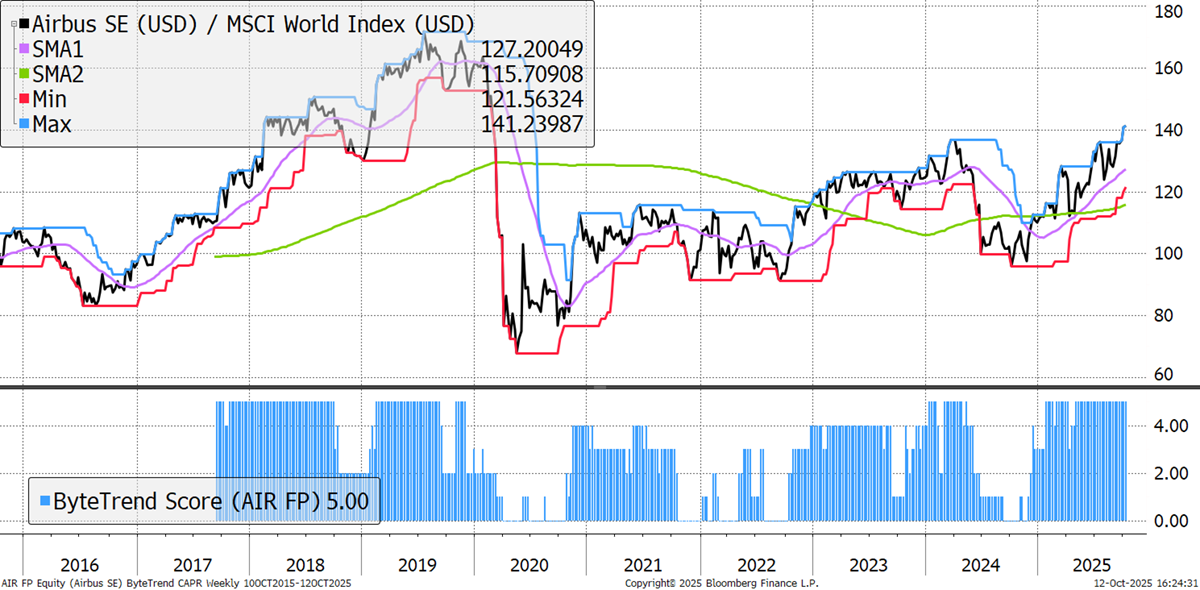
Airbus
Airbus is an example of a steady leading trend. Apart from a couple of weeks during the tariff tantrum, it hasn’t missed a beat all year. The defence theme remains solid, while global travel continues its post-pandemic rebound. The well-known struggles at rival Boeing have also made it look good in relative terms, but it always pays to operate in a duopoly.
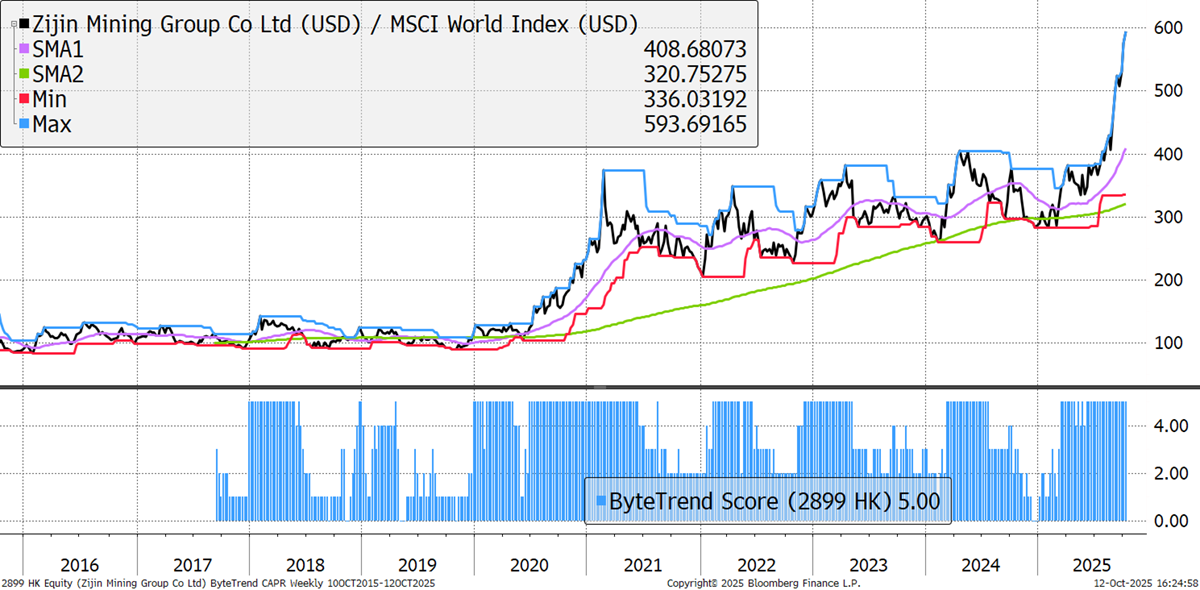
Zijin Mining
Zijin was first featured in these pages on July 28 and is up 57% since. It was a leading trend outside of the GTI Top 200, featuring in the GTI Premium Spreadsheet months before that. Gold has already boomed, and copper looks cheap in relative terms. If anything, diversification is holding Zijin back for now, but copper could soon join the commodity bull market, which has so far largely been confined to precious metals.
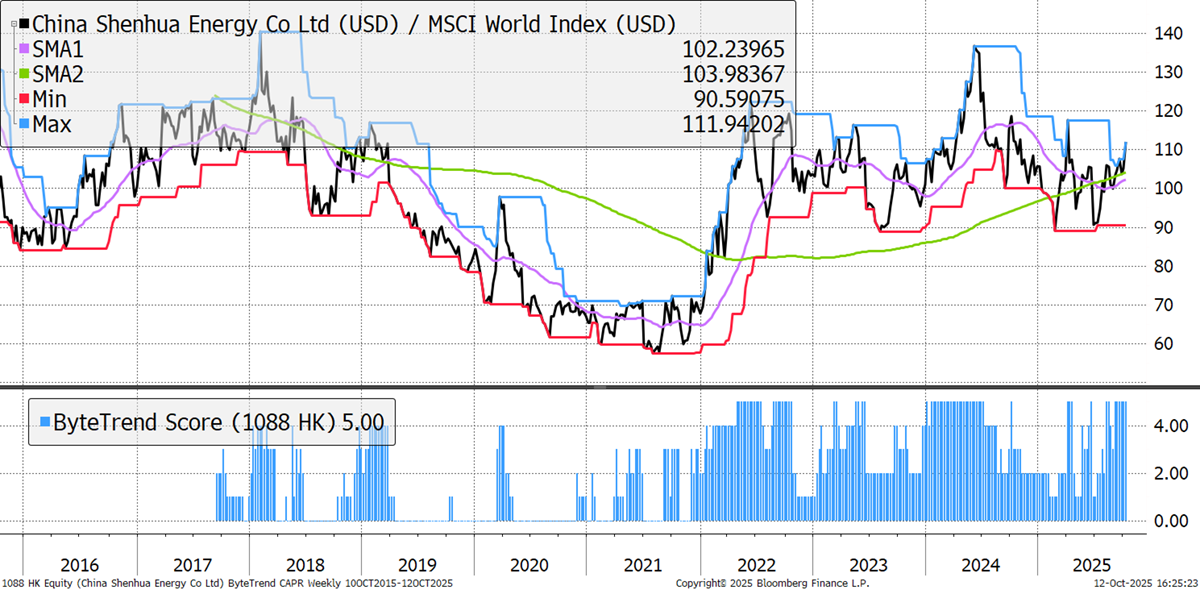
China Shenhua Energy
China Shenhua is a coal power business. Despite lower coal prices, it maintained a strong gross margin and reported net profit of RMB 24.6 billion for H1 2025, supporting stable dividends under its new 2025–2027 Shareholder Return Plan. Falling prices are shifting profit dynamics in China’s chemicals sector, benefiting Shenhua’s coal-to-olefin production, while it continues diversifying into new energy sources.
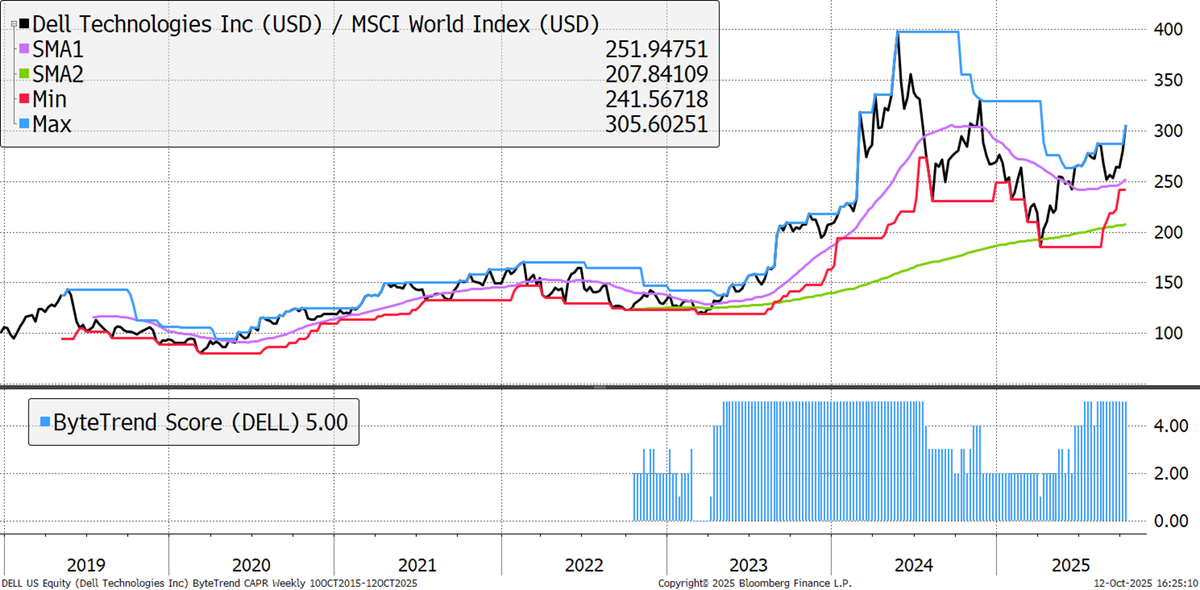
Dell Technologies
The product of Michael Dell’s dorm room, Dell has a turbulent past. Back in the 1990s, Dell pioneered the "Dell Direct Model," which allowed it to sell customised PCs directly to customers, and it thrived. The tech bubble and 2008 hit hard, and it was taken private in 2013, before re-emerging as Dell Technologies in 2018. It’s a very different company today, with a focus on AI.
There are 100 additional leading trends with new highs in the GTI universe. Industrials dominate the list in electricals and engineering. Financials are thinning, having been dominant this year, but not so in South Africa. Precious metals feature alongside copper. Semiconductors remain strong with IT hardware. UK supermarkets feature.
Emerging Trends
These stocks are trading at the 30-week CAPR highs with a ByteTrend Score of less than 5. They don’t have to be in an uptrend, just emerging. All charts shown are CAPR rebased to 100.
| 5930 | KRW | Samsung Electronics Co., Ltd. |
| INTC | USD | Intel Corporation |
Emerging trends are a thin list this week as the dominant themes have played out, at least among the top 200 stocks. Expect this to bulge in the not-too-distant future.


