
Gold Price Crash


Issue 51;
- Major correction in precious metals since Friday.
- Rotations into REITs and Consumer defensives.
- The chance of weakness spreading into equities has increased.
Global Trends is a deep dive into global equities. The aim of this analysis is to better understand which countries, sectors, industries, and stocks are driving market returns. Not only does it help investors identify opportunities, but it also highlights the risks. We try to condense as much important information as possible, focusing on what really matters each week. Embrace this as a weekly discipline, and you’ll soon have a much better understanding of global financial markets.
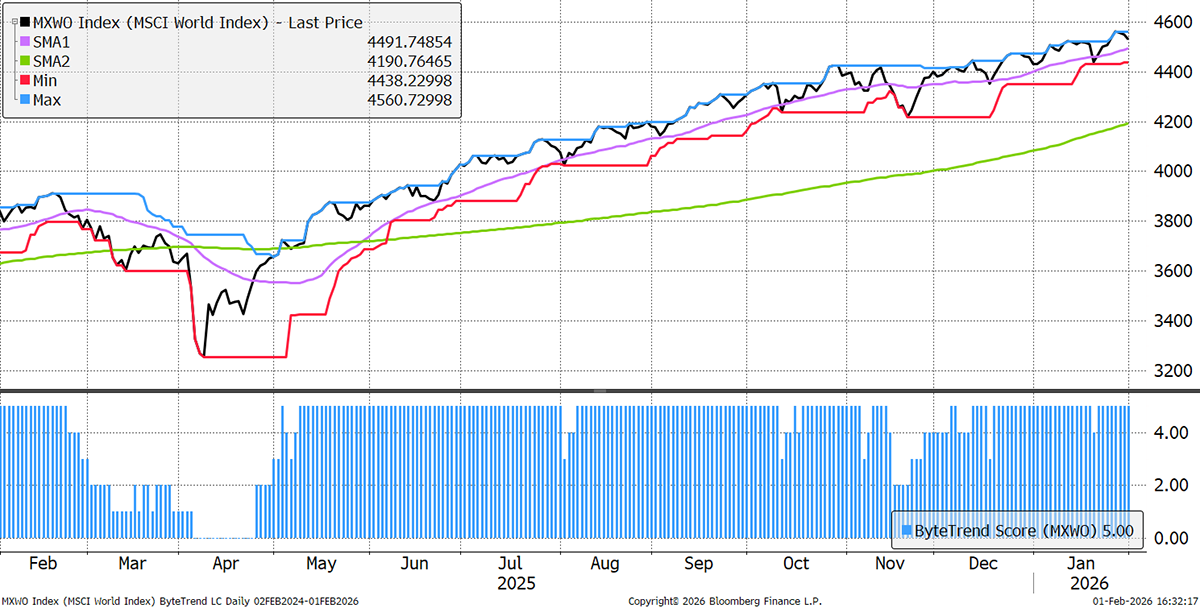
The World Index retains a ByteTrend Score of 5 in USD. It is worth highlighting that in EUR this drops to a 3, and in CHF, a 2. Despite the modest dollar bounce since Friday, the DXY Index is down 11% over 12 months. Of the top ten stocks, only Alphabet made a CAPR high last week, while the ByteTrend Scores of the other major companies continue to weaken. Big stocks can no longer be relied upon to drive global equities higher.
World Index – Developed Markets – Daily
Gold Crash
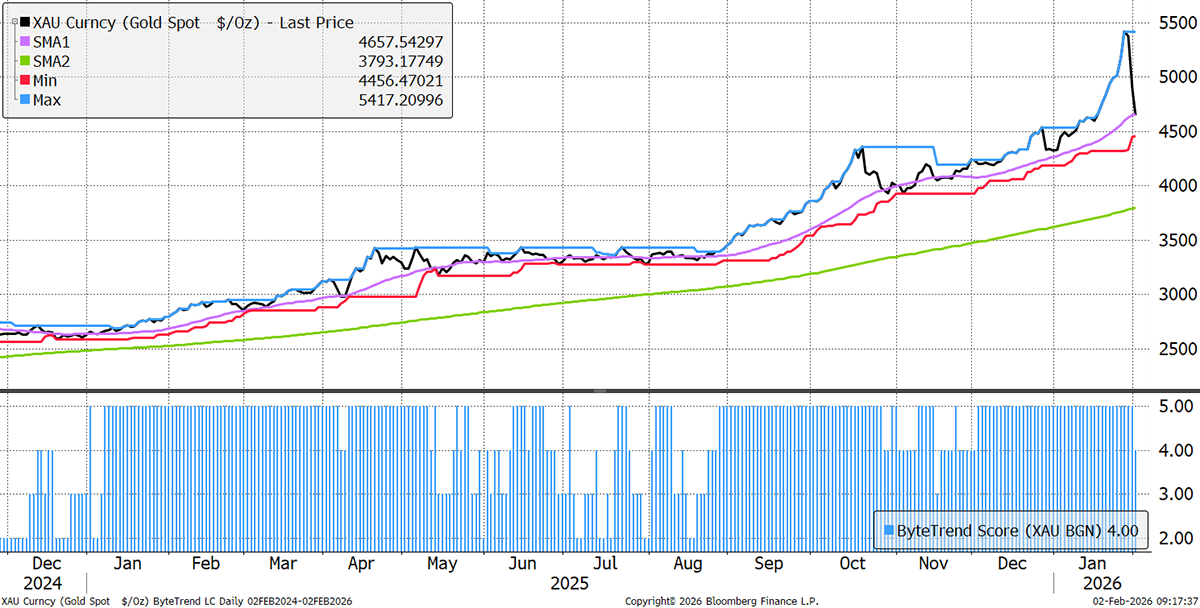
Only last week, we reported that gold broke above $5,000 for the first time in history. That didn’t last for very long, and the price has crashed back towards the October high, which was the last time it was heavily extended from trend. The price was 32% above the 200-day moving average in October, and 44% on Thursday. Today, it has dropped to 22%. The gold price is back to its 30-day moving average, and the ByteTrend Score is a 4 on the daily chart. The trend is still bullish, but with volatility at extreme levels, it will take time to re-evaluate the situation.
Gold Price Daily
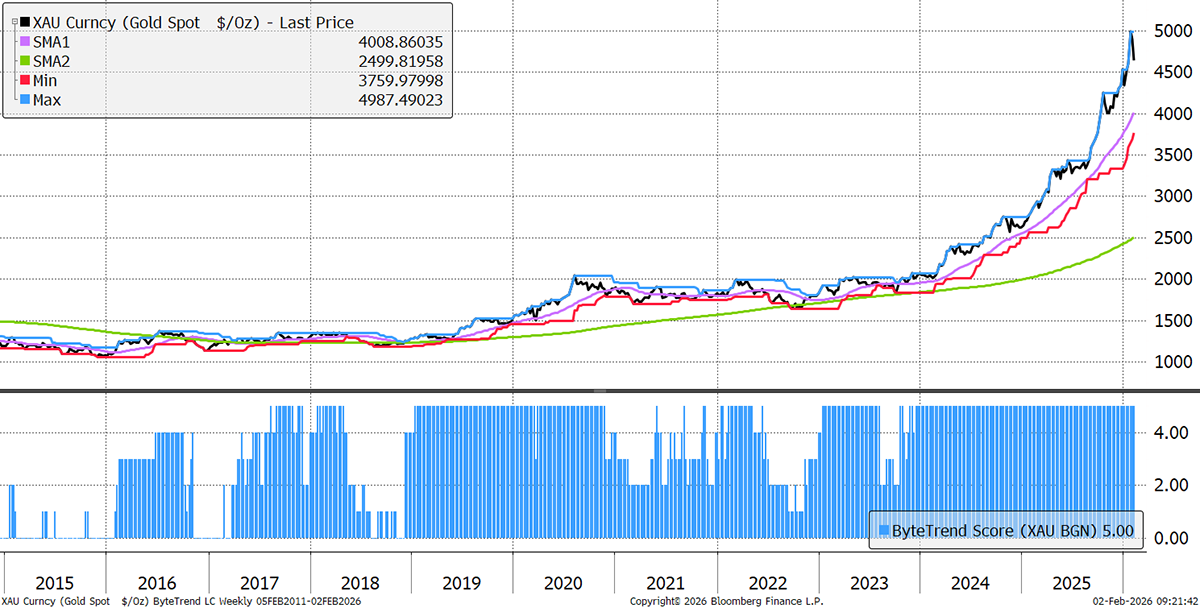
The weekly chart easily retains a ByteTrend score of 5, but note the price is twice the level of the 200-week moving average.
Gold Price Weekly
I wrote my monthly gold report, Atlas Pulse, on Friday, but much has happened since publication.
Country Trends
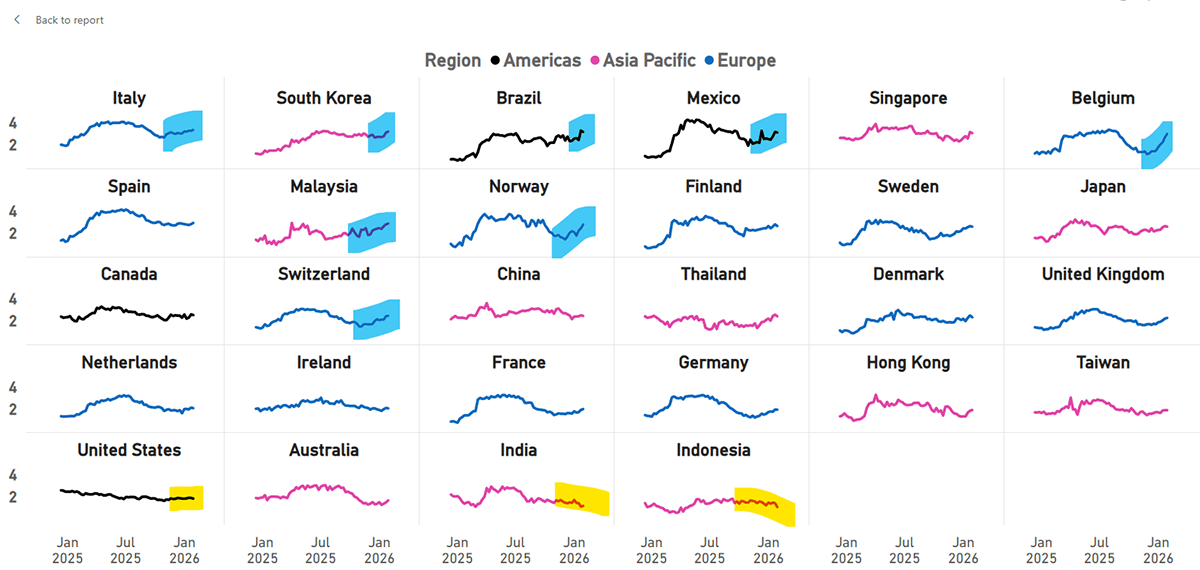
Most countries are beating the World Index, principally because the US is lagging and is the fourth weakest. India and Indonesia are also lagging, but that doesn’t move the dial. Some of the smaller countries in Europe and Emerging Markets are the strongest performers.
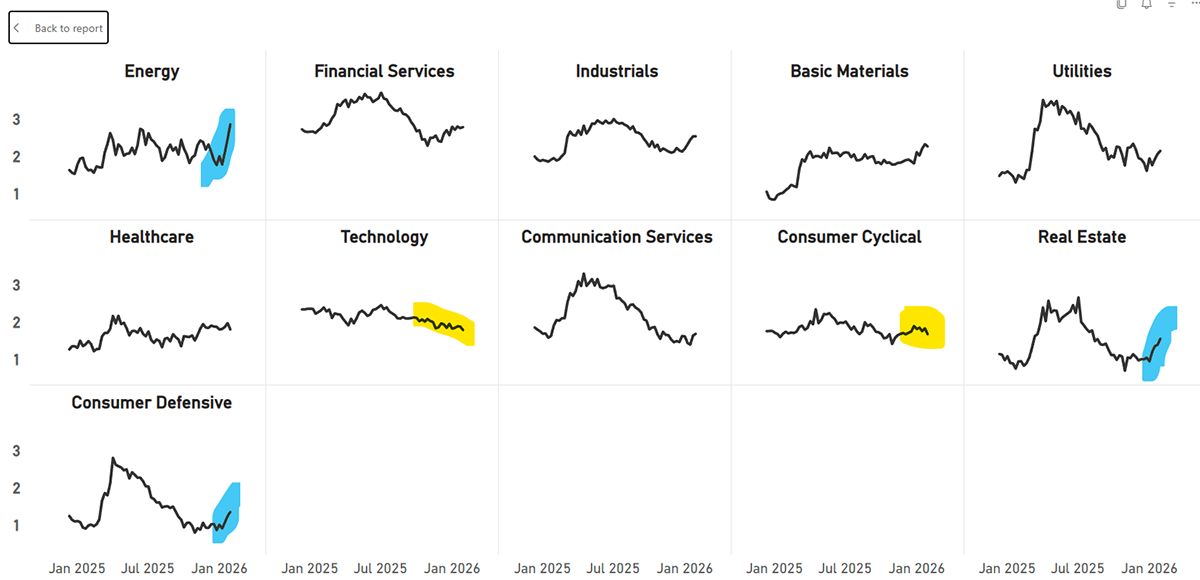
Sector Trends
Energy surges and, in the stocks below, Exxon is back on the leaderboard. Technology continues to weaken, along with Cyclicals. Most notable are the strong moves in Real Estate and Consumer Defensives. This setup is what we would be likely to see ahead of a bear market. Early days.
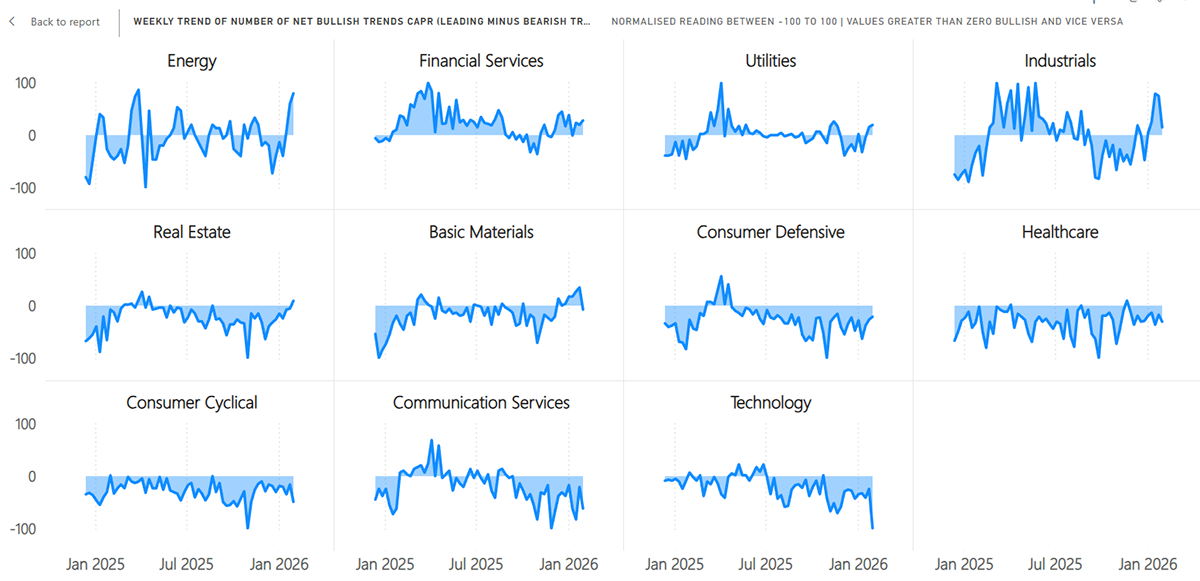
Sector Trend Classification Changes
This chart shows the same sectors but highlights the weekly change in ByteTrend Scores. Energy stands out the most on the upside, and technology on the downside. REITs and consumer defensives are stronger, but with many companies retaining low scores, expect this to move even higher over the coming weeks.
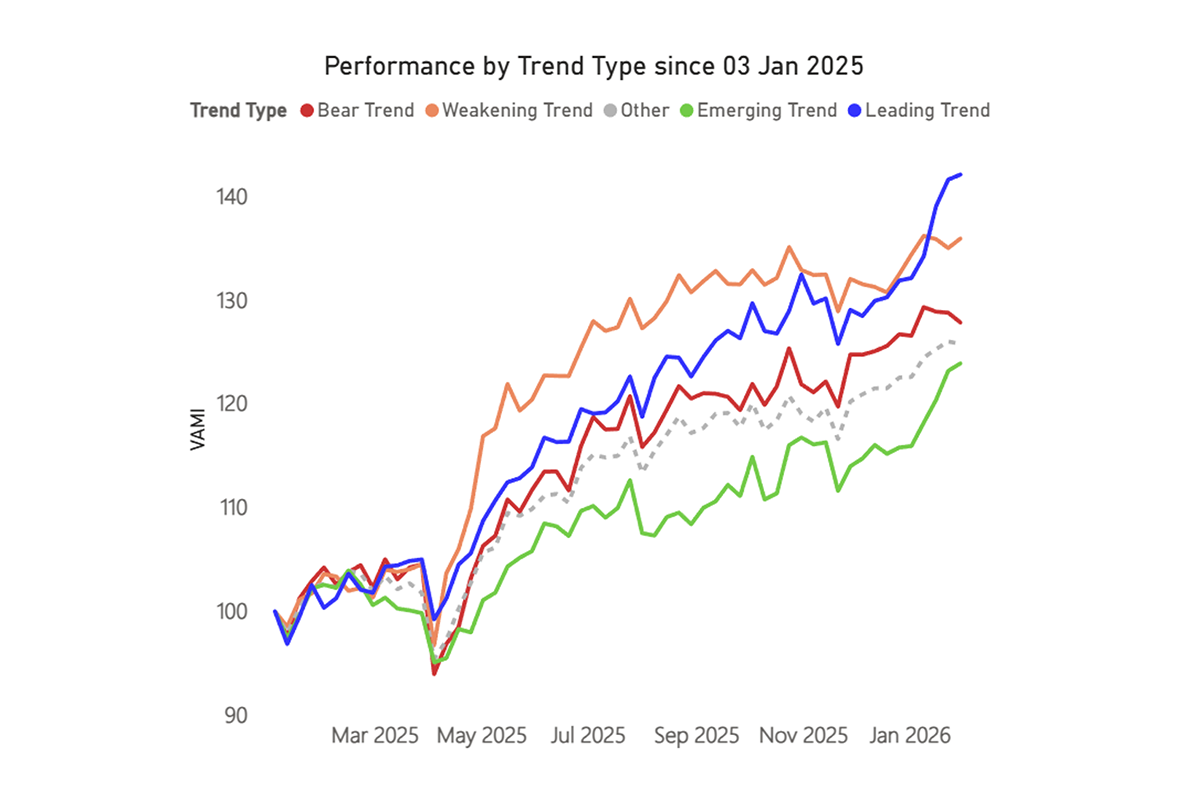
Performance by Trend Type
The leading and emerging trends now dominate performance this year. The bear trends may have started to turn down. Weakening is always curious because these stocks have weakened in terms of trend score, but are also oversold, just as the emerging trends are overbought, having demonstrated strong short-term performance. A bear market is normally led by the bear stocks. The VIX index of market volatility has risen to 20 as of Monday morning.
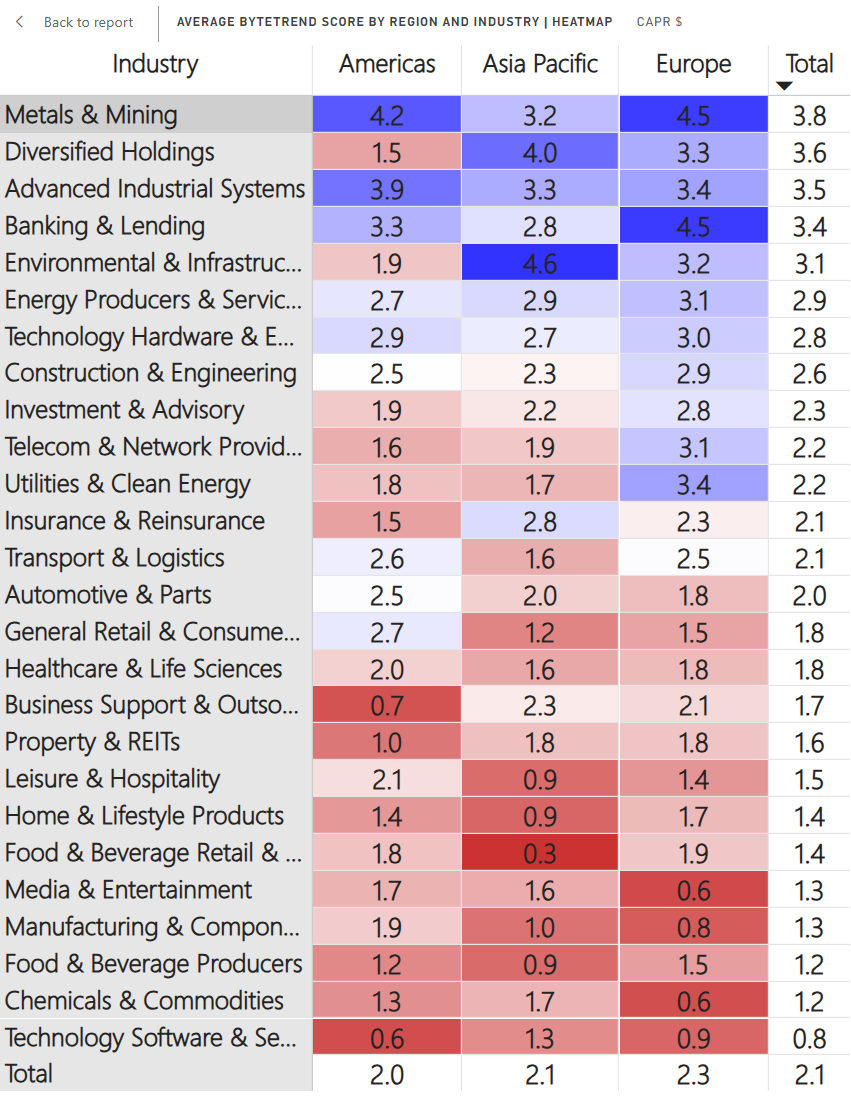
Regions and Industries Average CAPR Score
Energy Producers and Services made the largest move this week, with notable strength in the Americas and Europe. Telecoms also rose, led by Europe. REITs also continued their comeback. Software remains at the bottom and has weakened further, while the slump in Media and Entertainment also worsened.
The Value Composite Score (Value) is measured against the company’s own financial history and not in absolute terms. The columns are Cheap (Chp), Value (Val), Fair Value (FV), Overvalued (OV), and Expensive (Exp). The Growth Composite Score (Growth) is measured by sales, earnings cash flow, dividends, and book value on a per share basis. The columns are High, Good, Medium (Med), Low, and Negative (Neg).
Leading Trends with New Highs
These stocks are trading at the 30-week CAPR highs with a ByteTrend Score of 5. All charts shown are CAPR rebased to 100.
| Name | Annual Vol 30w | Mkt Cap $Bn | Value | Growth |
| Alphabet Inc. | 27 | 4079 | OV | Good |
| Samsung Electronics Co., Ltd. | 34 | 740 | Exp | Good |
| ASML Holding N.V. | 39 | 559 | OV | Good |
| Micron Technology, Inc. | 57 | 467 | Exp | Low |
| SK hynix Inc. | 56 | 433 | Exp | High |
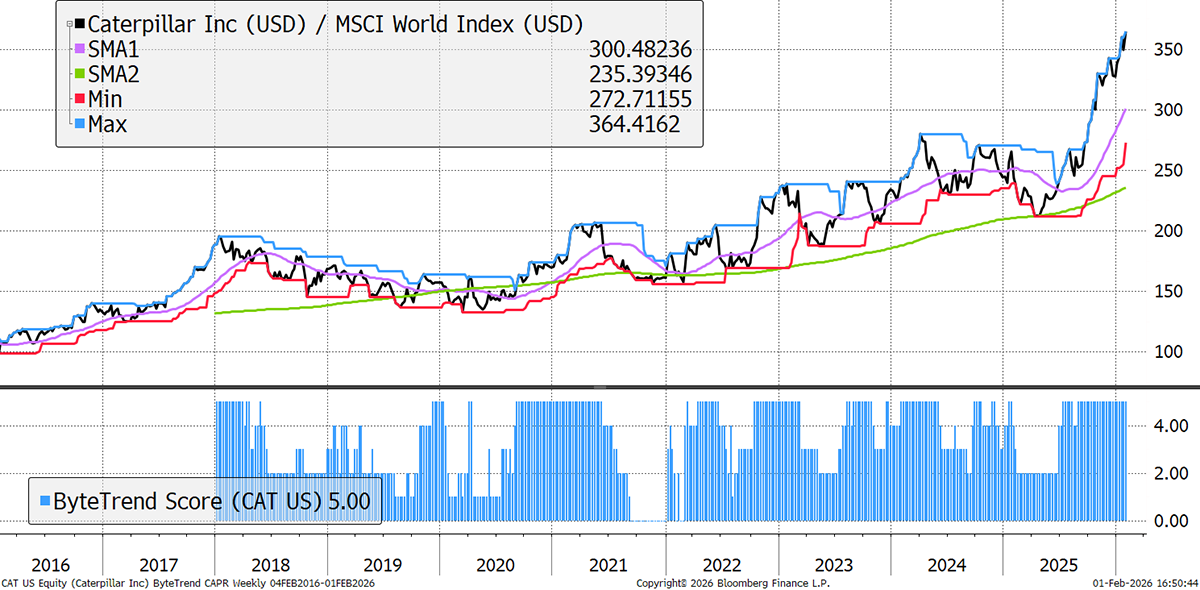
| Caterpillar Inc. | 28 | 308 | Exp | Good |
| HSBC Holdings plc | 22 | 302 | OV | High |
| PetroChina Company Limited | 25 | 292 | OV | Good |
| Lam Research Corporation | 44 | 292 | Exp | Good |
| Novartis AG | 20 | 285 | OV | Med |
| Siemens AG | 23 | 238 | OV | Good |
| China Life Insurance Company | 36 | 200 | OV | Good |
| Banco Santander, S.A. | 24 | 188 | OV | High |
| Ping An Insurance (Group) | 26 | 180 | FV | Med |
| Gilead Sciences, Inc. | 23 | 176 | OV | Neg |
| ABB Ltd | 24 | 157 | OV | High |
| Southern Copper Corporation | 37 | 156 | Exp | Good |
| Analog Devices, Inc. | 33 | 152 | OV | Med |
| Iberdrola, S.A. | 13 | 150 | OV | Good |
| Siemens Energy AG | 33 | 147 | Exp | High |
| Banco Bilbao Vizcaya Argentaria | 25 | 145 | Exp | High |
| Zijin Mining Group Company | 38 | 142 | Exp | High |
| UniCredit S.p.A. | 21 | 136 | Exp | High |
| DBS Group Holdings Ltd | 16 | 132 | OV | High |
| BNP Paribas S.A. | 25 | 121 | OV | High |
| Advantest Corporation | 71 | 120 | Exp | High |
| Investor AB (publ) | 15 | 118 | FV | Good |
| Enel S.p.A. | 13 | 111 | OV | High |
| Mizuho Financial Group, Inc. | 30 | 109 | Exp | High |
| State Bank of India | 14 | 108 | OV | High |
| Mitsubishi Corporation | 19 | 100 | Exp | Good |
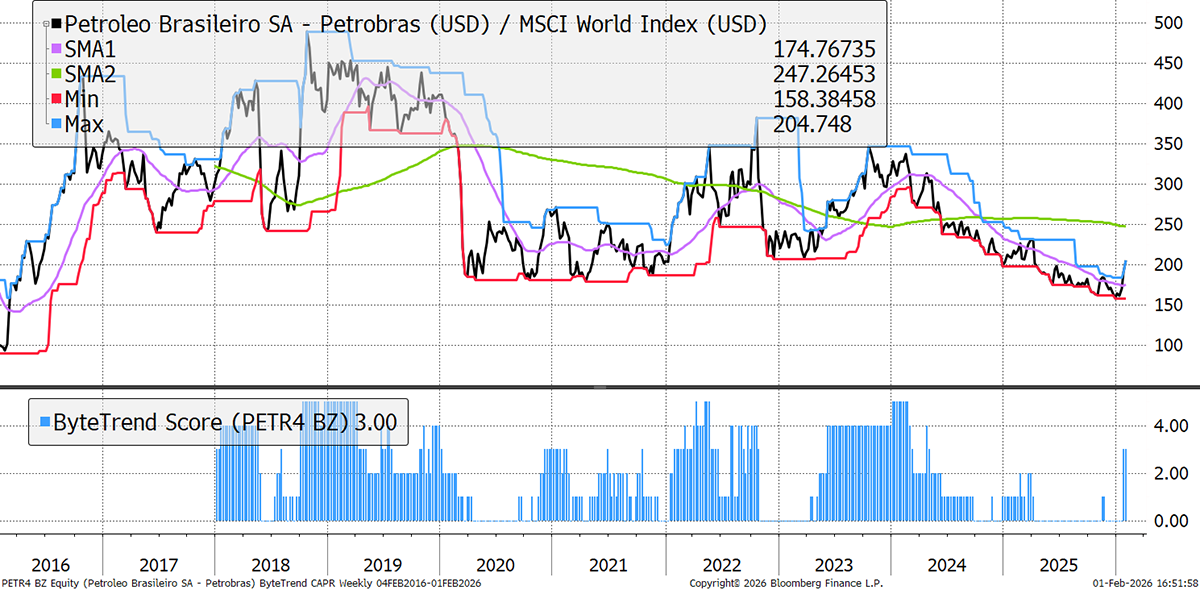
| Petróleo Brasileiro S.A. - Petrobras | 30 | 99 | FV | Neg |
| Northrop Grumman Corporation | 23 | 98 | OV | Good |
| Itaú Unibanco Holding S.A. | 22 | 95 | OV | High |
| CaixaBank, S.A. | 18 | 93 | OV | High |
| Westpac Banking Corporation | 19 | 92 | FV | Good |
| National Australia Bank Limited | 17 | 92 | OV | Good |
| Barclays PLC | 24 | 92 | OV | Good |
| MediaTek Inc. | 42 | 89 | OV | High |
| Corning Incorporated | 32 | 89 | Exp | Good |
| Lloyds Banking Group plc | 24 | 88 | OV | Good |
| Seagate Technology Holdings plc | 53 | 87 | Exp | Neg |
| Grupo México, S.A.B. de C.V. | 34 | 87 | Exp | Med |
| Western Digital Corporation | 54 | 86 | Exp | Neg |
| ING Groep N.V. | 21 | 85 | OV | Good |
| Saudi Arabian Mining Company | 29 | 80 | OV | High |
| Cummins Inc. | 23 | 80 | OV | High |
| ANZ Group Holdings Limited | 18 | 76 | FV | Good |
| AB Volvo (publ) | 27 | 74 | OV | Good |
| NatWest Group plc | 27 | 73 | OV | Good |
| Engie S.A. | 18 | 72 | OV | High |
| Société Générale S.A. | 27 | 66 | Exp | Good |
| PACCAR Inc | 25 | 65 | OV | Med |
| Manulife Financial Corporation | 15 | 64 | OV | Med |
| Suncor Energy Inc. | 22 | 63 | FV | High |
| JAPAN POST BANK Co., Ltd. | 28 | 63 | OV | Med |
| Eni S.p.A. | 17 | 60 | FV | Med |
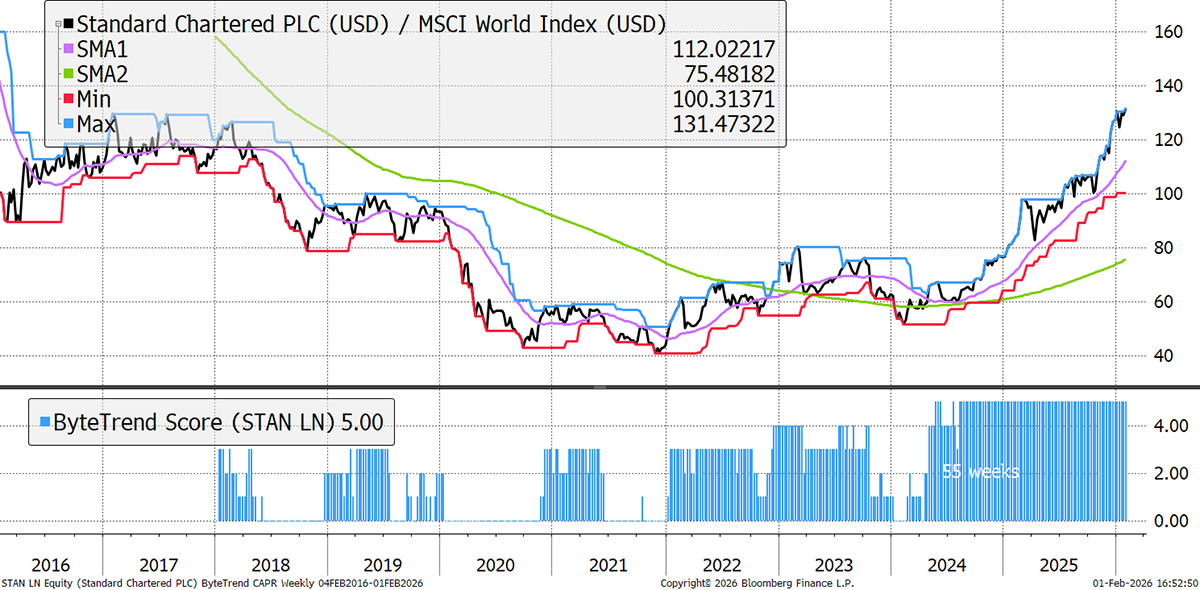
| Standard Chartered PLC | 28 | 57 | OV | High |
| Holcim Ltd | 18 | 57 | OV | Med |
| KBC Group N.V. | 19 | 56 | OV | Low |
| BOC Hong Kong | 24 | 56 | FV | Good |
| Baker Hughes Company | 32 | 55 | OV | Good |
| Marubeni Corporation | 29 | 54 | Exp | Good |
| Monolithic Power Systems, Inc. | 35 | 54 | OV | High |
| Emirates NBD Bank PJSC | 29 | 53 | OV | High |
| AMETEK, Inc. | 15 | 52 | OV | Good |
| Erste Group Bank AG | 23 | 50 | OV | High |
| Sandvik AB (publ) | 18 | 50 | OV | Good |
| Orange S.A. | 17 | 49 | OV | Med |
| Antofagasta plc | 33 | 49 | Exp | Neg |
| Sumitomo Corporation | 23 | 49 | OV | High |
| Rockwell Automation, Inc. | 17 | 47 | OV | Med |
| Hanwha Aerospace Co., Ltd. | 56 | 46 | Exp | High |
| RWE AG | 21 | 46 | OV | High |
| China Hongqiao Group Limited | 41 | 46 | Exp | Med |
| Swedbank AB (publ) | 15 | 44 | FV | High |
| Danske Bank A/S | 17 | 42 | OV | High |
| ArcelorMittal S.A. | 28 | 42 | Exp | Neg |
Caterpillar
As go the metals, so go the equipment providers. Caterpillar is a market leader in mining equipment, i.e. large vehicles and machines that are increasingly electric, autonomous, and software-enabled. Q4 sales set an all-time quarterly record with +18% YoY growth, driven by volume growth across all segments, although margins declined slightly due to tariffs. The backlog rose by 71% to record levels ($51bn).
Petrobras
Brazil is one of the world’s main growth regions for offshore oil and gas, and Petrobras recently raised its 2025 production forecast to 2.4 million barrels/day (11% YoY growth). This comes from the accelerated ramp-up of their Almirante Tamandare FPSO (Floating Production, Storage, and Offloading vessel). It plans $109bn in investment by 2030, with 70% of that going towards exploration and production.
Standard Chartered
Standard Chartered’s strength lies in its unique network spanning Asia, Africa, and the Middle East, unmatched by other network banks. It is focused on affluent clients with $1-$10 million in assets who have a lower cost to acquire and serve, and high loyalty. It reported $15bn of inflows in Q2, and another $13bn in Q3, bucking the industry trend of the last few years.
New Leading Trends
These stocks are trading at the 30-week CAPR highs with a ByteTrend Score of 5, except they are new trends this week, having previously had a score below 5. All charts shown are CAPR rebased to 100.
| Name | Annual Vol 30w | Mkt Cap $Bn | Value | Growth |
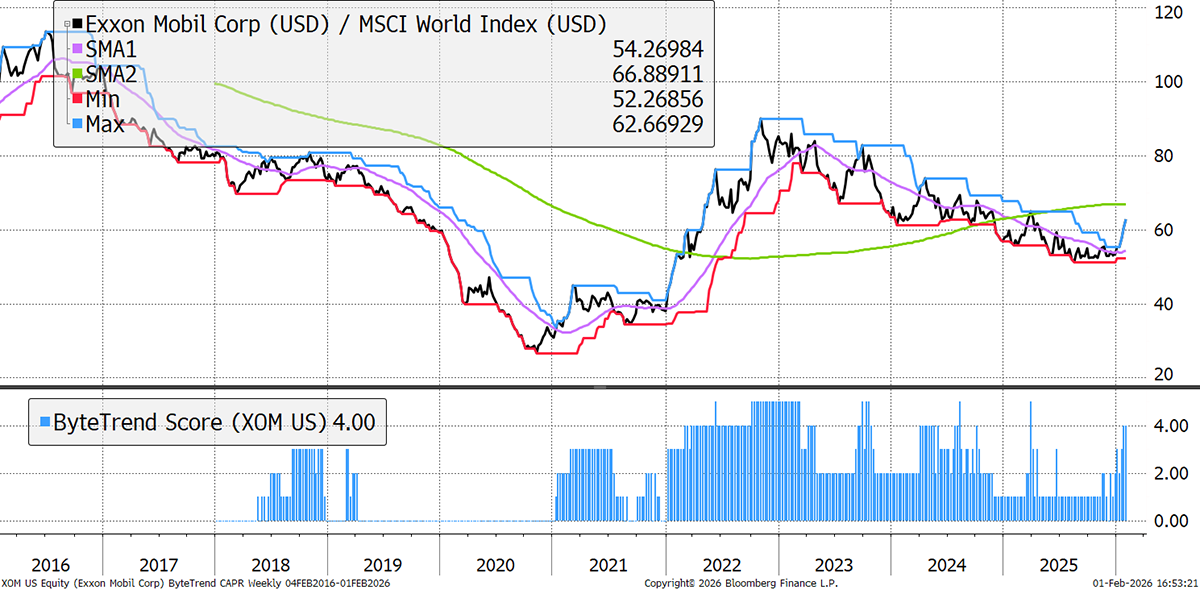
| Exxon Mobil Corporation | 21 | 597 | OV | Neg |
| Lockheed Martin Corporation | 27 | 147 | OV | Med |
| Chugai Pharmaceutical Co., Ltd. | 39 | 94 | OV | Good |
| The Williams Companies, Inc. | 23 | 82 | Exp | Med |
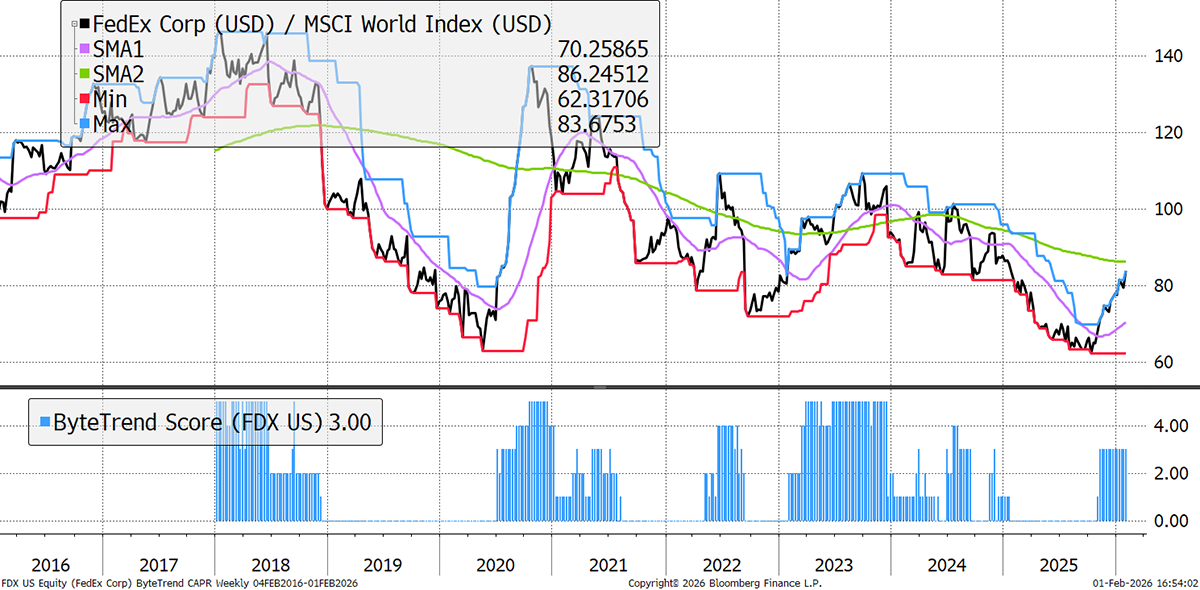
| FedEx Corporation | 29 | 76 | FV | Med |
| Crédit Agricole S.A. | 21 | 66 | OV | Good |
| E.on Se | 16 | 55 | OV | High |
| Sun Hung Kai Properties Limited | 27 | 47 | FV | High |
| Targa Resources Corp. | 28 | 43 | Exp | Med |
| Swisscom AG | 13 | 42 | FV | Neg |
Exxon
Oil major Exxon follows the oil price closely. It looks like a breakout, and oil has many reasons to go higher, but Trump can move the markets with 140 characters, adding uncertainty to any move. Exxon reported its highest annual output in 40 years in 2025, driven by record upstream production from assets in the Permian basin (US shale) and Guyana (offshore).
FedEx
The automation of delivery is moving fast, as UPS announced 30k in job cuts, and Amazon followed suit with 16k. Drones for last-mile delivery and robots in the warehouses may not be good for the labour market, but for customers and FedEx shareholders, lower costs and higher speed are positive. It is spinning off its freight business in mid-2026.
Emerging Trends
These stocks are trading at the 30-week CAPR highs with a ByteTrend Score of less than 5. They don’t have to be in an uptrend, just emerging. All charts shown are CAPR rebased to 100.
| Name | Annual Vol 30w | Mkt Cap $Bn | Value | Growth |
| Johnson & Johnson | 18 | 548 | OV | Good |
| Roche Holding AG | 30 | 361 | FV | Low |
| Chevron Corporation | 20 | 354 | OV | Neg |
| BHP Group Limited | 22 | 179 | OV | Neg |
| TotalEnergies SE | 19 | 157 | FV | Med |
| Rio Tinto Group | 18 | 150 | OV | Neg |
| AIA Group Limited | 27 | 121 | FV | Med |
| China Petroleum & Chemical Corporation | 22 | 114 | OV | Neg |
| GSK plc | 22 | 104 | FV | Low |
| BP p.l.c. | 22 | 98 | OV | Med |
| U.S. Bancorp | 20 | 87 | FV | Med |
| The PNC Financial Services Group, Inc. | 21 | 87 | FV | Med |
| National Grid plc | 12 | 84 | OV | Good |
| Canadian Natural Resources Limited | 24 | 77 | OV | Med |
| The Saudi National Bank | 24 | 71 | FV | Good |
| DSV A/S | 25 | 66 | OV | Med |
| Truist Financial Corporation | 19 | 66 | FV | Med |
| TC Energy Corporation | 17 | 61 | OV | High |
| Reckitt Benckiser Group plc | 19 | 56 | FV | Med |
| Takeda Pharmaceutical Company Limited | 19 | 54 | FV | Neg |
| Bayer AG | 37 | 52 | FV | Neg |
| Anglo American plc | 30 | 50 | Exp | Neg |
| Diamondback Energy, Inc. | 25 | 47 | Val | Med |
| Ambev S.A. | 22 | 44 | Val | Good |
| Banco Bradesco S.A. | 24 | 43 | FV | Good |
| Prudential plc | 17 | 42 | OV | High |
| WEG S.A. | 36 | 41 | FV | High |


