
Mind the Gap


Issue 52;
- A clear divergence between market leaders and laggards is opening up.
- Industry is strong, while Defensives reawaken. Mexico surges.
- Software throws in the towel.
Global Trends is a deep dive into global equities. The aim of this analysis is to better understand which countries, sectors, industries, and stocks are driving market returns. Not only does it help investors identify opportunities, but it also highlights the risks. We try to condense as much important information as possible, focusing on what really matters each week. Embrace this as a weekly discipline, and you’ll soon have a much better understanding of global financial markets.
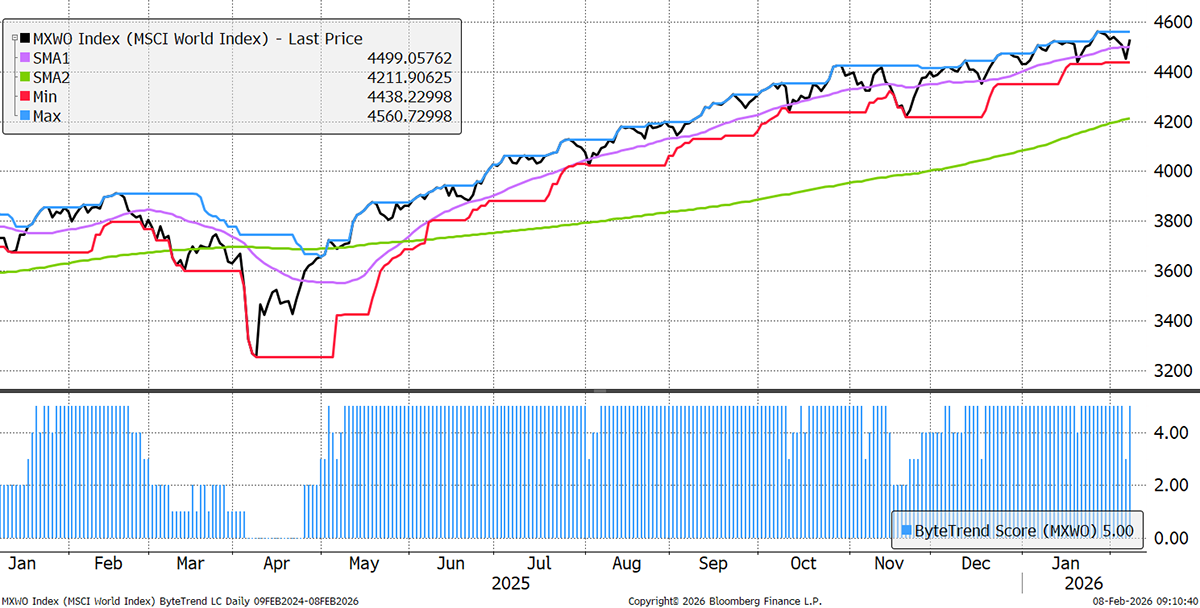
The World Index retains a ByteTrend Score of 5 in USD, having dipped two points on Thursday. This is a Teflon market.
World Index – Developed Markets – Daily
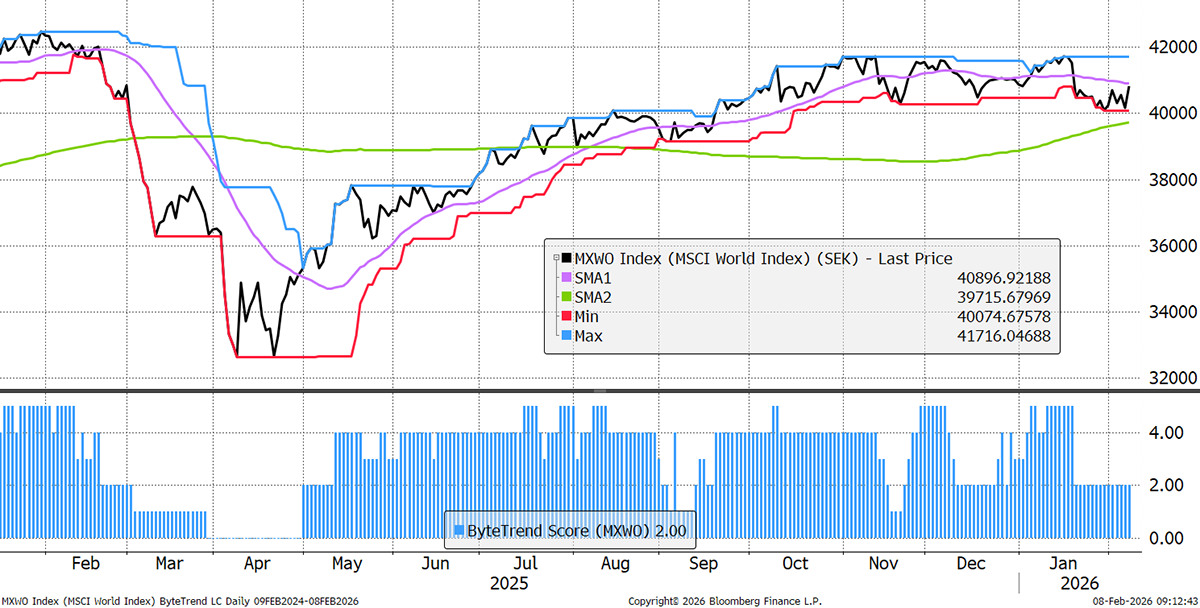
To illustrate the importance of the weak dollar, I show the world in SEK, the strongest currency over the past year. The ByteTrend Score drops to a 2, highlighting that the tailwind is achieved by measuring the trend in a weak currency.
World Index – Developed Markets – Daily in SEK
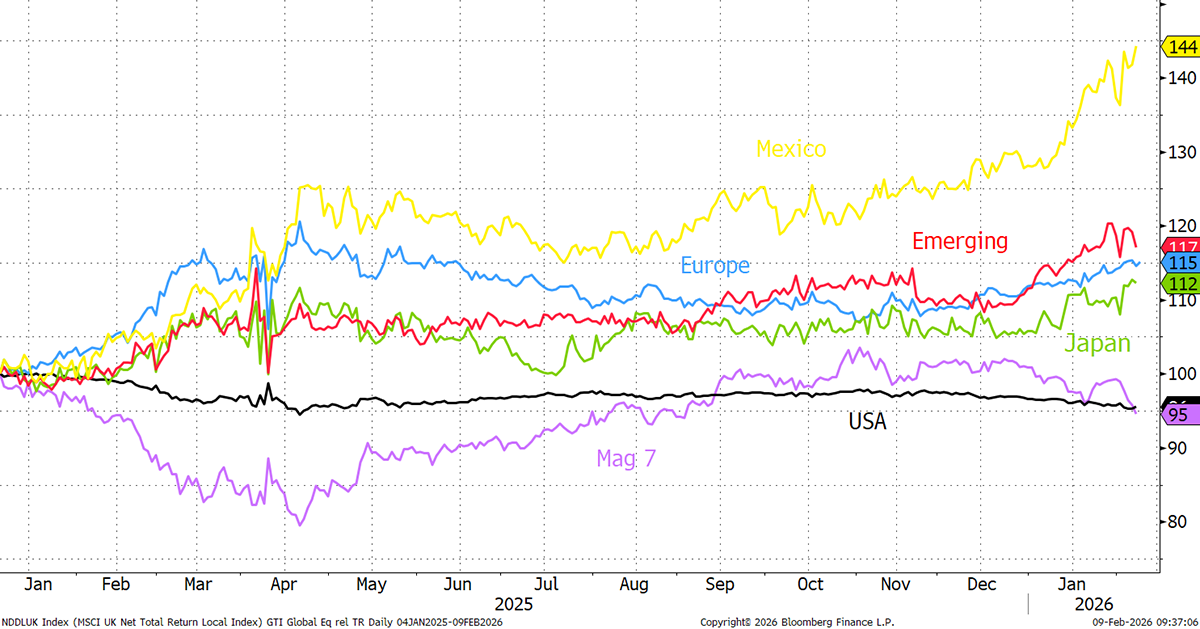
World Regional Performance
Over the past year, Emerging Markets, Europe, and Japan continue to lead. The US and the seven largest technology stocks now lag. Mexico is riding high.
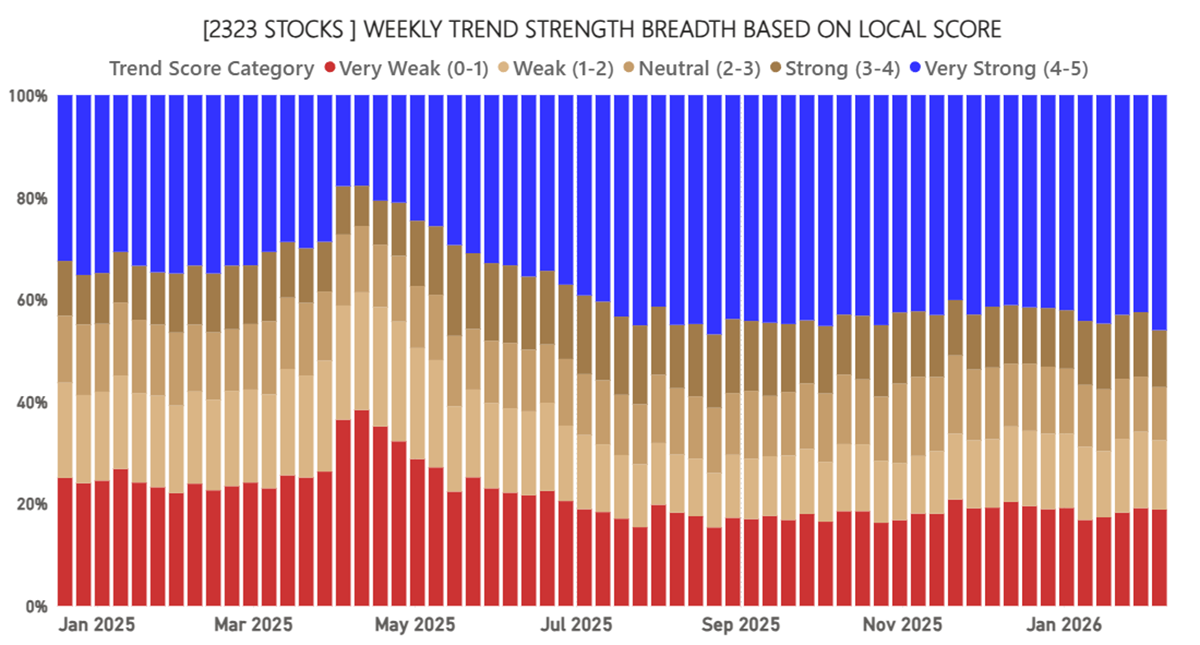
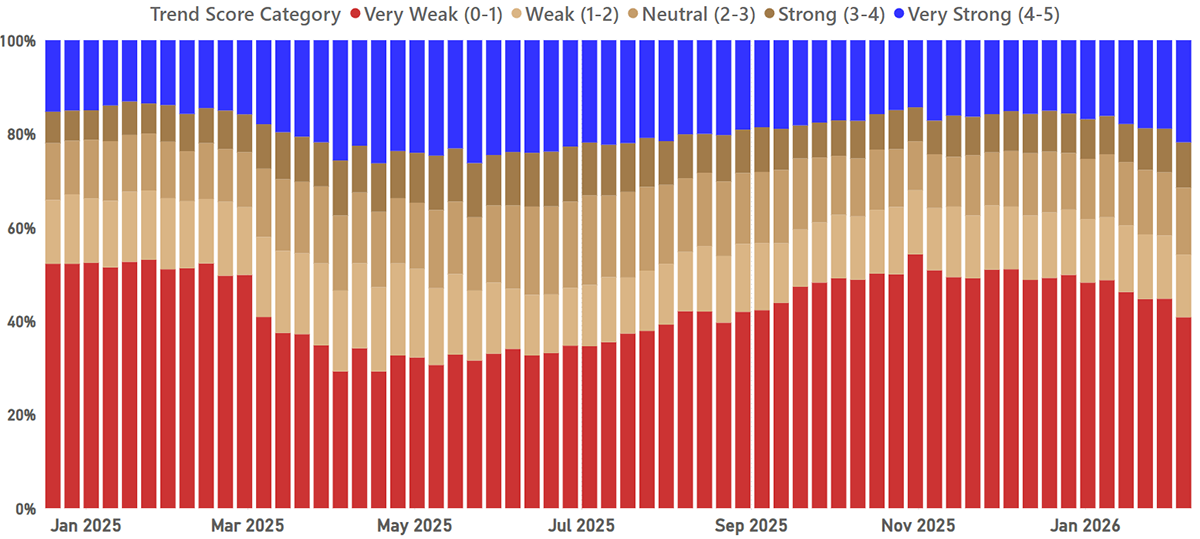
Global Equity Breadth
Despite the shake-out in the technology sector last week, global breadth increased, which is remarkable. Notably, 55% of stocks are in price uptrends.
Global Equity Breadth – CAPR
As the US and large stocks turn down, the opportunity for more stocks to outperform grows. Alpha has been thin on the ground since late 2025, but the opportunity set is expanding. Active managers, step up.
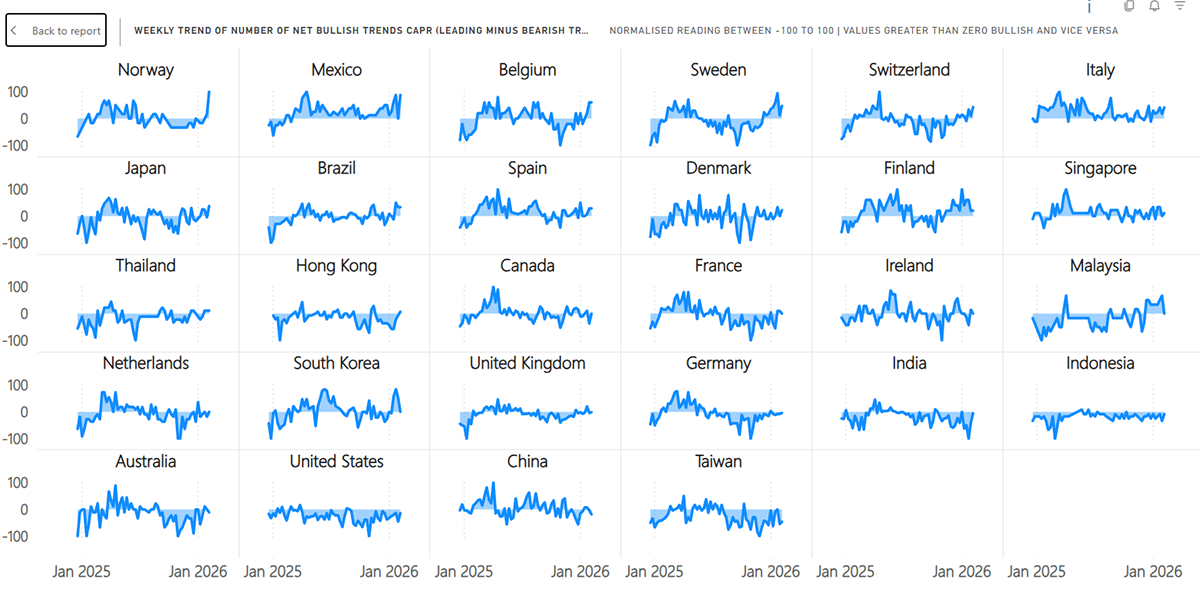
Country Classification Changes
There are 15 Norwegian companies in our universe, of which 10 have a local score of 5. Other European nations are strong, along with Mexico, Brazil, and Japan. The US, China, and Taiwan lagged in the tech crash.
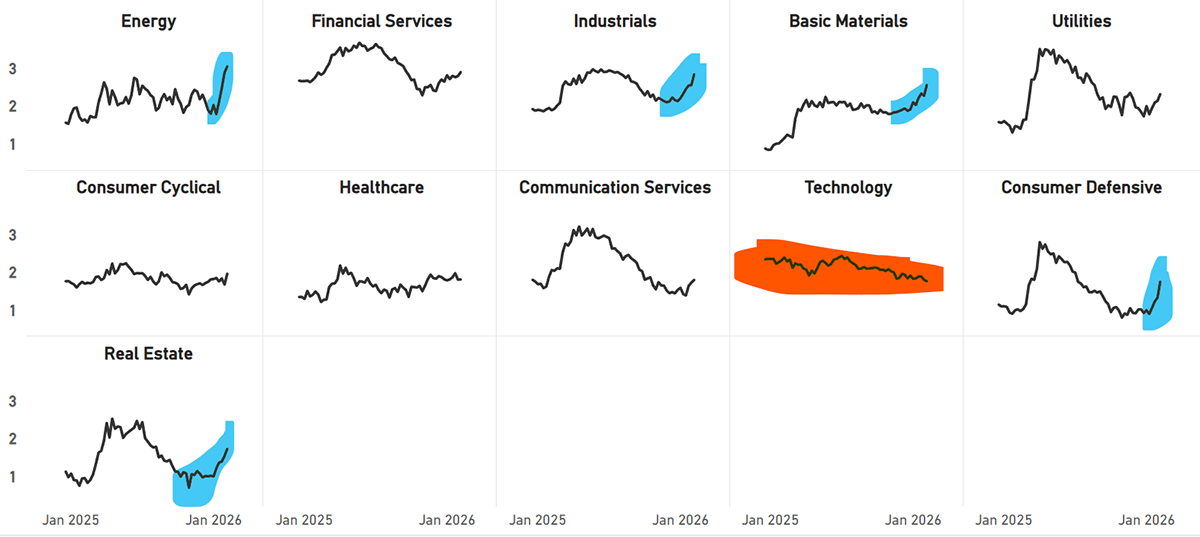
Sector Trends in CAPR
Energy, Industrials, and Materials are strong, and have recently been joined by Defensives and Real Estate. The remaining value in this bull market is finally being unlocked. Tech is weak.
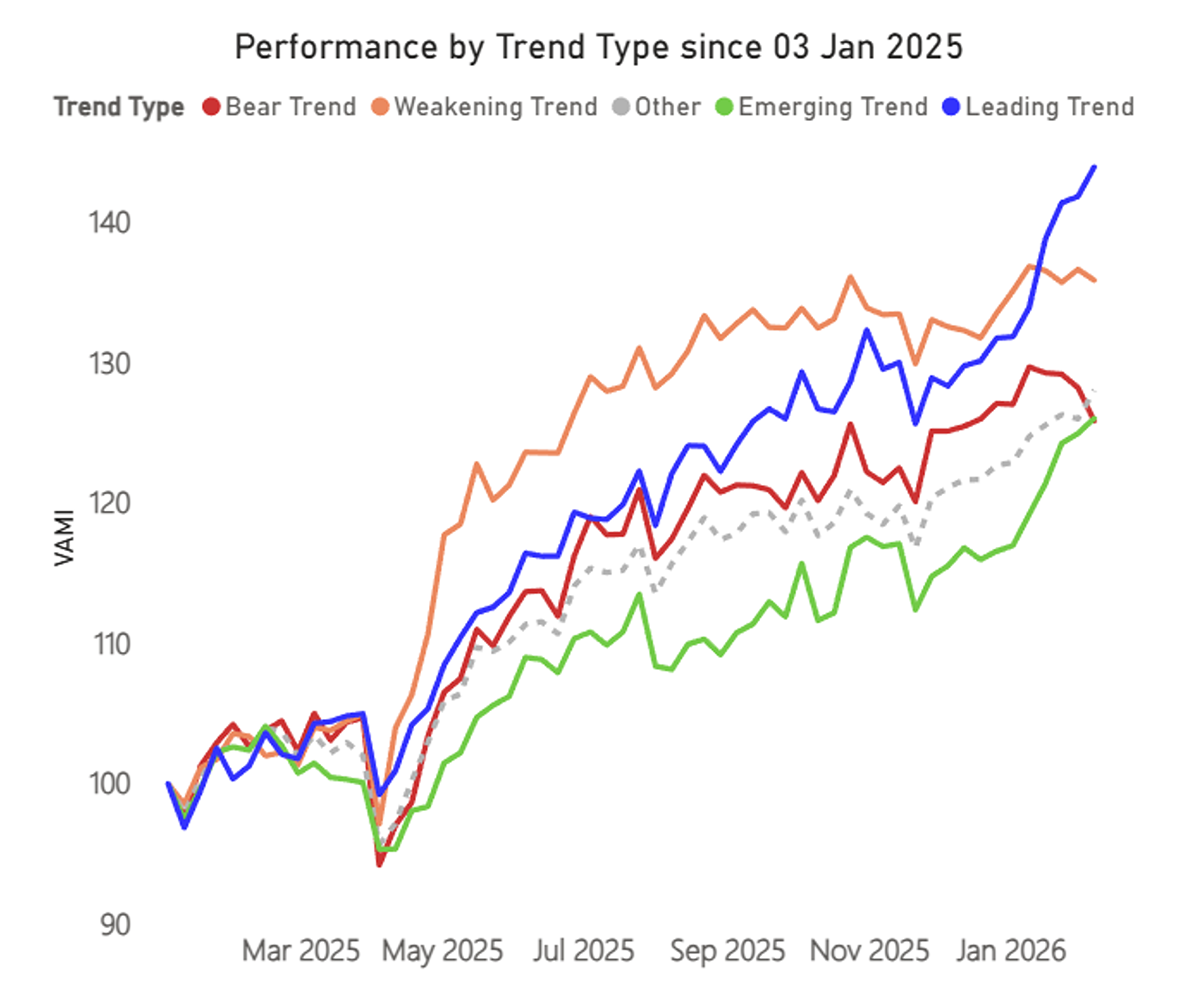
Performance by Trend Type
Most importantly, this week has seen a dispersion open up between the winners and the losers for the first time in a year. This is late-cycle behaviour. A future bear market will need a weak group, which has come. The strength of the leadership will eventually snap when this divergence becomes too wide. Enjoy it while it lasts.
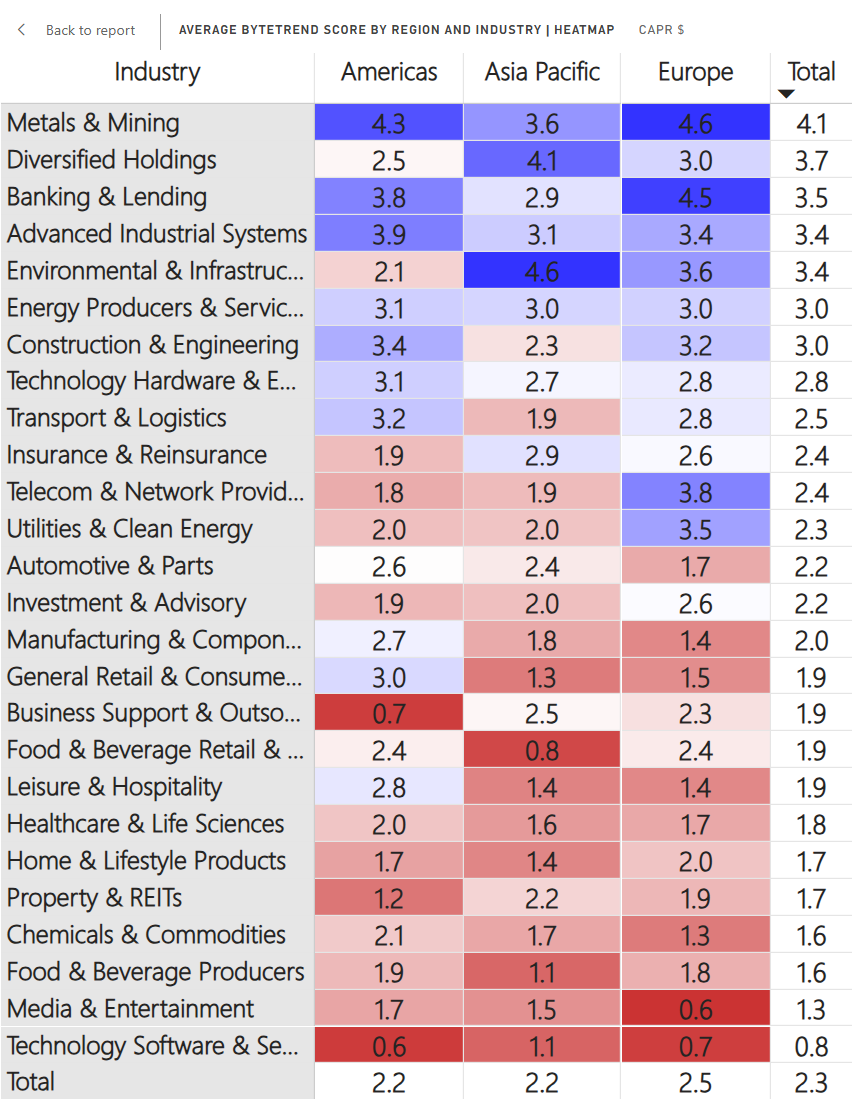
Regions and Industries Average CAPR Score
Software has been falling down the table for weeks, and last week it hit the headlines. It is rock bottom, now by a wide margin. Media and Entertainment stocks continued to slide, as they have ever since the Netflix vs. Comcast battle over Warner Bros. began. Advanced industrials also gave up ground, as they are connected to the AI trade, which is driving big tech lower.
Food and Beverage producers and retailers strengthened notably, as reliable trumped remarkable in investors’ worried minds. Home and Lifestyle products rose too, for similar reasons. Manufacturing in the Americas was also strong, as were Chemicals/Commodities in Europe, and Transport/Logistics everywhere. Metals and Mining strengthened even further, with Asia now joining in too.
The Value Composite Score (Value) is measured against the company’s own financial history and not in absolute terms. The columns are Cheap (Chp), Value (Val), Fair Value (FV), Overvalued (OV), and Expensive (Exp). The Growth Composite Score (Growth) is measured by sales, earnings cash flow, dividends, and book value on a per share basis. The columns are High, Good, Medium (Med), Low, and Negative (Neg).
Leading Trends with New Highs
These stocks are trading at the 30-week CAPR highs with a ByteTrend Score of 5. All charts shown are CAPR rebased to 100.
| Name | Annual Vol 30w | Mkt Cap $Bn | Value | Growth |
| Walmart Inc. | 23 | 1046 | Exp | Med |
| Exxon Mobil Corporation | 21 | 628 | OV | Neg |
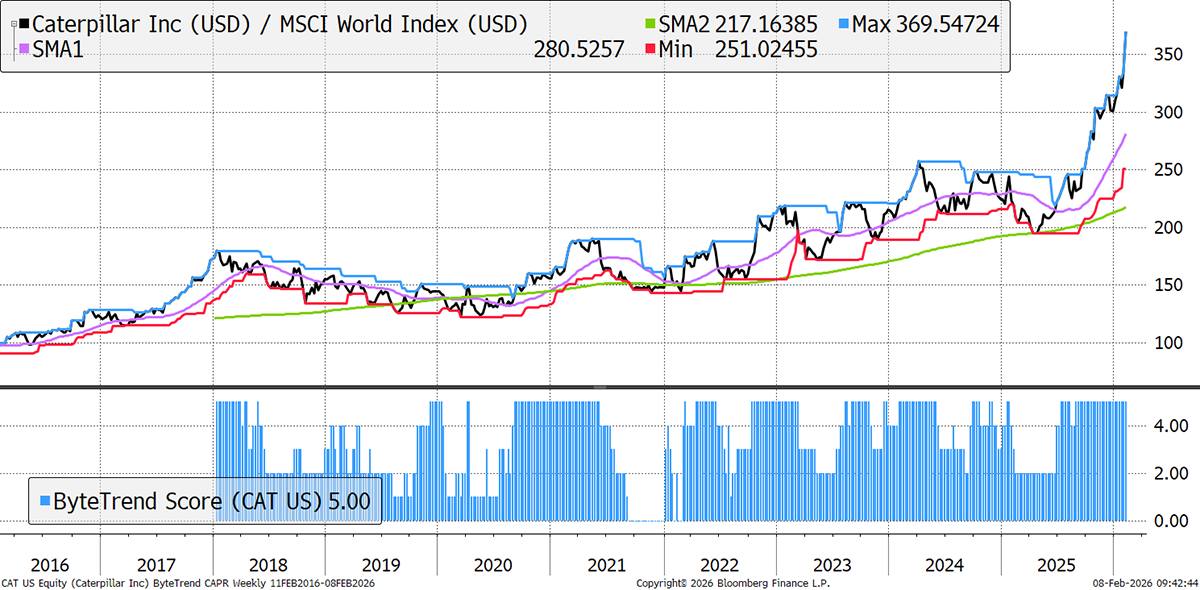
| Caterpillar Inc. | 30 | 340 | Exp | Good |
| Cisco Systems, Inc. | 26 | 335 | OV | Low |
| HSBC Holdings plc | 22 | 305 | OV | High |
| Novartis AG | 20 | 295 | OV | Good |
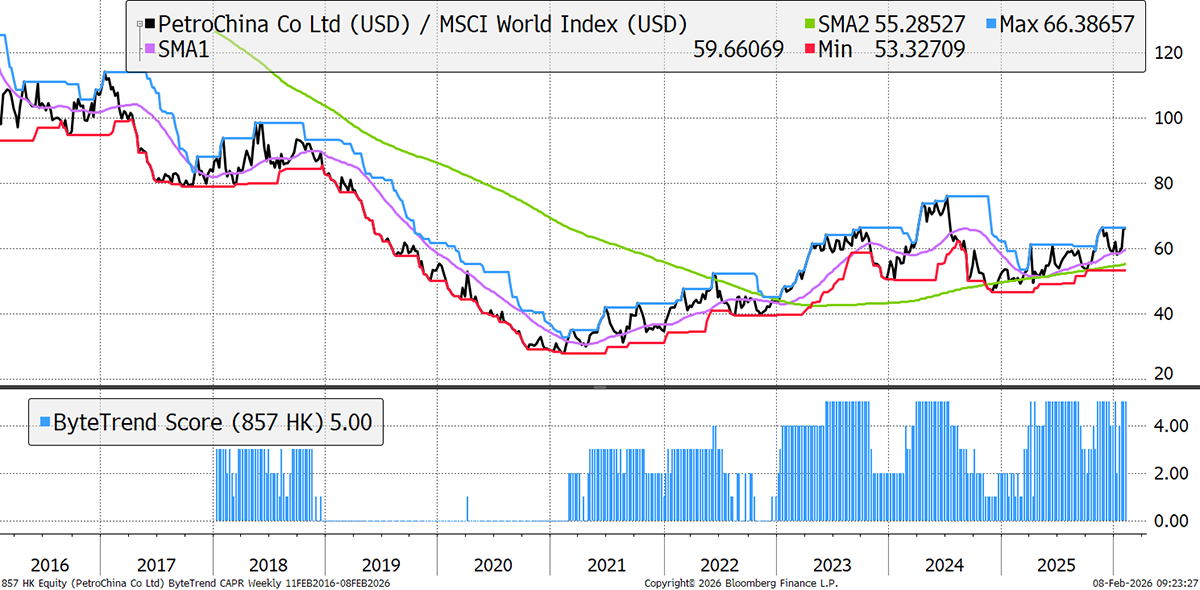
| PetroChina Company Limited | 25 | 292 | FV | Good |
| Citigroup Inc. | 24 | 219 | FV | Good |
| GE Vernova Inc. | 37 | 211 | OV | Med |
| Industria de Diseño Textil, S.A. | 29 | 210 | OV | Good |
| Gilead Sciences, Inc. | 25 | 189 | OV | Neg |
| Southern Copper Corporation | 36 | 164 | Exp | Good |
| ABB Ltd | 24 | 157 | OV | High |
| Analog Devices, Inc. | 33 | 157 | OV | Med |
| Iberdrola, S.A. | 13 | 155 | OV | Good |
| Siemens Energy AG | 33 | 154 | Exp | High |
| Sumitomo Mitsui Financial Group | 28 | 144 | OV | High |
| British American Tobacco p.l.c. | 20 | 136 | OV | Med |
| UniCredit S.p.A. | 21 | 136 | Exp | High |
| DBS Group Holdings Ltd | 16 | 132 | OV | High |
| Fast Retailing Co., Ltd. | 32 | 124 | OV | Good |
| Parker-Hannifin Corporation | 20 | 123 | Exp | Good |
| Investor AB (publ) | 16 | 123 | FV | Good |
| BNP Paribas S.A. | 25 | 123 | OV | Good |
| Investor AB (publ) | 16 | 122 | FV | Good |
| McKesson Corporation | 28 | 117 | OV | High |
| Mizuho Financial Group, Inc. | 31 | 115 | Exp | High |
| Enel S.p.A. | 12 | 112 | OV | High |
| Mitsubishi Corporation | 26 | 111 | Exp | Good |
| State Bank of India | 14 | 109 | OV | High |
| Corning Incorporated | 38 | 105 | Exp | Good |
| Northrop Grumman Corporation | 23 | 101 | OV | Good |
| Itaú Unibanco Holding S.A. | 19 | 98 | OV | High |
| Western Digital Corporation | 55 | 96 | Exp | Neg |
| Westpac Banking Corporation | 19 | 95 | OV | Good |
| Seagate Technology Holdings plc | 53 | 94 | Exp | Neg |
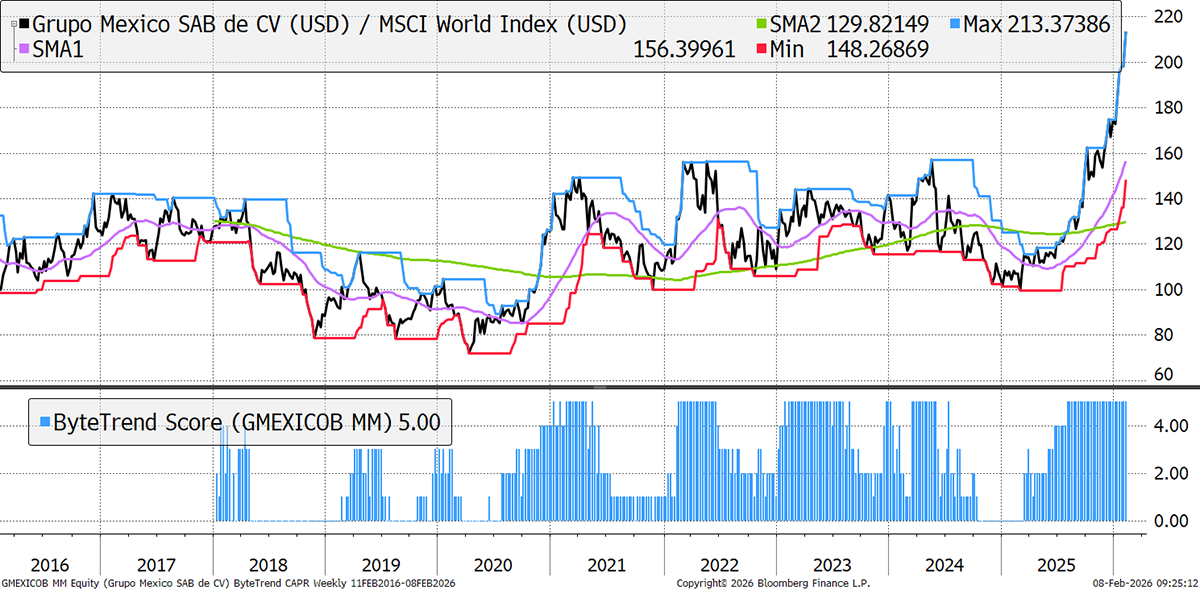
| Grupo México, S.A.B. de C.V. | 34 | 93 | OV | Med |
| National Australia Bank Limited | 17 | 93 | OV | Good |
| Canadian Imperial Bank of Commerce | 14 | 90 | OV | Good |
| Marriott International, Inc. | 27 | 89 | OV | High |
| FedEx Corporation | 34 | 87 | OV | Med |
| ING Groep N.V. | 21 | 87 | OV | Good |
| The Bank of New York Mellon | 17 | 87 | OV | High |
| Monster Beverage Corporation | 20 | 81 | FV | Good |
| General Motors Company | 32 | 79 | FV | High |
| AB Volvo (publ) | 28 | 78 | OV | Good |
| ANZ Group Holdings Limited | 18 | 78 | FV | Good |
| Quanta Services, Inc. | 27 | 76 | Exp | High |
| Engie S.A. | 17 | 74 | OV | High |
| Mitsubishi Electric Corporation | 30 | 71 | Exp | Good |
| Japan Tobacco Inc. | 21 | 68 | OV | Med |
| Nordea Bank Abp | 16 | 68 | FV | Good |
| PACCAR Inc | 25 | 67 | OV | Med |
| JAPAN POST BANK Co., Ltd. | 29 | 67 | OV | Med |
| Simon Property Group, Inc. | 17 | 65 | FV | Good |
| Suncor Energy Inc. | 21 | 65 | OV | Neg |
| Manulife Financial Corporation | 14 | 64 | OV | Med |
| Valero Energy Corporation | 36 | 63 | OV | Neg |
| Eni S.p.A. | 17 | 62 | OV | Med |
| Marubeni Corporation | 31 | 59 | Exp | Good |
| Monolithic Power Systems, Inc. | 35 | 59 | OV | High |
| Emirates NBD Bank PJSC | 31 | 59 | OV | High |
| Baker Hughes Company | 33 | 58 | OV | Good |
| Standard Chartered PLC | 27 | 58 | OV | High |
| BOC Hong Kong (Holdings) Limited | 22 | 57 | FV | Good |
| KBC Group N.V. | 19 | 56 | OV | Low |
| AMETEK, Inc. | 15 | 54 | OV | Good |
| Cardinal Health, Inc. | 30 | 53 | OV | Low |
| AngloGold Ashanti Plc | 42 | 53 | Exp | High |
| Orange S.A. | 18 | 52 | OV | Med |
| Sandvik AB (publ) | 19 | 52 | OV | Good |
| Ferguson plc | 29 | 51 | OV | Med |
| Ferrovial SE | 18 | 51 | OV | High |
Caterpillar
As metal prices soar, buyers of mining equipment are increasingly flush with cash, supporting demand for the highest-quality machines from Caterpillar. Late January results showed that Q4 sales set an all-time quarterly record, with 18% YoY growth driven by all segments. The hit from tariffs was less than expected, as volume growth offset the worst of it. The backlog grew 71% to $51 billion, a record level, and its fleet of operating autonomous haul trucks reached 827.
PetroChina
A steady five-year outperformance is not what you would expect from PetroChina, given the weak oil price of recent years. State-backed, it makes hefty dividend payments, while domestic gas demand has grown at 10% annually. It also has no qualms about profiting from refining discounted Russian gas, putting it at an advantage over Western rivals.
Grupo Mexico
Results in January showed revenues grew 12%, with rising margins, driven by all divisions at Grupo Mexico, a leading Mexican conglomerate focused on mining. As the 90% owner of Southern Copper, it is one of the world’s largest producers, and with AI and electrification, demand growth and supply shortage fears are driving its price higher.
New Leading Trends
These stocks are trading at the 30-week CAPR highs with a ByteTrend Score of 5, except they are new trends this week, having previously had a score below 5. All charts shown are CAPR rebased to 100.
| Name | Annual Vol 30w | Mkt Cap $Bn | Value | Growth |
| Toyota Motor Corporation | 27 | 313 | OV | High |
| Amgen Inc. | 29 | 207 | OV | Med |
| Chubb Limited | 18 | 130 | FV | Good |
| The PNC Financial Services Group | 23 | 95 | FV | Med |
| Johnson Controls International plc | 31 | 84 | Exp | Med |
| Hilton Worldwide Holdings Inc. | 20 | 73 | OV | High |
| DSV A/S | 26 | 70 | FV | Neg |
| Phillips 66 | 31 | 64 | OV | Neg |
| Loblaw Companies Limited | 21 | 58 | Exp | Med |
| W.W. Grainger, Inc. | 27 | 57 | OV | Med |
| Imperial Oil Limited | 32 | 56 | OV | Neg |
| DNB Bank ASA | 14 | 44 | FV | High |
| Carnival Corporation & plc | 40 | 43 | FV | High |
| Vulcan Materials Company | 17 | 43 | FV | Good |
| Westinghouse Air Brake Technologies | 22 | 42 | OV | Good |
| Keysight Technologies, Inc. | 31 | 40 | OV | Med |


