
US and European Real Estate Diverge


Issue 4;
No one is talking about the weakness in US real estate, which has been lagging for a decade, but mainly since the pandemic. Real estate doesn’t like higher rates, but still, the last time it was this low was in 1999, when growth peaked. It was the great switch from growth that made real estate a top performer until the credit crisis.
US REITS CAPR since 1992
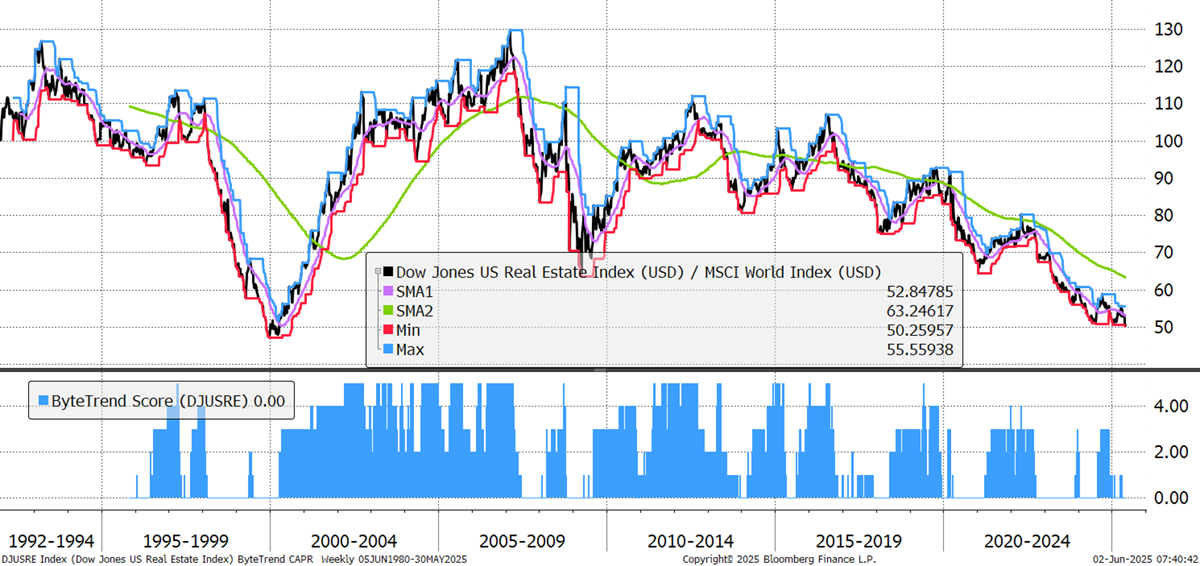
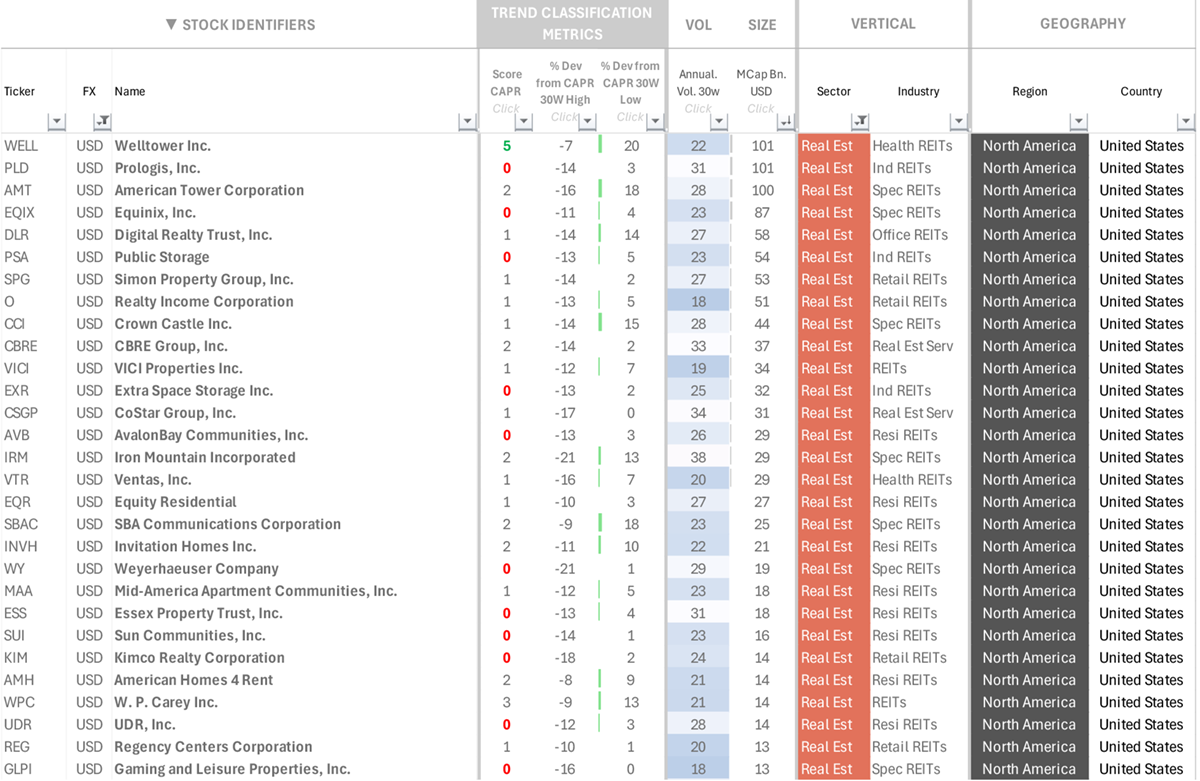
Looking at the top stocks, only Welltower, an assisted living company, has a ByteTrend score of 5. For the rest, it’s a pack of 0s, 1s and 2s. Costar keeps appearing on the Weakening list, but there weren’t many other 30-week CAPR lows in US REITs last week.
Largest US REITS
Compare that with Europe. The EPRA Europe REIT Index is turning up with a ByteTrend score of 3 compared to the 0 score in the USA. Some of this will be currency-related, but European real estate is in better health.
Pan European REITS – 10 years
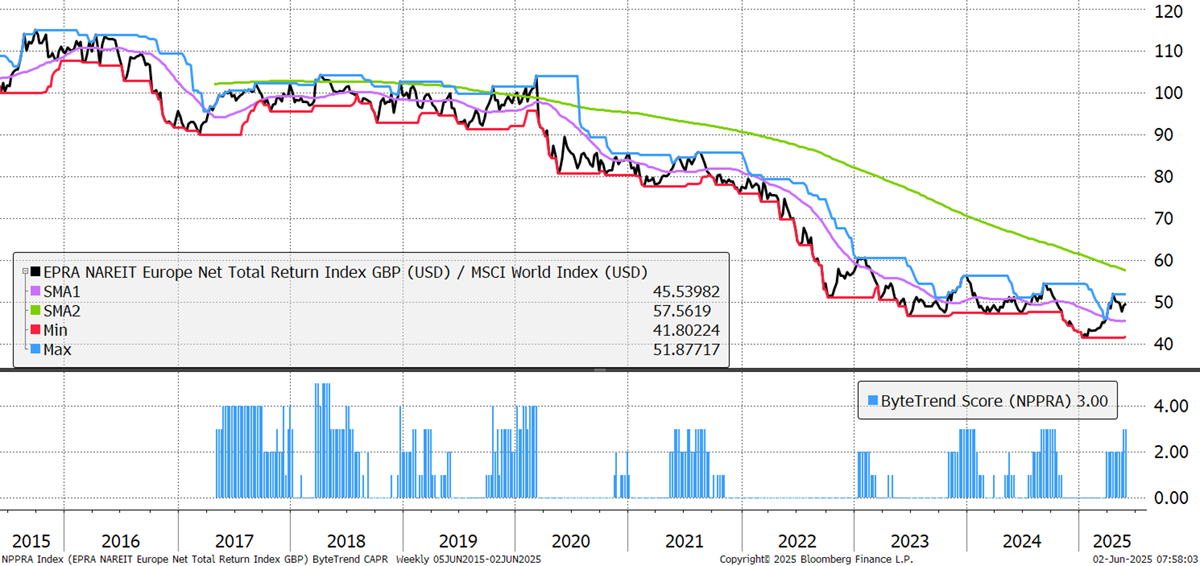
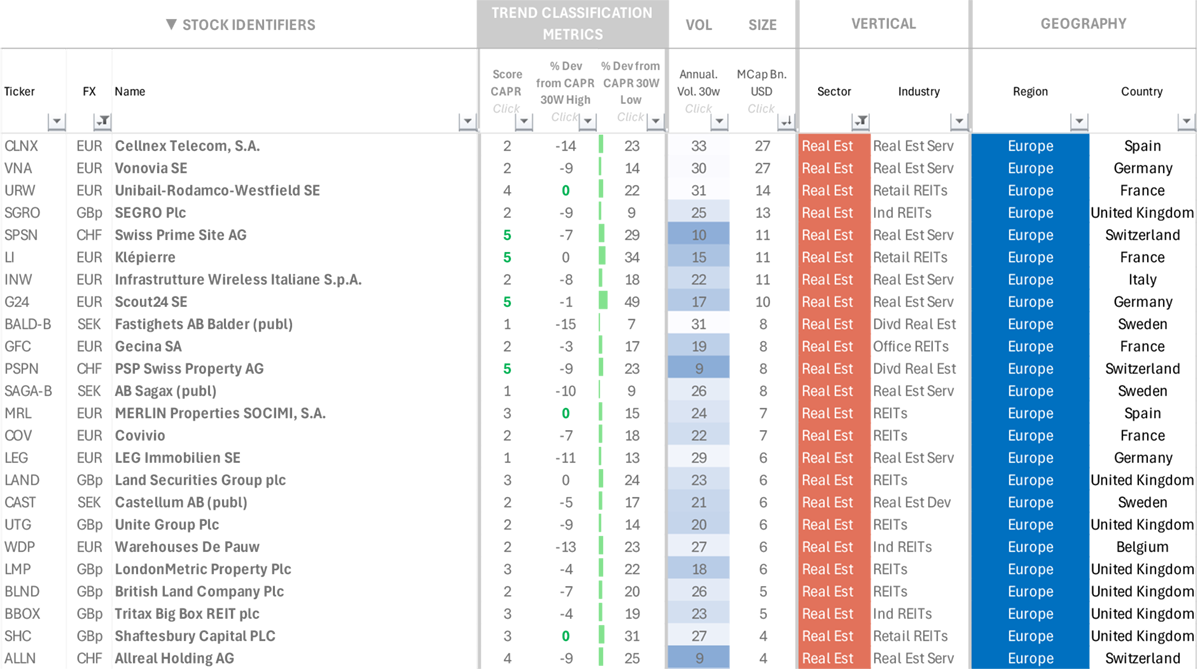
Swiss Prime, Klepiere, Scout24 and PSP Swiss Property have ByteTrend scores of 5. The euro, pound, franc and krona are not the US dollar, which continues to weaken. This would help to explain some of the gap between European and US real estate. There are also the interest rates, which are lower in Europe. Perhaps the economy isn’t quite as bad as people think.
European Real Estate
To make a similar comparison, select the sector “real estate” and use the FX column to choose your currency or, alternatively, the country or region. You should then sort by trend strength (%Dev from CAPR 30W Low – descending or %Dev from CAPR 30W High – ascending), or Score CAPR. You could also sort by volatility or size to find the more stable and liquid stocks.
If you have any questions, please leave a comment below or write to us at gti@bytetree.com. Please note this is a spreadsheet. Any questions or issues related to improving Microsoft Excel should be addressed to Bill Gates.


