
A Bull Market with Narrow Leadership


Issue 62;
- Breadth divergence as a few stocks drive the market.
- The US outperforms, with Europe and Japan lagging, while EM holds.
- Chips and Energy win while Health and the Consumer lose.
Global Trends is a deep dive into global equities. The aim of this analysis is to better understand which countries, sectors, industries, and stocks are driving market returns. Not only does it help investors identify opportunities, but it also highlights the risks. We try to condense as much important information as possible, focusing on what really matters each week. Embrace this as a weekly discipline, and you’ll soon have a much better understanding of global financial markets.
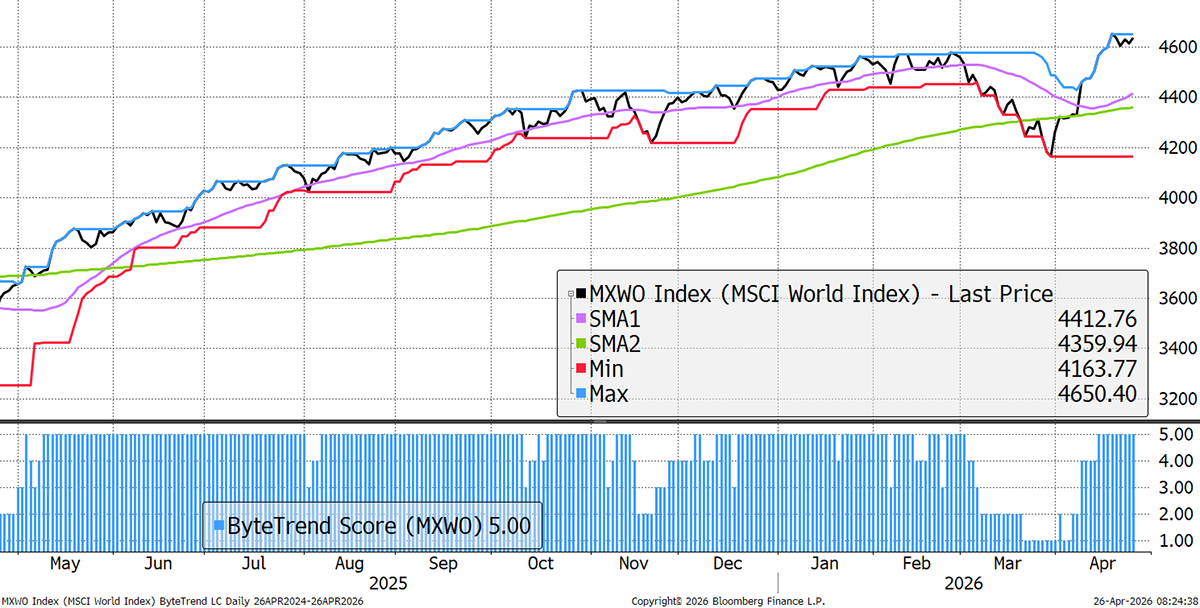
The World Index maintains a ByteTrend Score of 5 in USD, with a recent high recorded.
World Index – Developed Markets – Daily
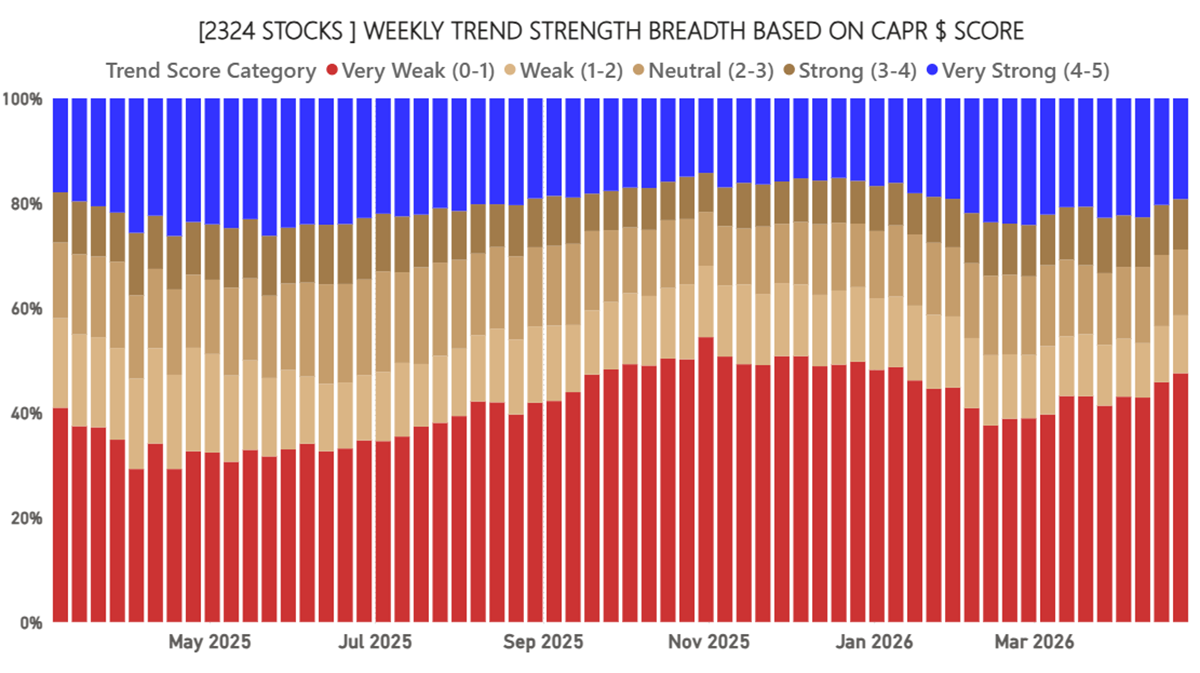
Global Equity Breadth – CAPR
I normally show this chart in local currency to gauge the strength of the market. Breadth is marginally lower than last week. This week, I instead highlight breadth in CAPR. We are back to a market with a few winners and many losers. Notably, 47.5% of all stocks are in relative downtrends, and just 19.5% in uptrends, making this market hard to outperform. Alpha opportunities are thin. I suspect it was like this in 1999.
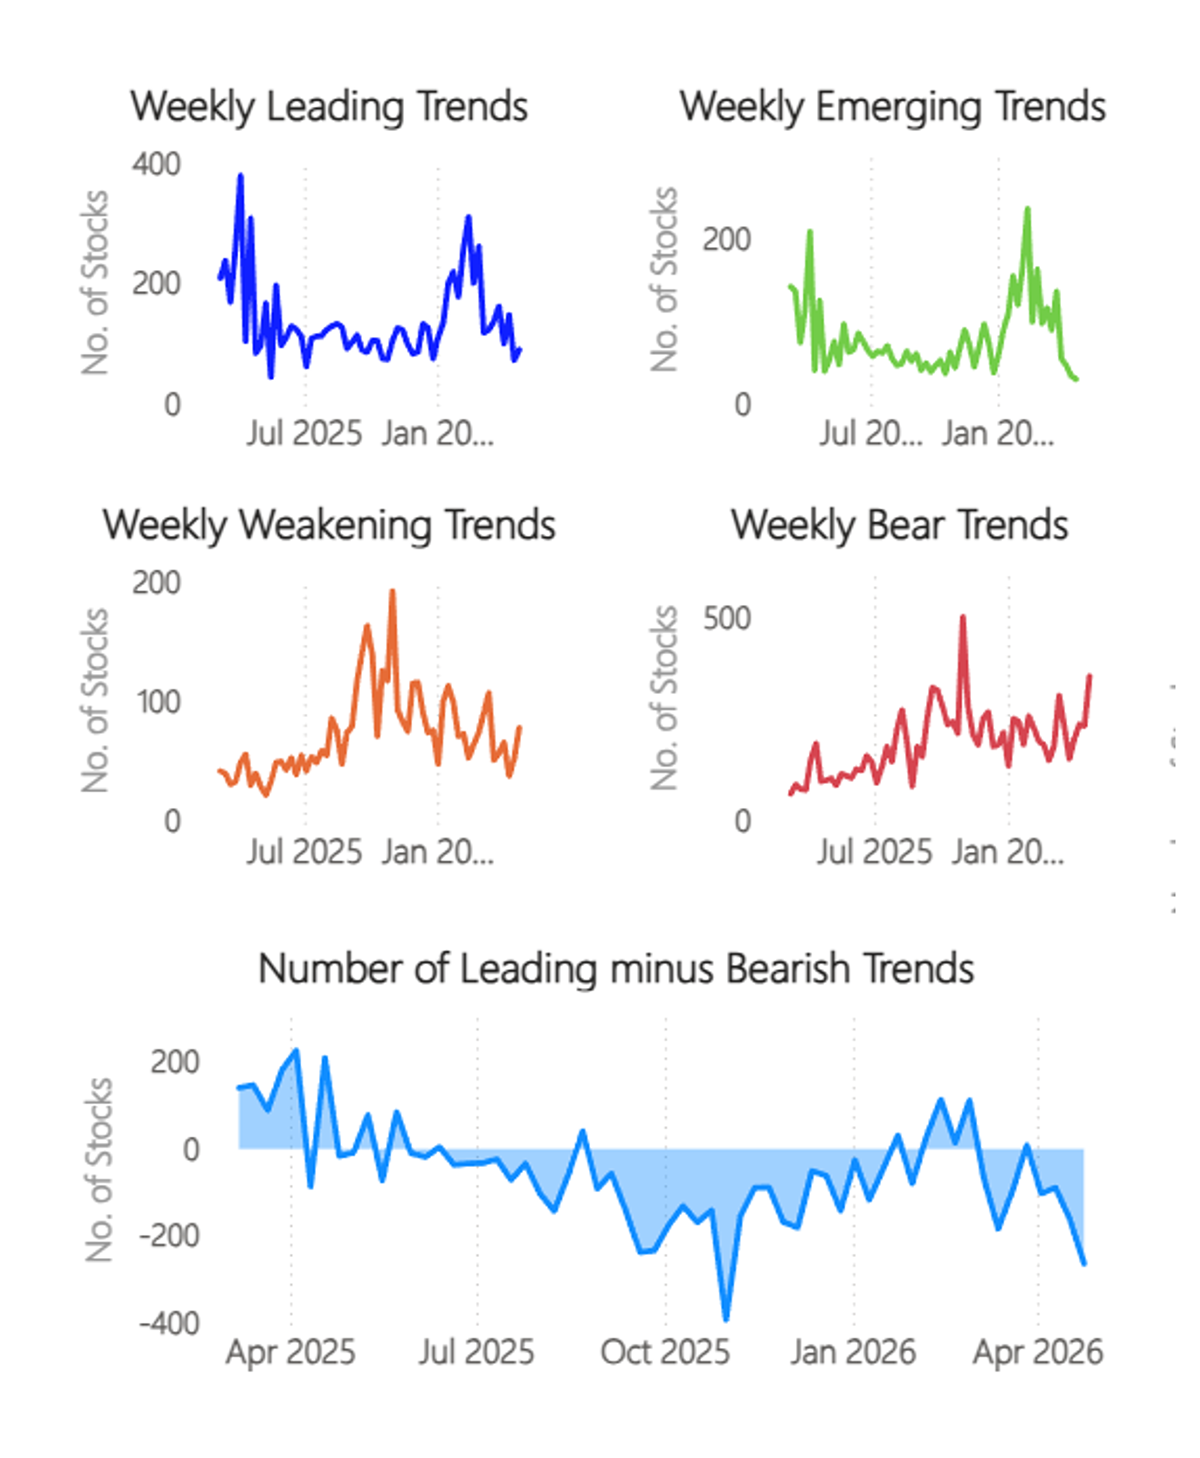
Explosion in Bear Trends
I can make that same point another way. There are a few leaders and many bear trends. The lower blue chart shows this as a timeline.
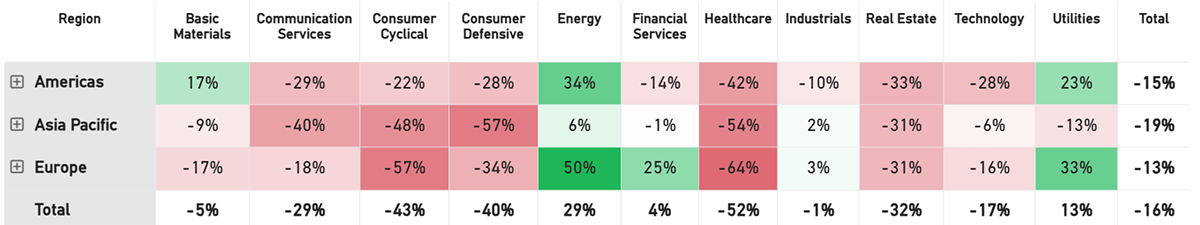
Net Winners - CAPR
The winners-less-losers guides asset allocators. Investors seeking alpha face many landmines (red) and few opportunities. Even Basic Materials and Financials are fading. Technology is split between Hardware (bullish) and Software (bearish), which skews the result. An overweight in Energy and Utilities is required to beat the market, while the Consumer and Healthcare require caution.
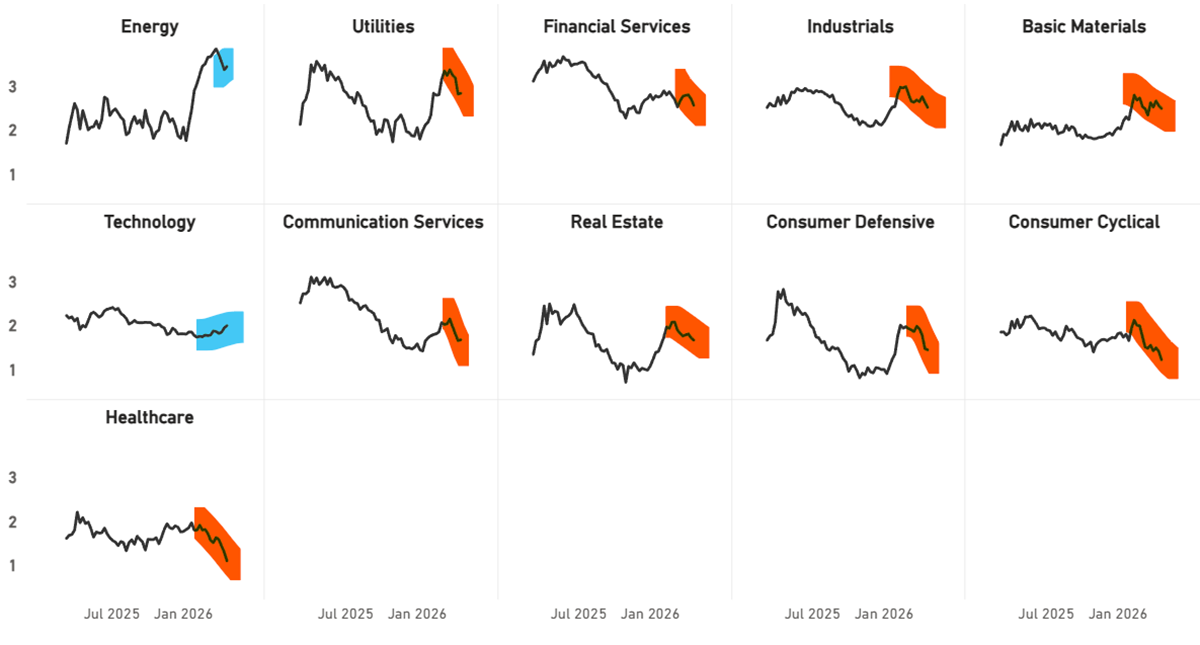
Sectors Trends in CAPR
Just Technology and Energy show improvement, with all other sectors worse off. The Consumer and Healthcare are particularly weak.
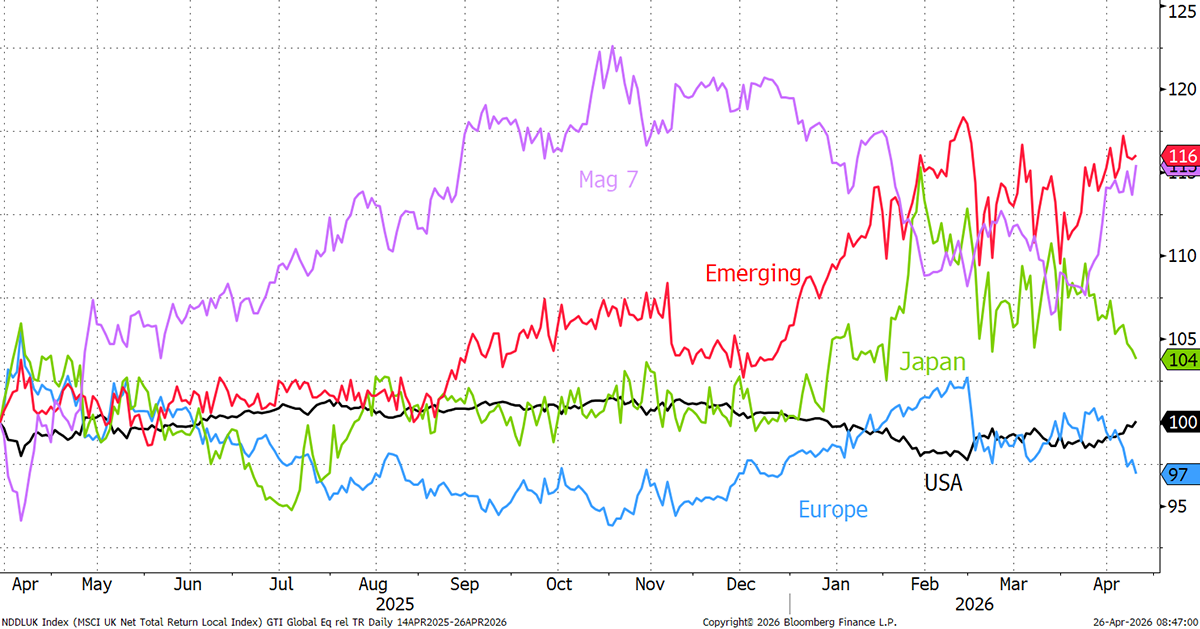
Regional Performance
The USA is back, especially the big tech stocks. Europe and Japan fade, while EM holds.
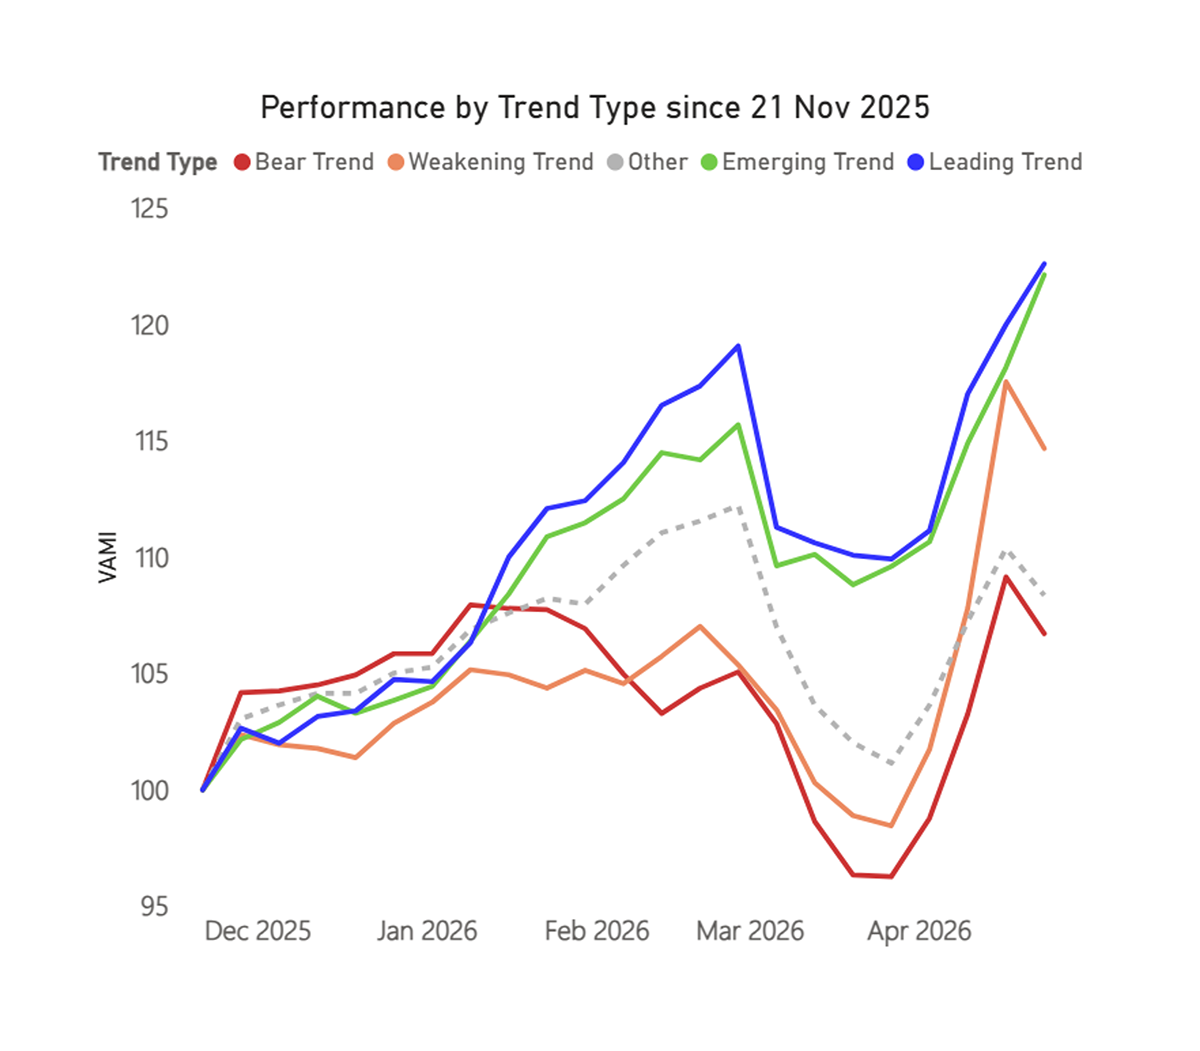
Trend Type Performance
Divergence returns as the winners are going up and the losers are going down.
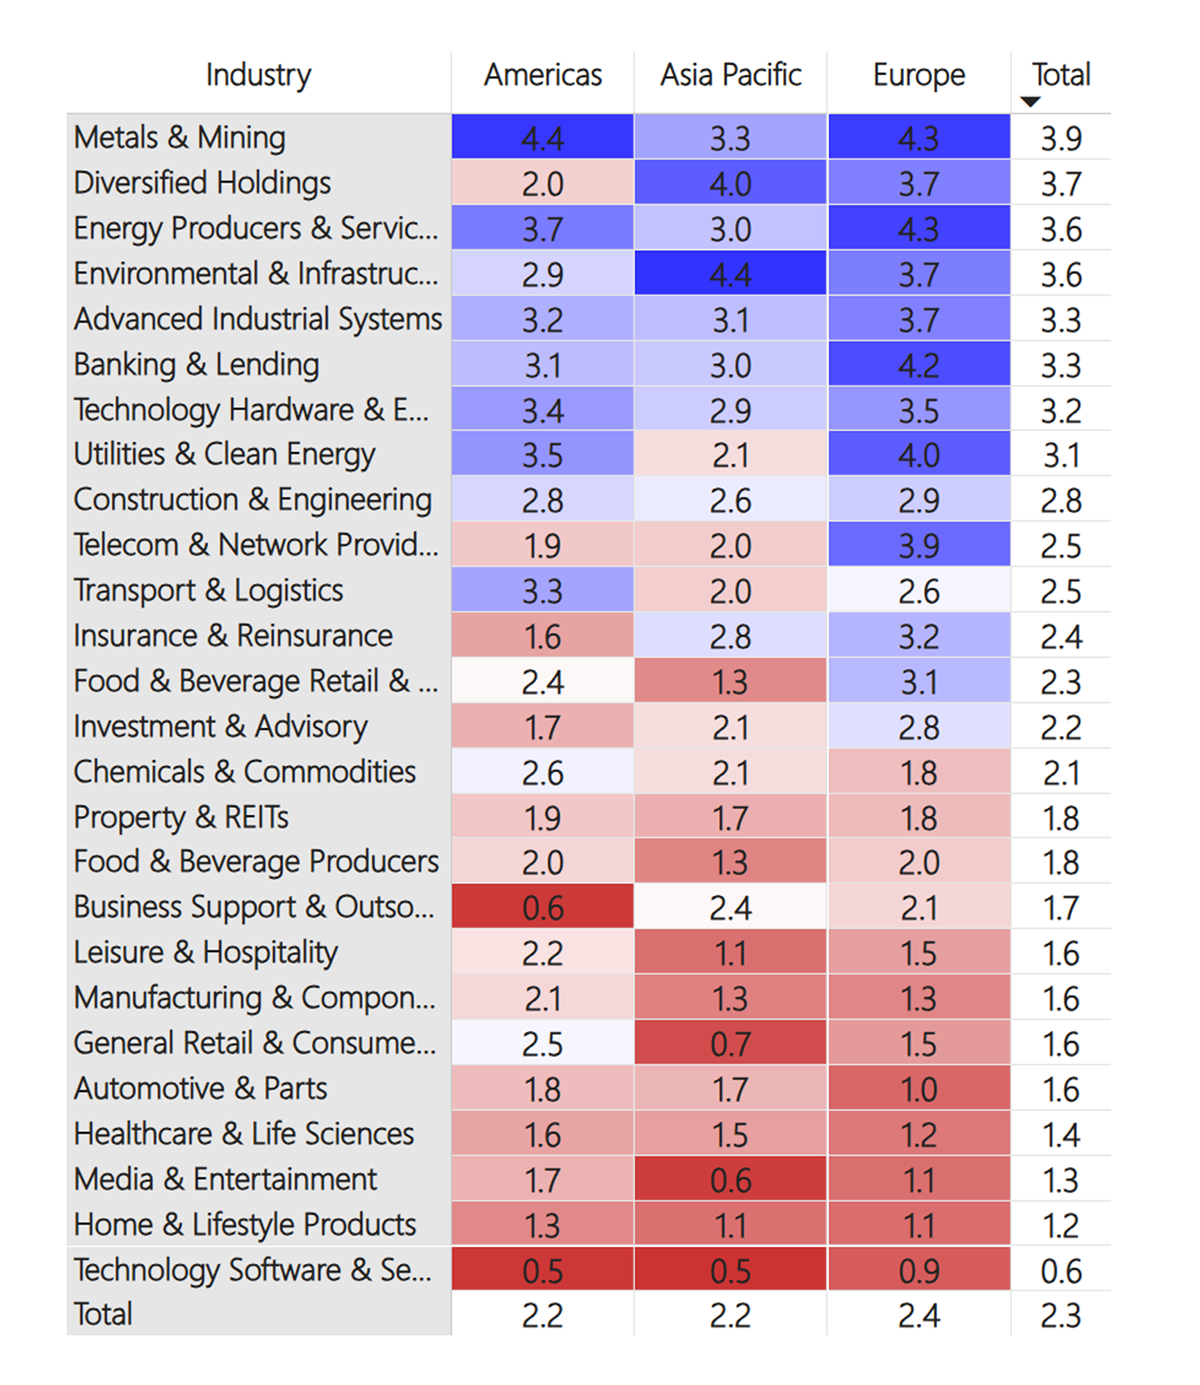
Regions and Industries Average CAPR Score
Energy has improved, and Technology Hardware remains strong. Software remains weak. Healthcare and Life Sciences nosedive alongside Retail, Autos, and Home & Lifestyle.
User Guide
Refer to our GTI: User Guide for an overview of the key concepts and terminology used in this report. These concepts may take a little bit of getting used to, but they are very powerful once you do.
How to Read the Tables
The Value Composite Score (Value) is measured against the company’s own financial history and not in absolute terms. The columns are Cheap (Chp), Value (Val), Fair Value (FV), Overvalued (OV), and Expensive (Exp). The Growth Composite Score (Growth) is measured by sales, earnings, cash flow, dividends, and book value on a per share basis. The columns are High, Good, Medium (Med), Low, and Negative (Neg).
Leading Trends with New Highs
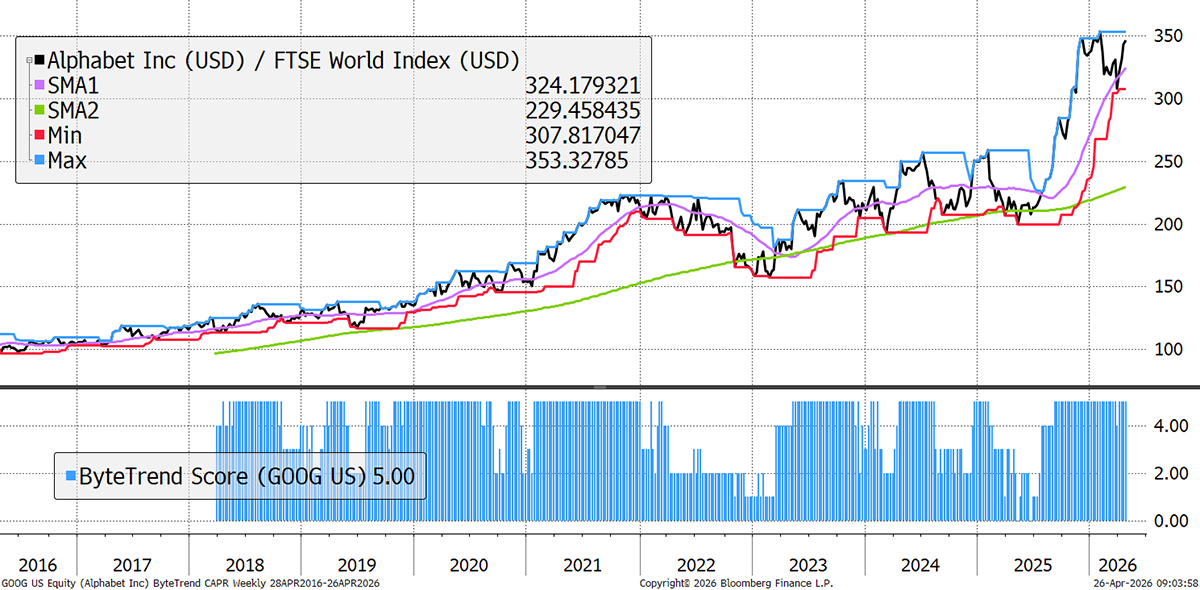
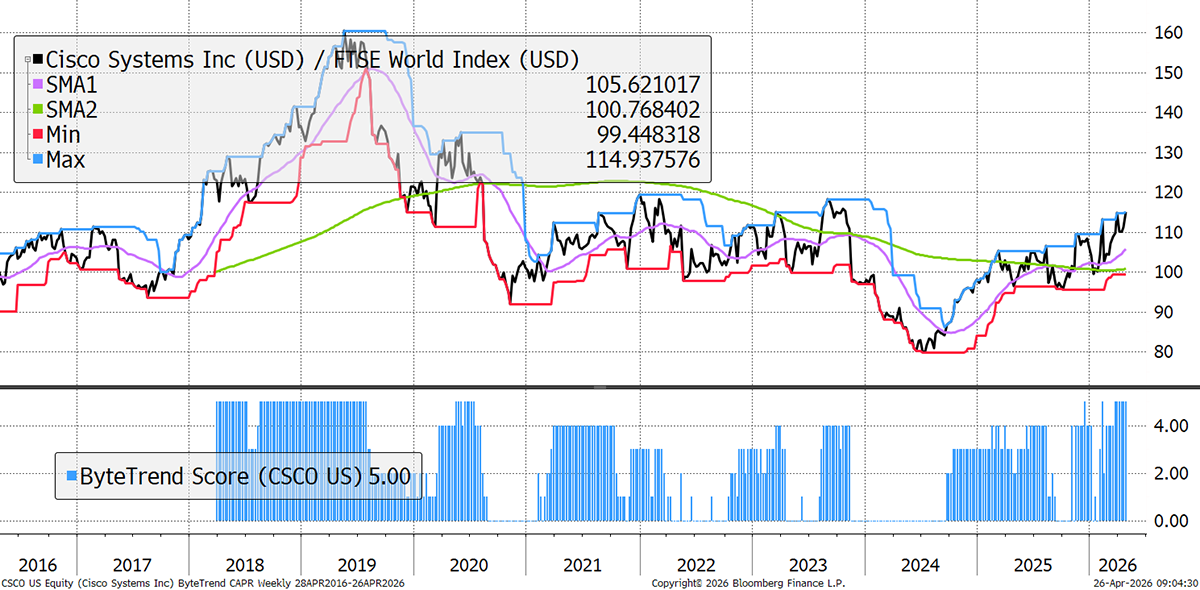
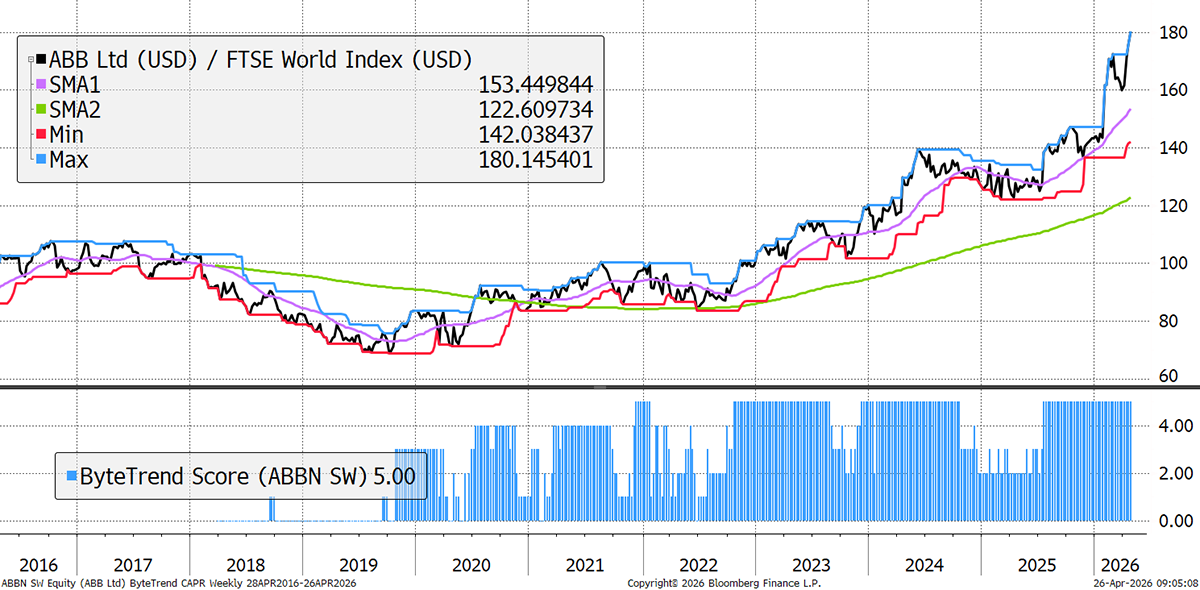
These stocks are trading at the 30-week CAPR highs with a ByteTrend Score of 5. All charts shown are CAPR rebased to 100.
| Name | Annual Vol 30w | Mkt Cap $Bn | Value | Growth |
| Alphabet Inc. | 32 | 4166 | OV | Good |
| Taiwan Semiconductor Manufacturing | 27 | 1802 | OV | High |
| SK hynix Inc. | 59 | 568 | Exp | High |
| Advanced Micro Devices, Inc. | 73 | 567 | OV | High |
| Micron Technology, Inc. | 61 | 560 | Exp | Low |
| Intel Corporation | 63 | 414 | Exp | Neg |
| Caterpillar Inc. | 33 | 387 | Exp | Good |
| Cisco Systems, Inc. | 26 | 352 | OV | Low |
| Applied Materials, Inc. | 42 | 331 | Exp | Med |
| GE Vernova Inc. | 40 | 309 | OV | Med |
| KLA Corporation | 45 | 254 | Exp | Good |
| Arista Networks, Inc. | 49 | 223 | Exp | High |
| Analog Devices, Inc. | 38 | 195 | Exp | Med |
| Siemens Energy AG | 39 | 188 | Exp | High |
| ABB Ltd | 28 | 180 | OV | High |
| The Toronto-Dominion Bank | 15 | 175 | FV | High |
| Delta Electronics, Inc. | 49 | 171 | Exp | Good |
| Eaton Corporation plc | 30 | 164 | Exp | Good |
| Dell Technologies Inc. | 49 | 146 | OV | High |
| Marvell Technology, Inc. | 58 | 144 | Exp | Good |
| Western Digital Corporation | 62 | 137 | Exp | Good |
| Advantest Corporation | 71 | 134 | Exp | High |
| Tokyo Electron Limited | 41 | 132 | Exp | Good |
| Seagate Technology Holdings plc | 62 | 128 | Exp | Neg |
| Vertiv Holdings Co | 52 | 124 | Exp | High |
| MediaTek Inc. | 62 | 124 | OV | Good |
| Trane Technologies plc | 29 | 108 | OV | Good |
| Bank of Montreal | 17 | 107 | OV | Good |
| Canadian Imperial Bank of Commerce | 18 | 102 | OV | Good |
| Quanta Services, Inc. | 26 | 93 | Exp | High |
| The Bank of New York Mellon | 20 | 92 | FV | High |
| Cummins Inc. | 28 | 91 | Exp | High |
| Infineon Technologies AG | 46 | 83 | OV | Neg |
| Monolithic Power Systems, Inc. | 47 | 80 | Exp | High |
| Ciena Corporation | 51 | 74 | Exp | Good |
| ASE Technology Holding Co., Ltd. | 56 | 69 | Exp | Neg |
| Assicurazioni Generali S.p.A. | 23 | 67 | OV | Good |
| Teradyne, Inc. | 63 | 65 | Exp | Low |
| Manulife Financial Corporation | 18 | 65 | OV | High |
| Keysight Technologies, Inc. | 48 | 60 | Exp | Med |
| Nokia Oyj | 37 | 59 | Exp | Med |
| National Bank of Canada | 19 | 58 | OV | Good |
| Doosan Enerbility Co., Ltd. | 53 | 55 | Exp | Med |
| ASM International N.V. | 41 | 50 | Exp | Good |
Alphabet
Google has had a strong run because investors are getting more confident that AI is adding to its Search and YouTube business rather than cannibalising them, while Cloud growth is still accelerating. It’s beaten earnings expectations and growth margins. Cloud has grown around 48% YoY, with a diverse customer base, and operating margin expansion to 30%.
Cisco
Cisco only surpassed its dotcom bubble peak price in 2025 – a quarter century later. It has been strong because it directly benefits from the AI networking story: hyperscaler demand, bigger AI orders, and raised guidance have strengthened the growth case. This has been backed by steady cash flows, as margins have expanded on double-digit sales growth. Within that, service provider and cloud customer orders surged +65% YoY last quarter, driven by the hyperscalers.
ABB
It’s a similar story for ABB, whose electrical, automation, and digital technology products benefit from AI-linked infrastructure demand, especially data-centre power and industrial automation. Last quarter’s results showed 24% YoY growth, along with a record-high order intake.
New Leading Trends
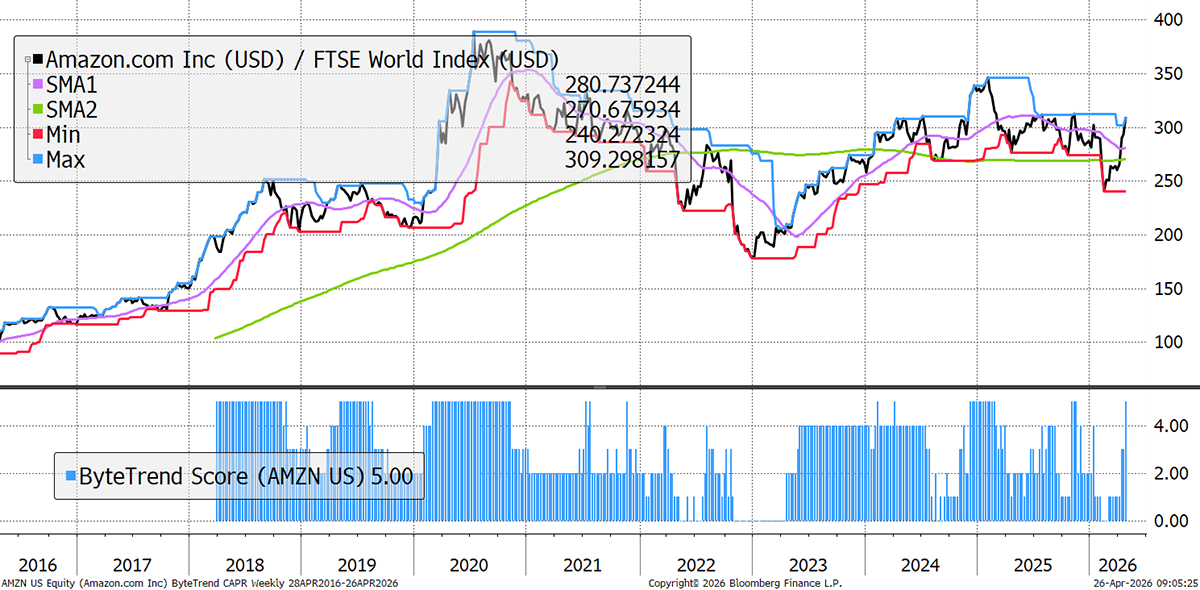
These stocks are trading at the 30-week CAPR highs with a ByteTrend Score of 5, except they are new trends this week, having previously had a score below 5. All charts shown are CAPR rebased to 100.
| Name | Annual Vol 30w | Mkt Cap $Bn | Value | Growth |
| Amazon.com, Inc. | 38 | 2839 | Exp | Good |
| Broadcom Inc. | 46 | 2002 | Exp | High |
| Texas Instruments | 43 | 252 | Exp | Neg |
| Nucor Corporation | 32 | 49 | OV | Neg |
Amazon
Amazon’s been strong because Amazon Web Services, its cloud division, is accelerating again, with AI infrastructure demand giving the story real power. Investors haven’t always bought into this view, but it has the scale (big CapEx, big backlog) to give it a clear path to turn AI spend into future margin and cash flow. Its retail division continues to perform well, contributing to 12% group growth last quarter.
Emerging Trends
These stocks are trading at the 30-week CAPR highs with a ByteTrend Score of less than 5. They don’t have to be in an uptrend, just emerging. All charts shown are CAPR rebased to 100.
| Name | Annual Vol 30w | Mkt Cap $Bn | Value | Growth |
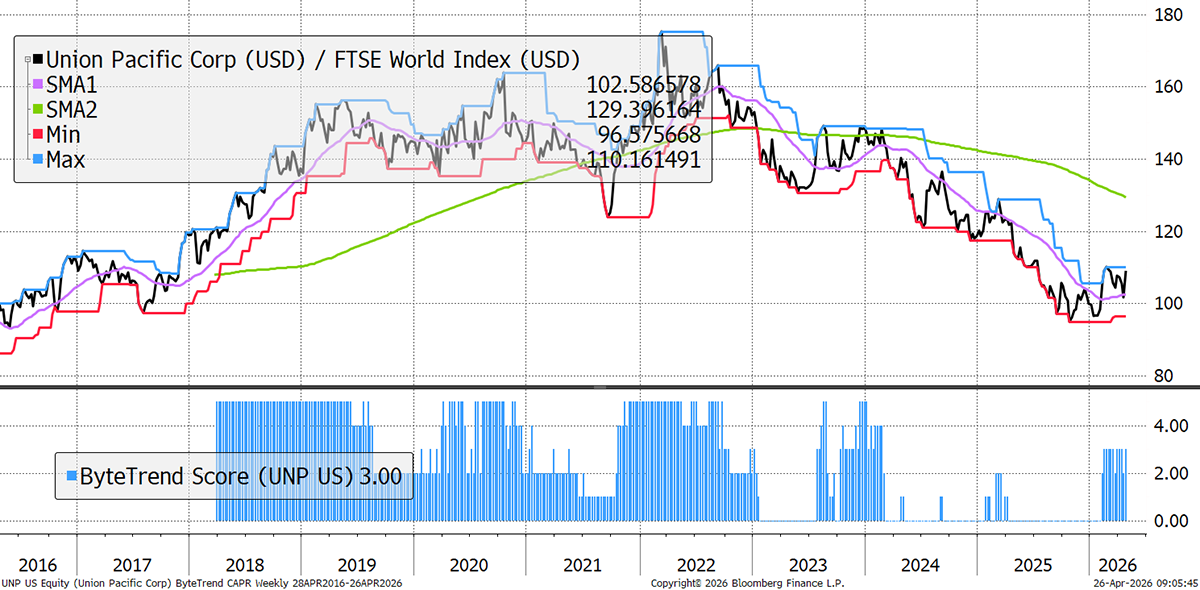
| Union Pacific Corporation | 21 | 160 | FV | Low |
| Equinix, Inc. | 25 | 109 | OV | Good |
| Airbnb, Inc. | 31 | 86 | FV | High |
| CSX Corporation | 22 | 84 | OV | Neg |
| Canadian National Railway | 21 | 70 | FV | Low |
| Murata Manufacturing | 42 | 56 | OV | Low |
Union Pacific
Union Pacific has been strong because investors like the combination of predictable, defensive cash flow, better operating efficiency, and pricing power in a slower-growth market. Additionally, it’s trading close to its price highs, so momentum has also helped push it higher. It habitually adds fuel surcharges to its fees, allowing it to pass on more of the energy cost to its customers than most.
Weakening
These stocks are trading at the 30-week CAPR lows with a ByteTrend Score above 0. They are weakening trends but not yet downtrends. All charts shown are CAPR rebased to 100.
| Name | Annual Vol 30w | Mkt Cap $Bn | Value | Growth |
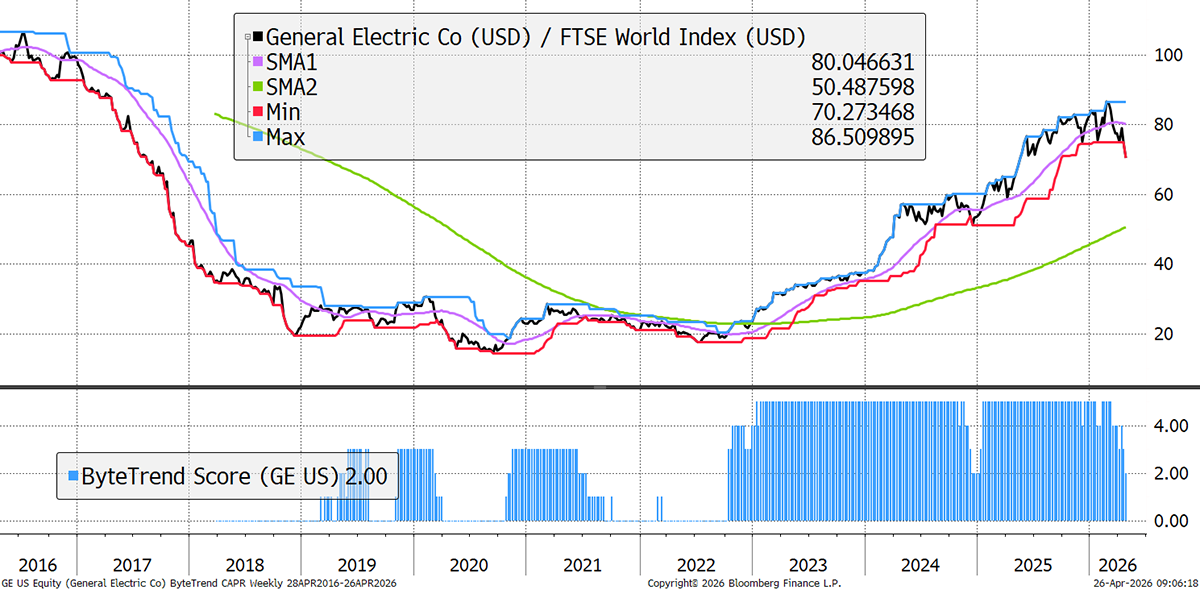
| GE Aerospace | 33 | 297 | Exp | High |
| Wells Fargo & Company | 32 | 244 | FV | Good |
| International Business Machines | 36 | 218 | OV | High |
| American Express Company | 29 | 215 | OV | Good |
| Hermès International | 30 | 203 | FV | Good |
| Airbus SE | 24 | 154 | FV | Good |
| Safran S.A. | 33 | 132 | OV | High |
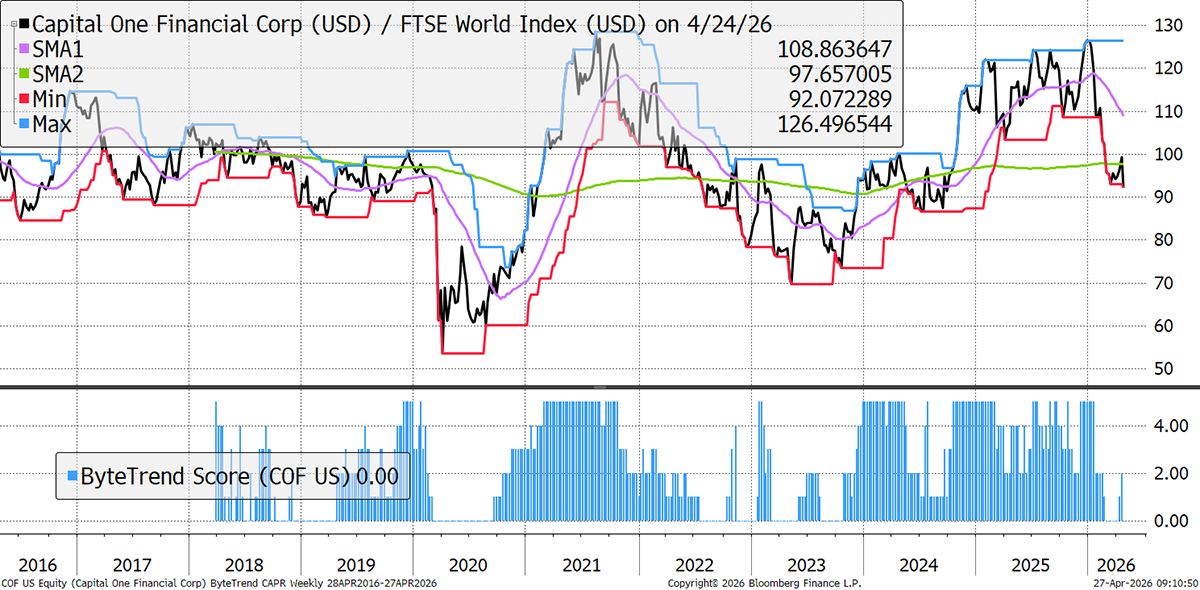
| Capital One Financial Corporation | 32 | 118 | OV | Low |
| The Progressive Corporation | 23 | 118 | FV | High |
| Bharti Airtel Limited | 18 | 117 | OV | High |
| Vertex Pharmaceuticals | 25 | 109 | FV | Low |
| Prosus N.V. | 37 | 106 | Val | High |
| Xiaomi Corporation | 30 | 103 | FV | High |
| HCA Healthcare, Inc. | 28 | 97 | FV | Good |
| O'Reilly Automotive, Inc. | 20 | 78 | OV | Low |
| Royal Caribbean Cruises Ltd. | 45 | 72 | FV | High |
| Rheinmetall AG | 51 | 72 | Exp | High |
| Cintas Corporation | 23 | 70 | OV | Good |
| Nu Holdings Ltd. | 34 | 70 | FV | High |
| TransDigm Group Incorporated | 29 | 65 | FV | High |
| Cencora, Inc. | 25 | 60 | Exp | Med |
| Saudi Telecom Company | 11 | 57 | OV | Med |
| Thales S.A. | 38 | 56 | OV | Med |
| Electronic Arts Inc. | 7 | 51 | OV | Med |
General Electric
GE stock, the aerospace business that remained following the breakup of the conglomerate, had been up over 400% in the last five years, suggesting some profit-taking may be occurring. Revenue growth was again in the high-20s last quarter, but free cash flow growth disappointed slightly, up 14% and with lower margins.
Capital One
Capital One’s weakness reflects pain in consumer credit. While chip stocks are soaring, the consumer sees little benefit from this at present, fearing for their white-collar jobs, while the energy crisis puts inflation worries back to the fore. Its Q2 results last week showed a slight fall of -2% in revenues, suggesting the integration of its large Discover acquisition is not quite working yet.
Bear Trends
These stocks are trading at the 30-week CAPR lows with a ByteTrend Score of 0. They are in a downtrend. All charts shown are CAPR rebased to 100.
| Name | Annual Vol 30w | Mkt Cap $Bn | Value | Growth |
| Berkshire Hathaway Inc. | 14 | 1012 | OV | Good |
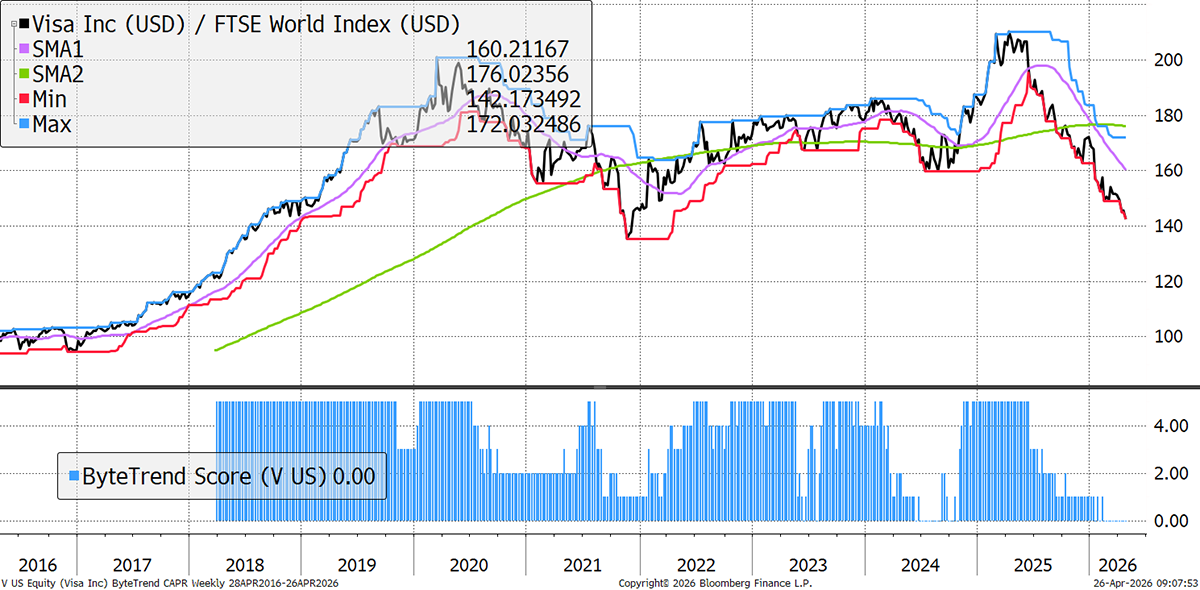
| Visa Inc. | 19 | 597 | FV | Med |
| Tencent Holdings Limited | 25 | 569 | Val | High |
| Mastercard Incorporated | 21 | 450 | FV | Good |
| AbbVie Inc. | 22 | 351 | OV | Neg |
| The Home Depot, Inc. | 25 | 335 | FV | Low |
| LVMH Moët Hennessy | 32 | 274 | Val | Low |
| Toyota Motor Corporation | 31 | 251 | OV | High |
| McDonald's Corporation | 16 | 213 | FV | Med |
| T-Mobile US, Inc. | 27 | 209 | FV | High |
| Reliance Industries Limited | 18 | 191 | FV | Good |
| The Walt Disney Company | 23 | 182 | FV | High |
| Thermo Fisher Scientific Inc. | 38 | 175 | FV | Med |
| Abbott Laboratories | 22 | 158 | Val | Med |
| The Charles Schwab | 21 | 155 | FV | High |
| PDD Holdings Inc. | 35 | 137 | Chp | High |
| HDFC Bank Limited | 19 | 128 | Val | High |
| Unilever PLC | 26 | 127 | #DIV/0! | #N/A |
| Danaher Corporation | 35 | 125 | Val | Neg |
| Stryker Corporation | 23 | 125 | FV | Good |
| Sony Group Corporation | 31 | 120 | OV | Good |
| Accenture plc | 37 | 110 | Val | Med |
| Medtronic plc | 21 | 107 | FV | Low |
| EssilorLuxottica S.A. | 37 | 101 | FV | Med |
| ICICI Bank Limited | 21 | 101 | FV | High |
| Christian Dior SE | 32 | 94 | ||
| Boston Scientific | 37 | 92 | Val | High |
| Tata Consultancy Services | 23 | 92 | Val | Med |
| Marsh & McLennan | 19 | 90 | ||
| General Dynamics | 19 | 85 | FV | Med |
| Northrop Grumman | 29 | 82 | FV | Good |
| NTT, Inc. | 13 | 78 | FV | Neg |
| 3M Company | 32 | 76 | FV | Neg |
| Ecolab Inc. | 23 | 76 | OV | Good |
| NetEase, Inc. | 28 | 70 | Val | High |
| Aon plc | 21 | 69 | FV | Med |
| Deutsche Post AG | 0 | 63 | FV | Neg |
| Deutsche Post AG | 0 | 63 | FV | Neg |
| KDDI Corporation | 19 | 61 | FV | Low |
| Nintendo Co., Ltd. | 43 | 58 | FV | Neg |
| Merck KGaA | 36 | 57 | Val | Neg |
| Bayerische Motoren Werke AG | 32 | 56 | FV | Neg |
| Mercedes-Benz Group AG | 26 | 56 | FV | Neg |
| Wal-Mart de México, S.A.B. de C.V. | 22 | 54 | Val | Neg |
| Sea Limited | 41 | 52 | Chp | High |
| Volkswagen AG | 27 | 52 | Val | Neg |
| Volkswagen AG | 28 | 51 | Val | Neg |
| Danone S.A. | 22 | 51 | FV | Good |
| Infosys Limited | 30 | 50 | Val | Good |
Visa
Visa is now in a year-long downtrend. Having reached extreme valuations, the main drags have been talks of US credit-card rate caps, plus periodic worries that AI and payment innovation could pressure fees. It was seen as having an impregnable moat, and the loss of that conviction has been painful for the stock.
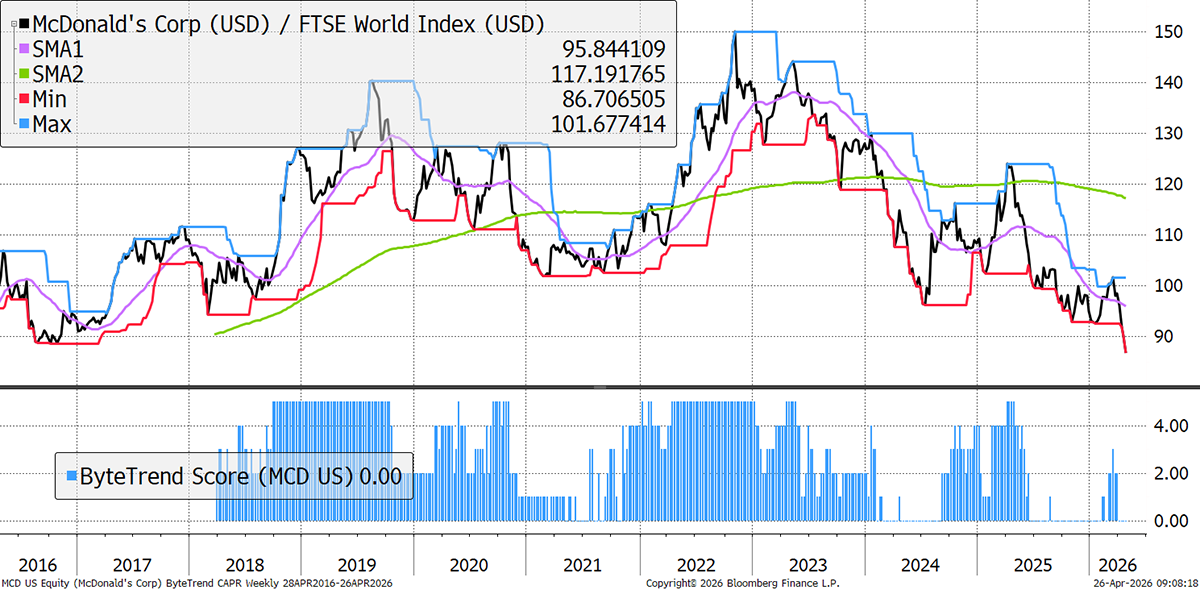
McDonald’s
McDonald’s weakened last year due to persistent weak US same-store sales—the worst since 2020 at -3.6% in Q1 2025, as low- and middle-income consumers cut back amid inflation and economic caution. The recent flimsy attempt by its CEO to eat one of their own “products” (burgers) on video hasn’t helped its image, as peers continue to report better results while McDonald’s cuts its forecasts. GLP-1 (weight-loss) drugs are also a growing challenge.
GTI 200 Spreadsheet
We are pleased to share the GTI 200 spreadsheet. Download the spreadsheet below to view the CAPR and local currency scores, and more, for the world’s largest 200 stocks. Have a look at the different groups and the main list “All stocks”. The Insights tab is interesting, and don’t forget to expand the columns by clicking on the “+” at the top of the page if you want to see more trend data.
Outlook
It’s a thin market with a 3:1 ratio of winners to losers. If the losers start to fall in absolute terms, that will signal an early bear market held up at the index level by narrow leadership. That isn’t happening yet, but a prolonged blockade of the Strait of Hormuz won’t help.
Thanks for reading GTI.


