
Open or Closed?


Issue 61;
- Market surges as Trump declares the Strait of Hormuz open, yet the ships don’t move.
- Stocks went up while the good news lasted.
- Technology drives the rally.
Global Trends is a deep dive into global equities. The aim of this analysis is to better understand which countries, sectors, industries, and stocks are driving market returns. Not only does it help investors identify opportunities, but it also highlights the risks. We try to condense as much important information as possible, focusing on what really matters each week. Embrace this as a weekly discipline, and you’ll soon have a much better understanding of global financial markets.
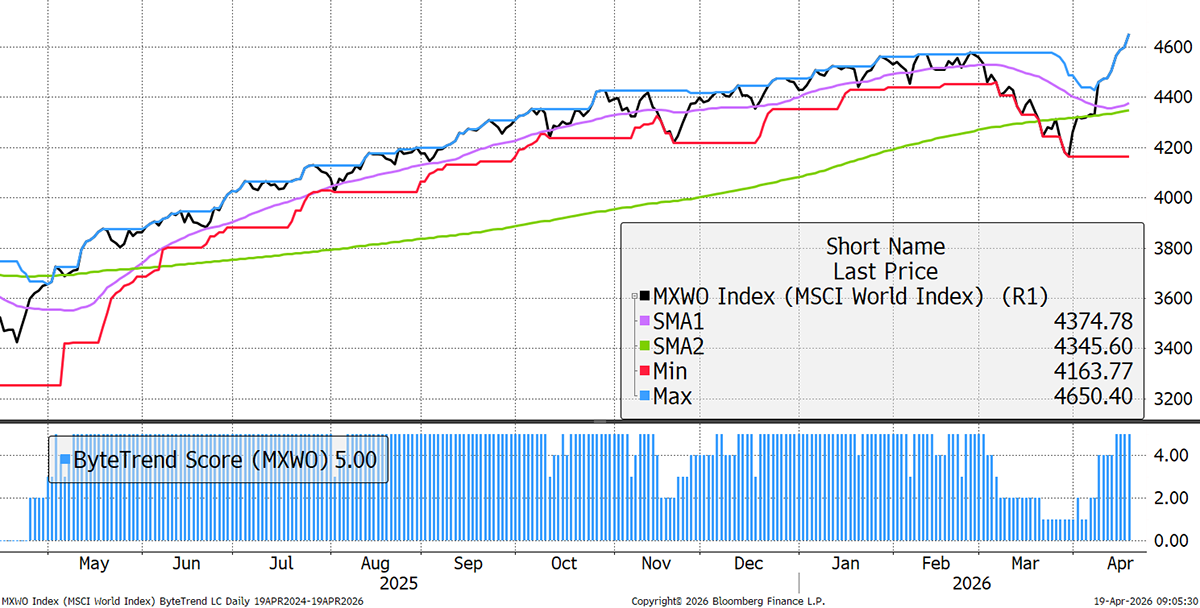
The World Index resumes a ByteTrend Score of 5 in USD. The 30-day moving average has already turned up in one of the most remarkable market rallies in history. Friday’s announcement that the Strait of Hormuz was open was the icing on the cake. Technically speaking, the market trend is strong, but then over the weekend, we heard that the Strait was still closed.
World Index – Developed Markets – Daily
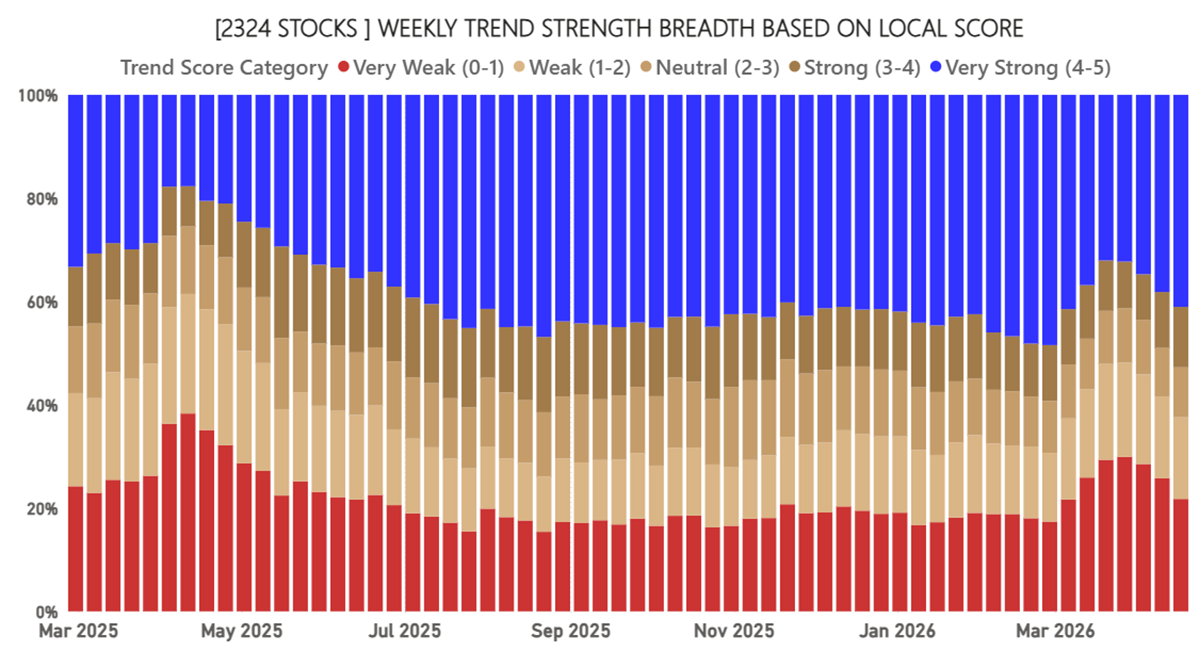
Global Equity Breadth – Local Currency
Breadth has improved again and is close to the highest levels seen over the past year. Remarkable. NVIDIA, Alphabet, Amazon, Broadcom, Taiwan Semi, Samsung, SK Hynix, Micron, and AMD made 30-week price highs. This is a strong turnaround.
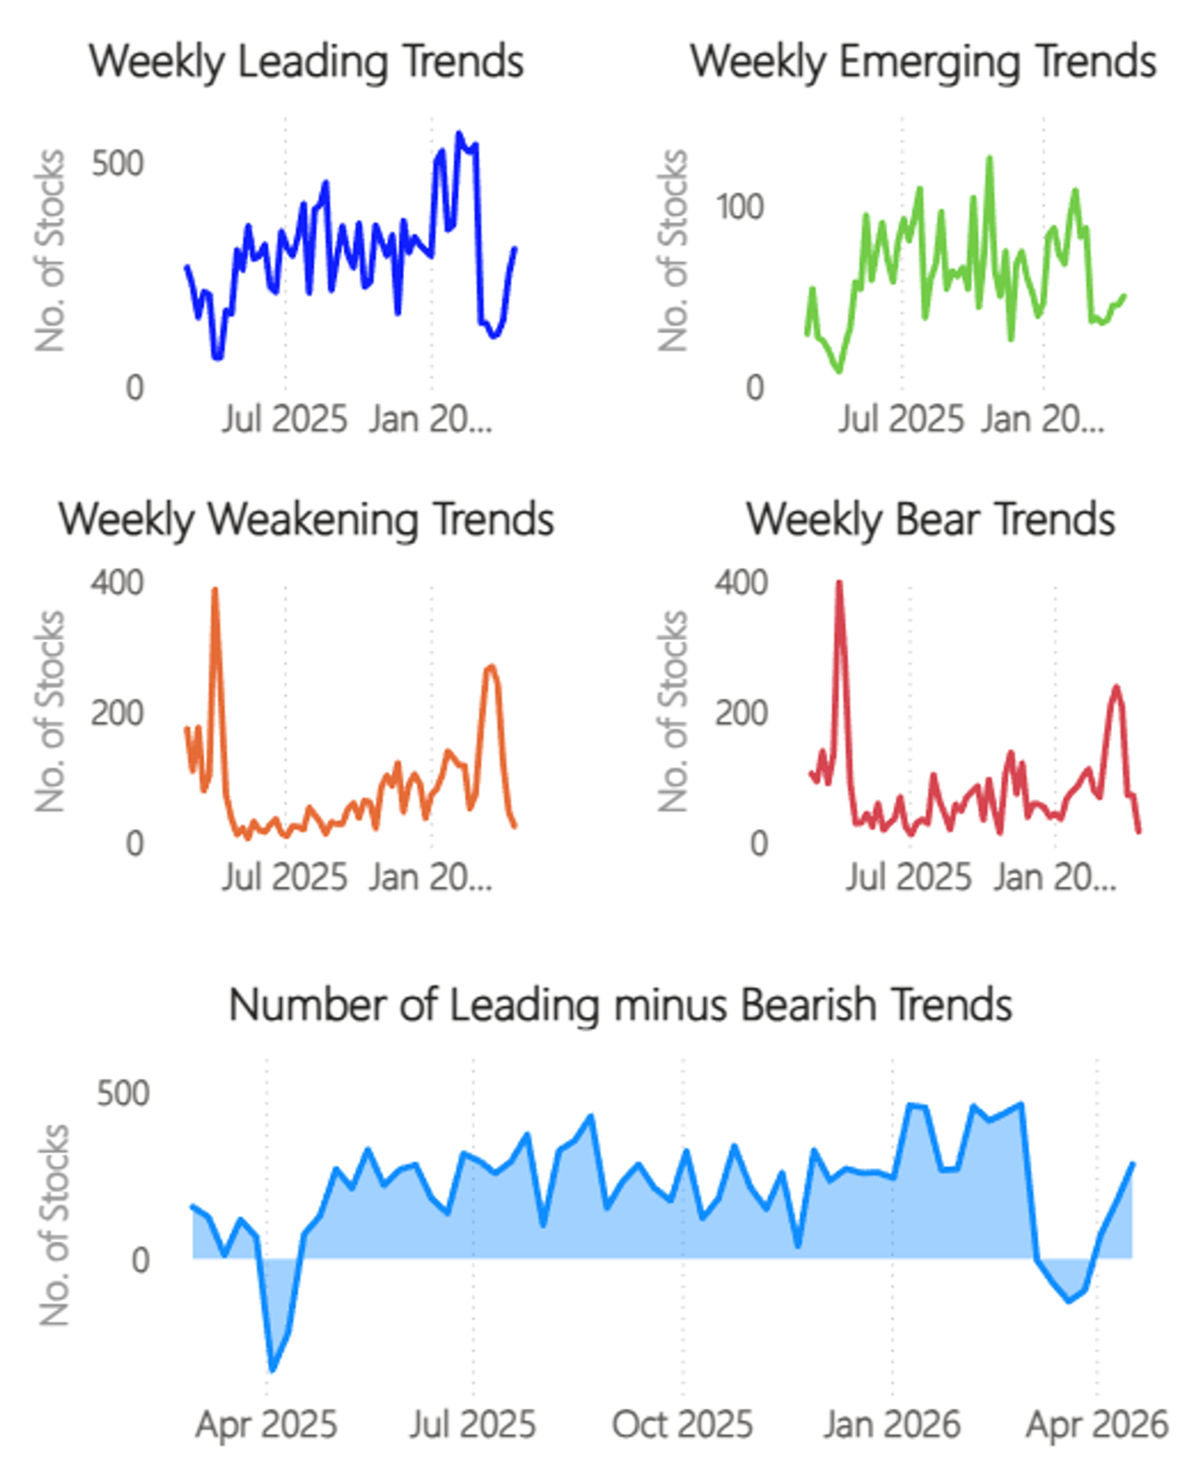
Leading Trends Broaden
The number of new price highs has increased, while new lows have retreated. This is commensurate with bullish conditions.
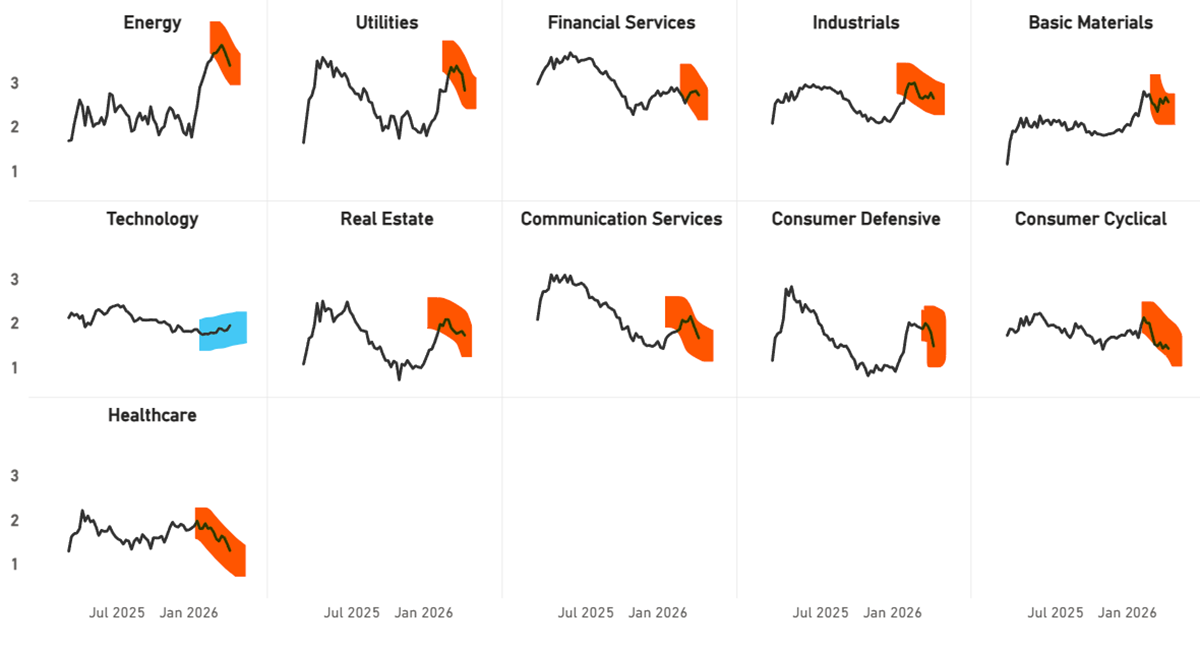
Sector trends in CAPR
Every sector lags the market except for technology. Hardware leads, but some software stocks are rebounding.
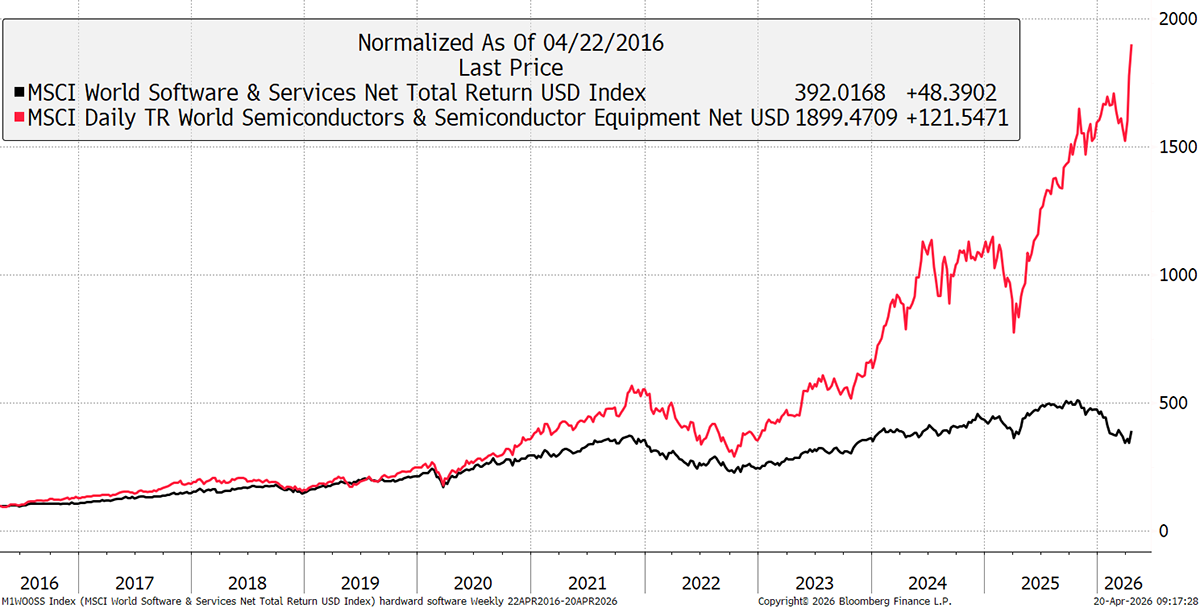
Hardware vs Software
Software (black) has rallied, but the trend remains much stronger in hardware.
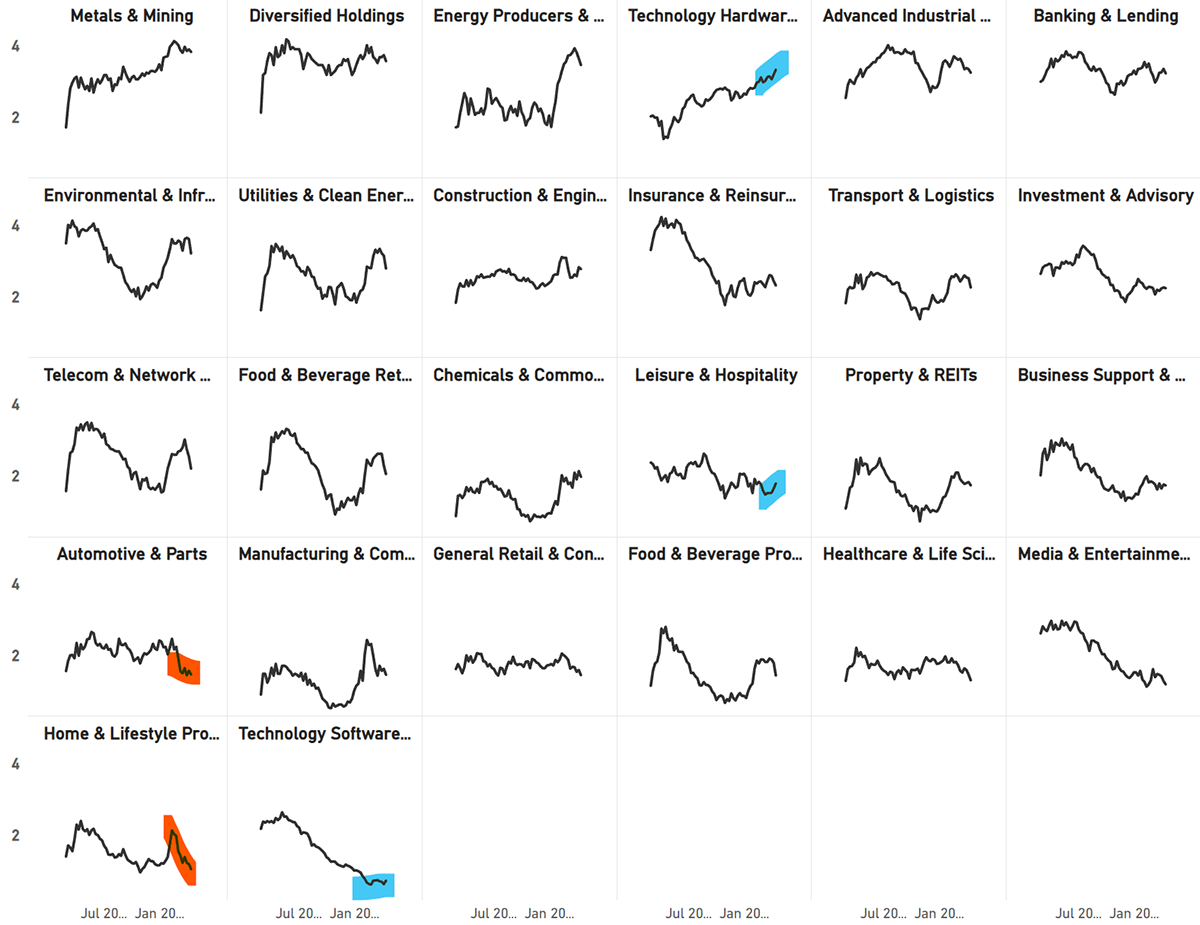
Industry Trends in CAPR
Technology Hardware and Software show up in the industry CAPR charts, alongside Leisure & Hospitality. Hotels have bounced, with Marriott and Hilton making CAPR highs. That reflects an optimistic view of a short war. Home & Lifestyle includes luxury goods. L'Oréal, Hermès, and Kering have all made CAPR lows.
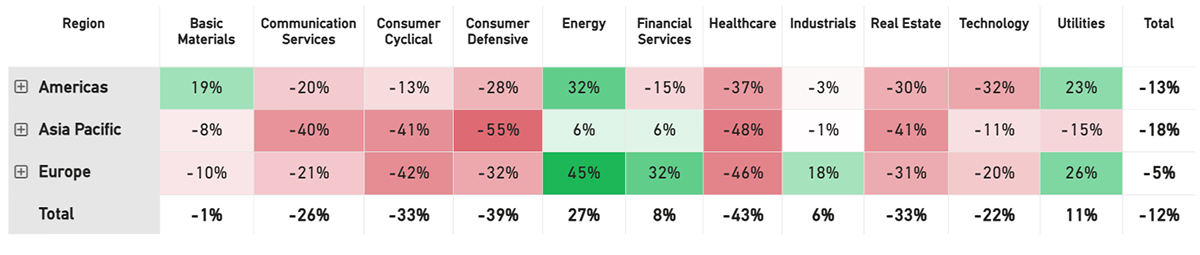
Net Winners
The winners-less-losers metric guides asset allocators. Energy has cooled a little but remains a firm overweight. Financials, Industrials, and Utilities remain strong. The Consumer, Healthcare, and REITs remain weak.
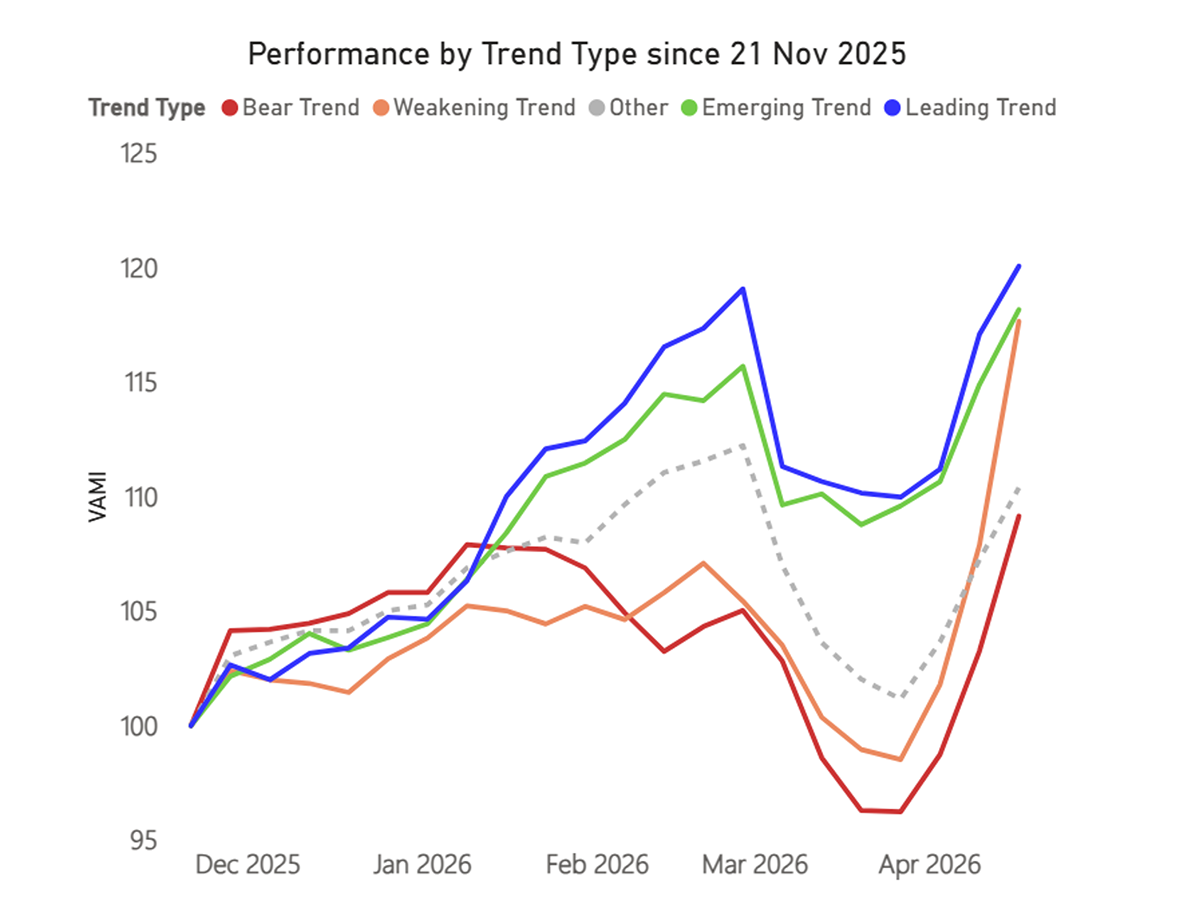
Trend Type Performance
This is still a momentum market. The leaders have made an all-time high, as have the emerging trends. There was also a strong bounce in the oversold stocks.
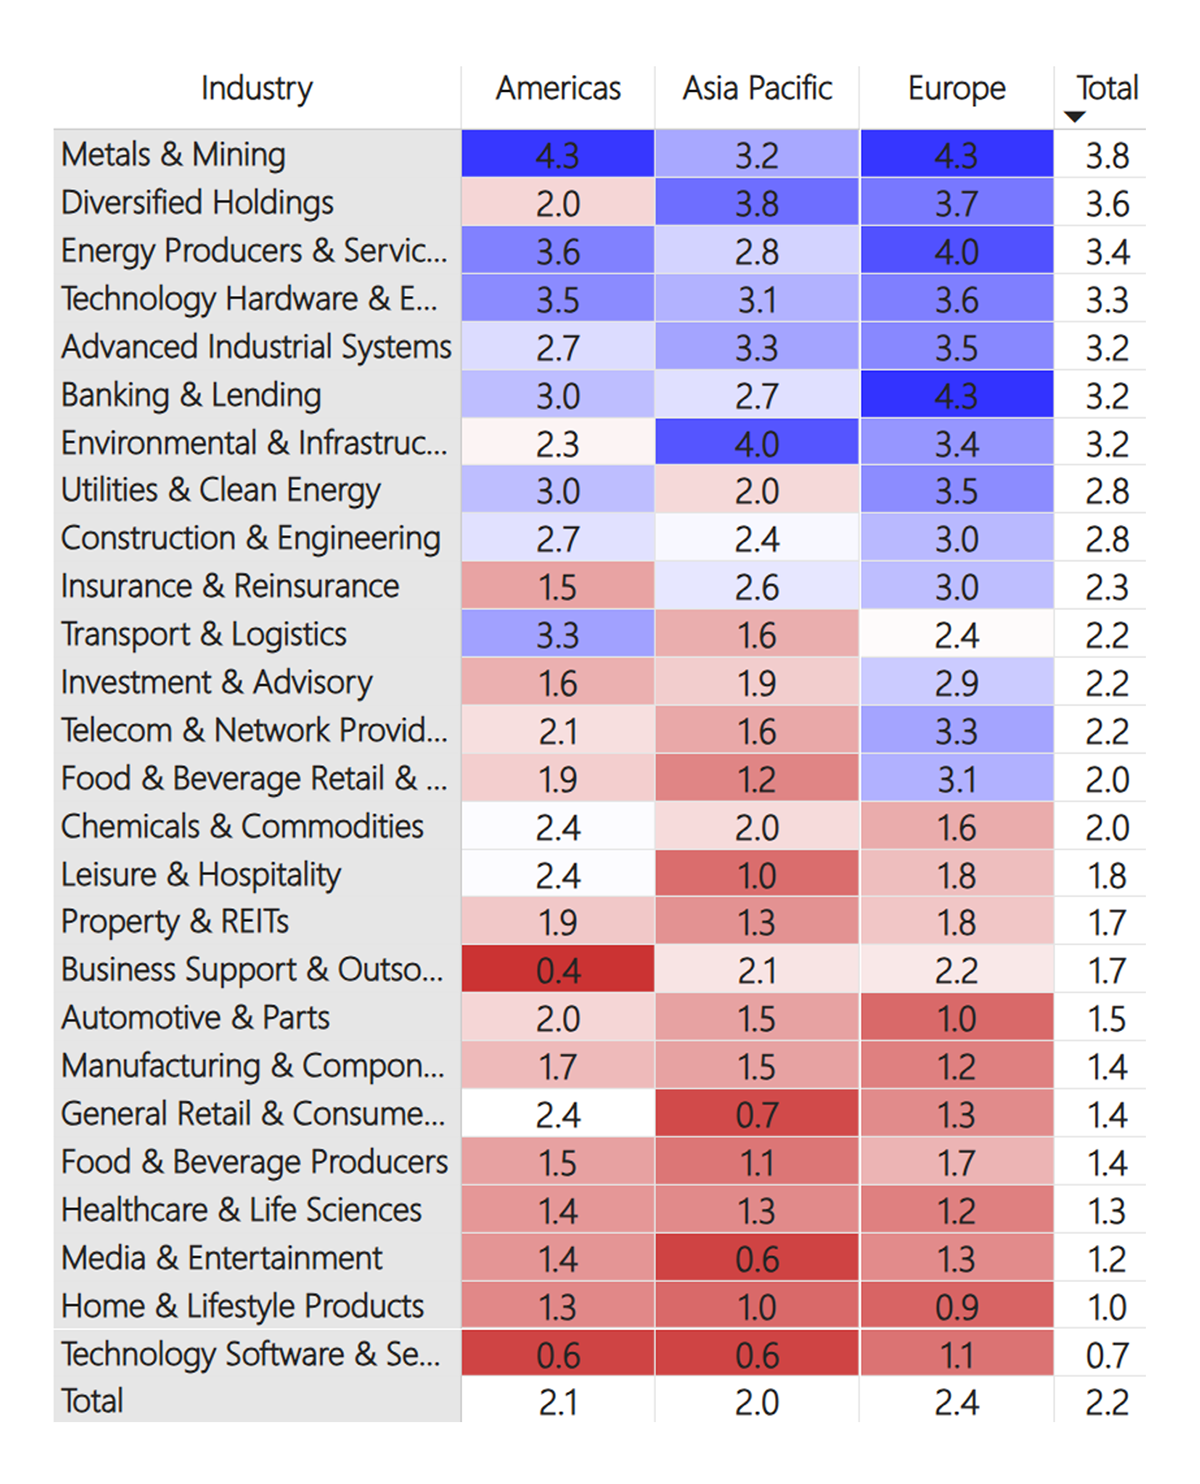
Regions and Industries Average CAPR Score
Metals, Diversified Holdings, and Energy hold the lead. Environmental and Infrastructure have softened while Technology Hardware has strengthened. Software remains the weakest group but is slightly stronger than last week. Healthcare, Media, and Home & Lifestyle have weakened further.
User Guide
Refer to our GTI: User Guide for an overview of the key concepts and terminology used in this report. These concepts may take a little bit of getting used to, but they are very powerful once you do.
How to Read the Tables
The Value Composite Score (Value) is measured against the company’s own financial history and not in absolute terms. The columns are Cheap (Chp), Value (Val), Fair Value (FV), Overvalued (OV), and Expensive (Exp). The Growth Composite Score (Growth) is measured by sales, earnings, cash flow, dividends, and book value on a per share basis. The columns are High, Good, Medium (Med), Low, and Negative (Neg).
Leading Trends with New Highs
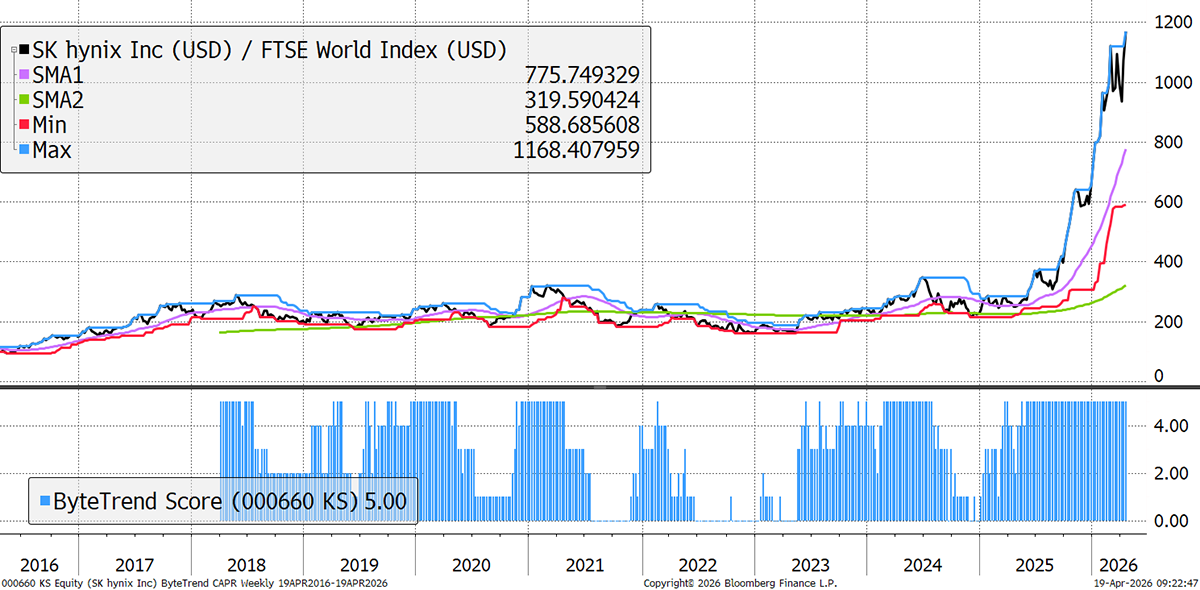
These stocks are trading at the 30-week CAPR highs with a ByteTrend Score of 5. All charts shown are CAPR rebased to 100.
| Name | Annual Vol 30w | Mkt Cap $Bn | Value | Growth |
| SK hynix Inc. | 60 | 528 | Exp | High |
| Royal Bank of Canada | 14 | 249 | OV | Good |
| Citigroup Inc. | 31 | 231 | FV | Good |
| Analog Devices, Inc. | 37 | 181 | OV | Med |
| ABB Ltd | 28 | 176 | OV | High |
| Delta Electronics, Inc. | 49 | 152 | Exp | Good |
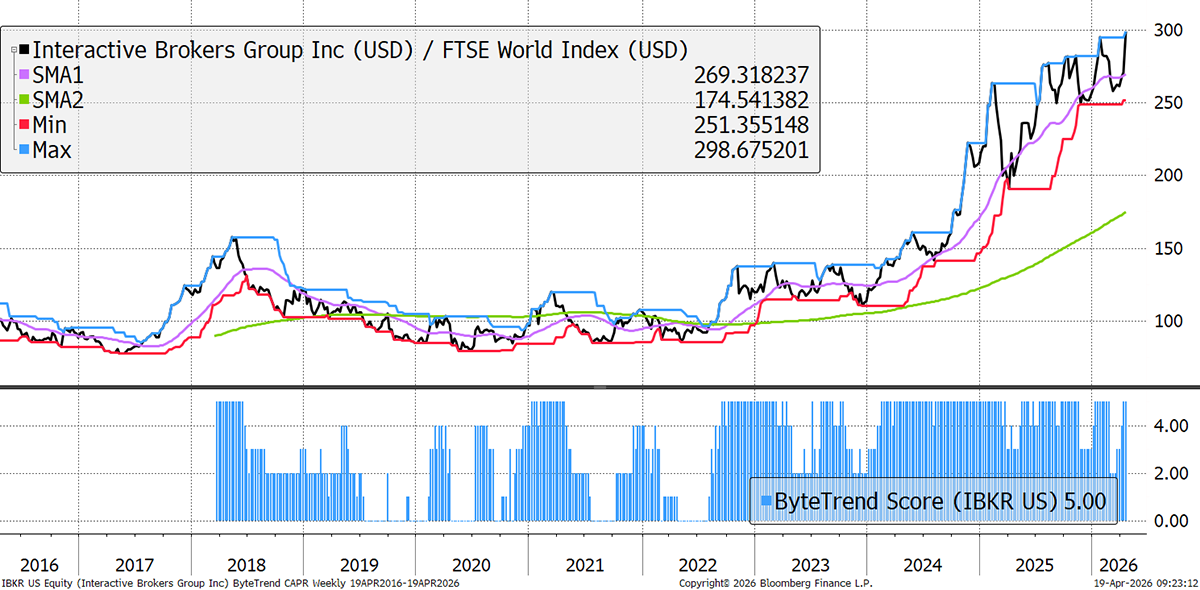
| Interactive Brokers Group, Inc. | 34 | 141 | OV | High |
| Dell Technologies Inc. | 47 | 133 | OV | High |
| Western Digital Corporation | 62 | 126 | Exp | Good |
| Marvell Technology, Inc. | 56 | 122 | OV | Good |
| Seagate Technology Holdings plc | 62 | 119 | Exp | Neg |
| Vertiv Holdings Co | 53 | 118 | Exp | High |
| Canadian Imperial Bank of Commerce | 18 | 101 | OV | Good |
| Freeport-McMoRan Inc. | 49 | 101 | Exp | Neg |
| Marriott International, Inc. | 29 | 100 | OV | Good |
| The Bank of New York Mellon Corporation | 20 | 93 | FV | High |
| Hilton Worldwide Holdings Inc. | 22 | 78 | OV | Good |
| Infineon Technologies AG | 45 | 75 | OV | Neg |
| Monolithic Power Systems, Inc. | 46 | 72 | OV | High |
| Manulife Financial Corporation | 18 | 65 | OV | High |
| ASE Technology Holding Co., Ltd. | 56 | 61 | Exp | Neg |
| National Bank of Canada | 19 | 58 | OV | Good |
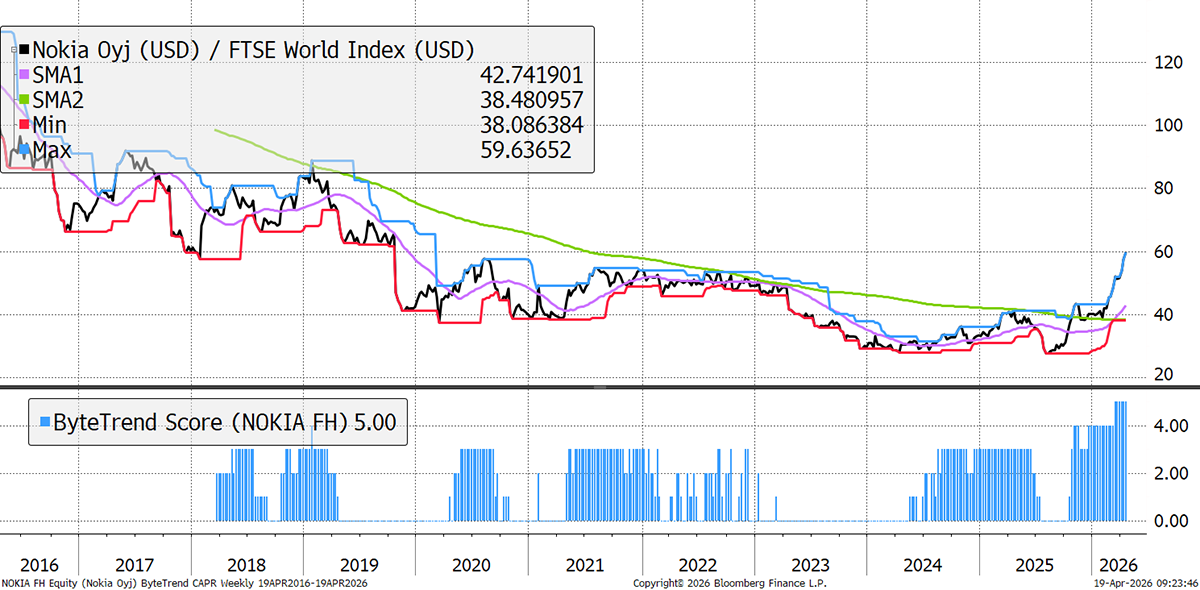
| Nokia Oyj | 37 | 57 | Exp | Med |
SK Hynix
The AI memory boom maintains a firm bid for the company. Since 2011, average gross margins have been 38%, but they are set to exceed 70% as DRAM and NAND prices continue to surge amidst the AI boom.
Interactive Brokers
In the recent ByteTree Broker Survey, IBKR came top amongst ByteTree PRO clients. Operating margins are 79%, which exceed the chip sector average. Traders have boosted volumes 3x since the 2021 boom.
Nokia
High demand for optical networking is linked to the AI data centre rollout. Nokia reorganised into two main segments: Network Infrastructure (Optical, IP, Fixed Networks) and Mobile Infrastructure (AI-native networks and path to 6G). The company’s acquisition of Infinera and new optical roadmap are viewed as major positives for long-term growth.
New Leading Trends
These stocks are trading at the 30-week CAPR highs with a ByteTrend Score of 5, except they are new trends this week, having previously had a score below 5. All charts shown are CAPR rebased to 100.
| Name | Annual Vol 30w | Mkt Cap $Bn | Value | Growth |
| Advanced Micro Devices | 67 | 454 | OV | High |
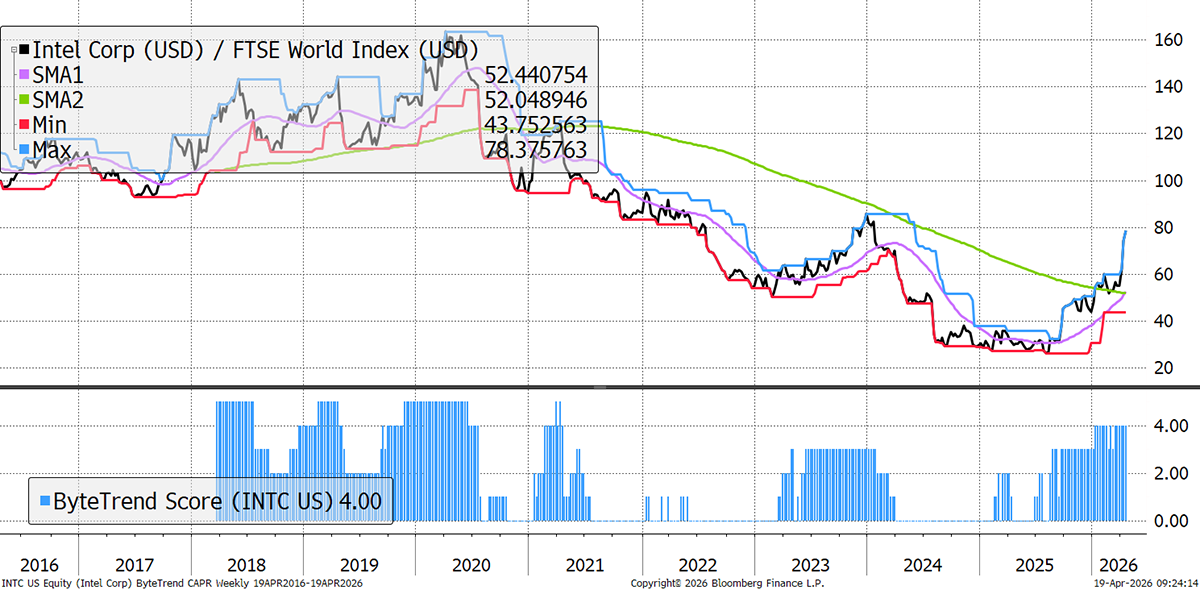
| Intel Corporation | 63 | 344 | Exp | Neg |
| Toronto-Dominion Bank | 15 | 176 | FV | High |
| Bank of Montreal | 17 | 107 | OV | Good |
Intel
Intel's Intel 18A process node with RibbonFET and PowerVia tech is now in high-volume manufacturing. This marks a major validation after years of process delays. Clearwater Forest (18A-based server CPU) is also advancing. Gross margins are still 36% when the long-term average has been 60%. A reinvention strategy is underway.
Emerging Trends
These stocks are trading at the 30-week CAPR highs with a ByteTrend Score of less than 5. They don’t have to be in an uptrend, just emerging. All charts shown are CAPR rebased to 100.
| Name | Annual Vol 30w | Mkt Cap $Bn | Value | Growth |
| Prologis, Inc. | 24 | 135 | FV | Good |
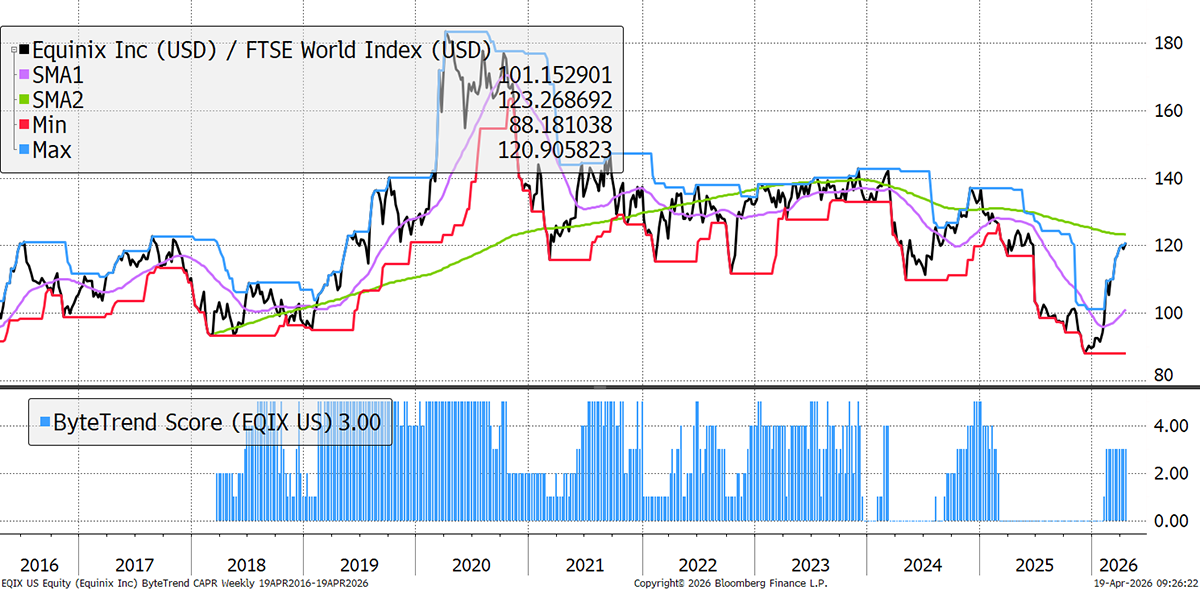
| Equinix, Inc. | 26 | 107 | FV | Good |
| Vale S.A. | 25 | 77 | OV | Neg |
| Digital Realty Trust, Inc. | 26 | 70 | OV | High |
| Macquarie Group | 24 | 63 | OV | Med |
| Murata Manufacturing | 42 | 53 | OV | Low |
Equinix
We are seeing a few data-related REITs in recovery patterns. The market is looking for a boost in AI-related bookings. It is adding data centres in San Paolo, Nigeria, Hong Kong, Silicon Valley, Paris, India, and Ireland.
Weakening
These stocks are trading at the 30-week CAPR lows with a ByteTrend Score above 0. They are weakening trends but not yet downtrends. All charts shown are CAPR rebased to 100.
| Name | Annual Vol 30w | Mkt Cap $Bn | Value | Growth |
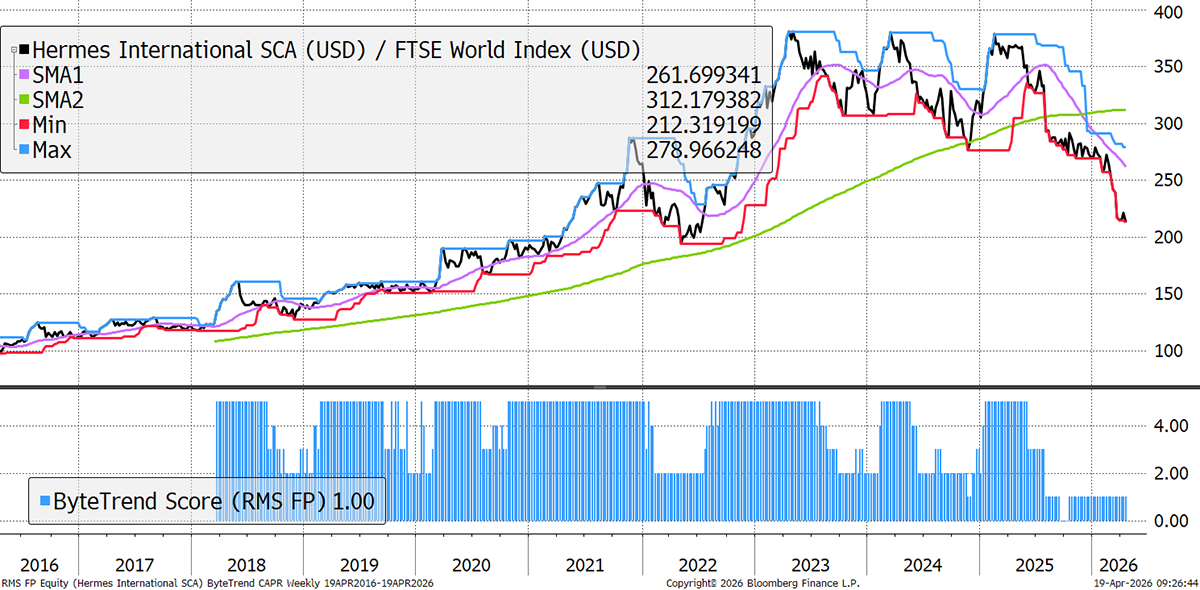
| Hermès International | 30 | 215 | FV | Good |
| Intuitive Surgical, Inc. | 39 | 167 | FV | High |
| The Progressive Corporation | 23 | 119 | FV | High |
| Bharti Airtel Limited | 18 | 114 | OV | High |
| Xiaomi Corporation | 30 | 106 | FV | High |
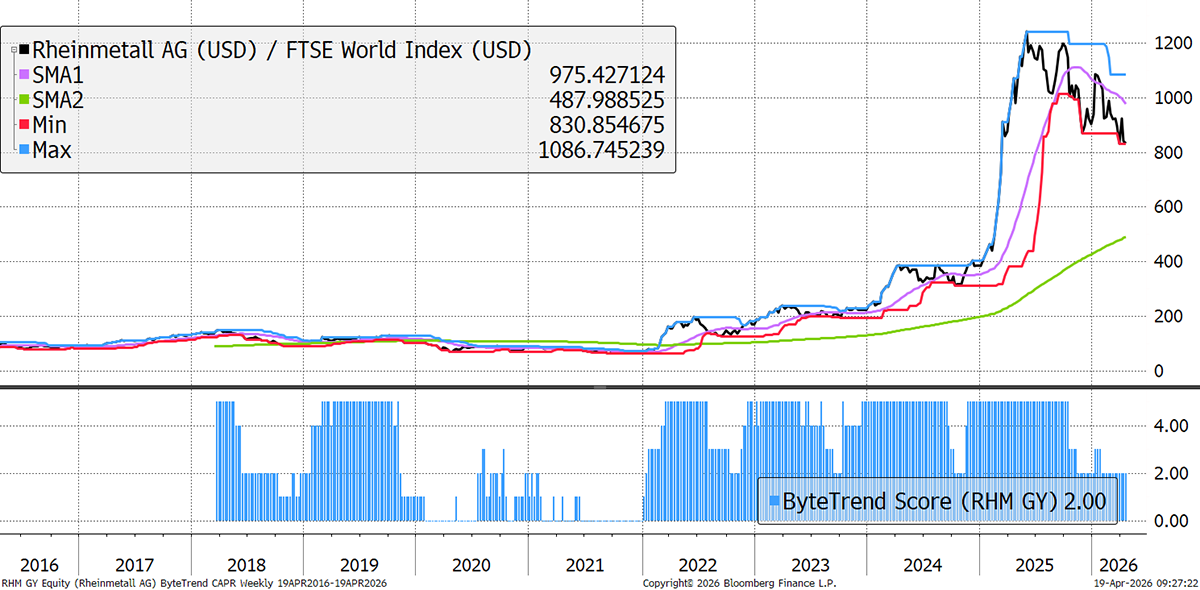
| Rheinmetall AG | 49 | 82 | Exp | High |
| 3M Company | 32 | 81 | OV | Neg |
| O'Reilly Automotive, Inc. | 20 | 79 | OV | Low |
| Cintas Corporation | 23 | 72 | OV | Good |
| Wesfarmers Limited | 20 | 59 | FV | High |
| Electronic Arts Inc. | 16 | 51 | OV | Med |
| Discover Financial Services | 0 | 50 |
Hermès
Luxury has not participated in this rally. This is a low-growth company still priced at 11.4x sales. Its products are in high demand, but the marginal buyer is not the rich but the aspirational. The sector is still under pressure from a weakened consumer.
Rheinmetall
The darling of the Ukraine invasion was rerated from 0.5x sales (20-year average) to 8x. The order book doubled but has since cooled off, although management highlights a strong order book. Cash flow and margins have disappointed, but the company remains a long-term beneficiary of higher European defence spending.
Bear Trends
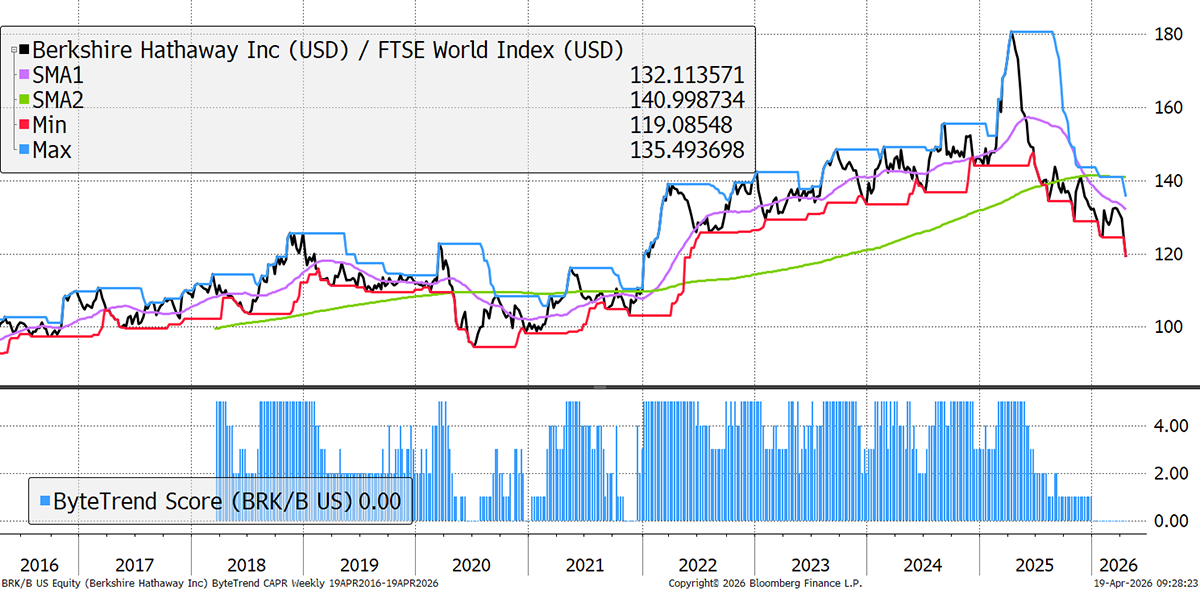
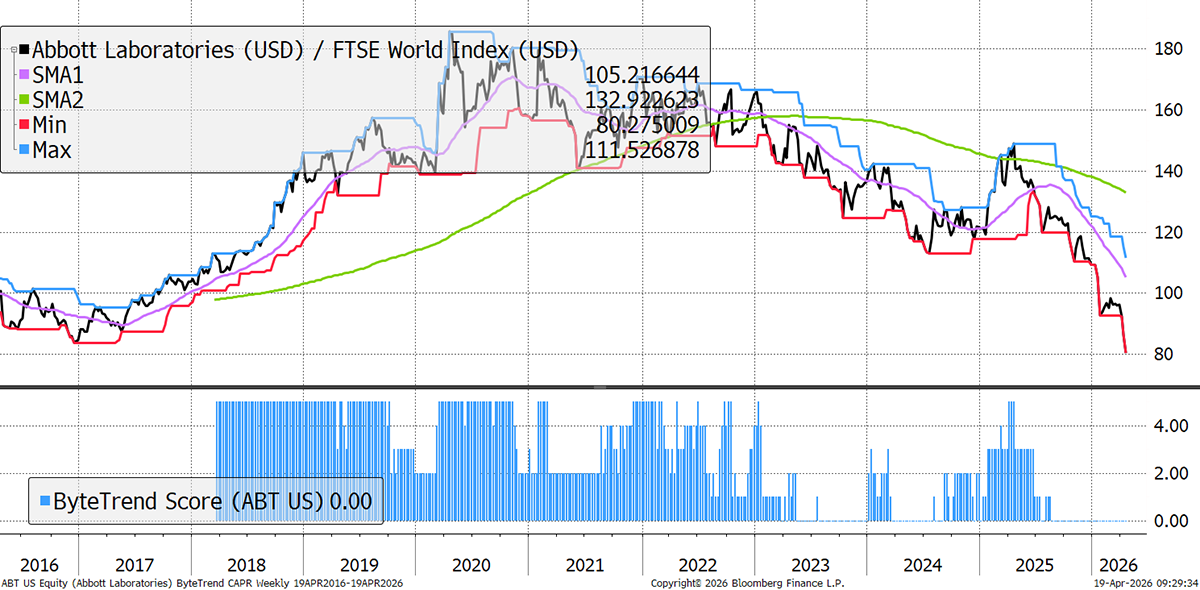
These stocks are trading at the 30-week CAPR lows with a ByteTrend Score of 0. They are in a downtrend. All charts shown are CAPR rebased to 100.
| Name | Annual Vol 30w | Mkt Cap $Bn | Value | Growth |
| Berkshire Hathaway Inc. | 15 | 1023 | OV | Good |
| Visa Inc. | 18 | 611 | FV | Med |
| Tencent Holdings Limited | 25 | 589 | Val | High |
| AbbVie Inc. | 21 | 369 | OV | Neg |
| L'Oréal S.A. | 23 | 224 | FV | Med |
| McDonald's Corporation | 15 | 221 | FV | Med |
| Reliance Industries Limited | 18 | 199 | FV | Good |
| Abbott Laboratories | 21 | 168 | Val | Med |
| The Charles Schwab Corporation | 20 | 162 | FV | High |
| Danaher Corporation | 33 | 138 | FV | Neg |
| HDFC Bank Limited | 19 | 133 | Val | High |
| Stryker Corporation | 22 | 131 | FV | Good |
| Sony Group Corporation | 31 | 128 | OV | Good |
| Unilever PLC | 27 | 127 | ||
| Medtronic plc | 21 | 111 | FV | Low |
| Tata Consultancy Services | 24 | 101 | Val | Med |
| Boston Scientific Corporation | 37 | 95 | Val | High |
| General Dynamics Corporation | 17 | 91 | FV | Med |
| Marsh & McLennan Companies | 19 | 90 | ||
| NTT, Inc. | 13 | 79 | FV | Neg |
| Postal Savings Bank of China | 16 | 71 | FV | Neg |
| Nongfu Spring Co., Ltd. | 26 | 66 | Val | High |
| Deutsche Post AG | 0 | 66 | FV | Neg |
| Hong Kong Exchanges and Clearing | 19 | 66 | FV | High |
| Republic Services, Inc. | 18 | 64 | FV | Good |
| Deutsche Post AG | 0 | 63 | FV | Neg |
| Nintendo Co., Ltd. | 42 | 63 | FV | Neg |
| KDDI Corporation | 19 | 62 | FV | Low |
| Infosys Limited | 26 | 58 | Val | Good |
| Zoetis Inc. | 31 | 52 | Val | Good |
| Danone S.A. | 22 | 51 | FV | Good |
| Samsung Biologics Co.,Ltd. | 36 | 51 | Chp | High |
Berkshire Hathaway
The post-Buffett era has gotten off to a bad start. It is one of the world’s most sought-after defensive stocks that sits on a huge cash pile approaching $400 billion. What will they do with it?
Abbott Labs
Medical devices were strong, but diabetes and diagnostics remain competitive. Nutrition is under pressure. Sales haven’t grown for some time, nor have cash flow or margins. Ex-growth doesn’t go down well in this market.
GTI 200 Spreadsheet
We are pleased to share the GTI 200 spreadsheet. Download the spreadsheet below to view the CAPR and local currency scores, and more, for the world’s largest 200 stocks. Have a look at the different groups and the main list “All stocks”. The Insights tab is interesting, and don’t forget to expand the columns by clicking on the “+” at the top of the page if you want to see more trend data.
Outlook
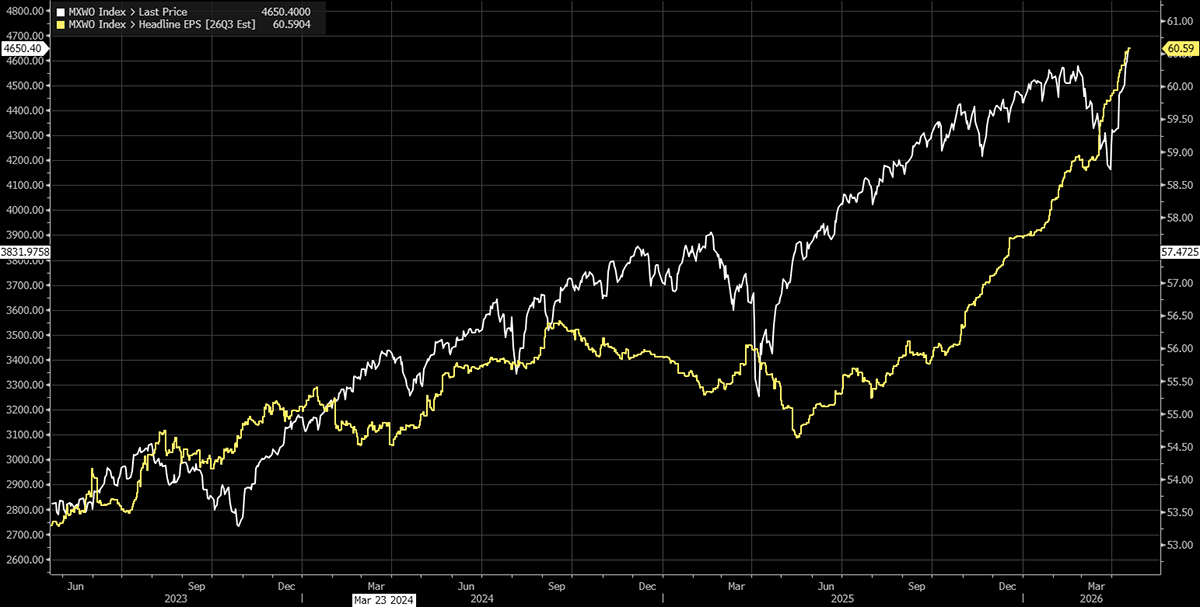
The physical shortage of energy products will start to show up in the coming weeks, which may start to bite. In the meantime, the earnings revisions have been strong, and the money supply remains strong. During the pandemic, the stockmarket roared while the economy was largely closed, and this could be repeated.
Global Equities and Q3 Earnings Expectations
Thanks for reading GTI.


