


Caution Continues


Issue 85
- Market holds up despite very weak breadth
- Bond yield normalisation holds many sectors back
- Opportunities for short sellers
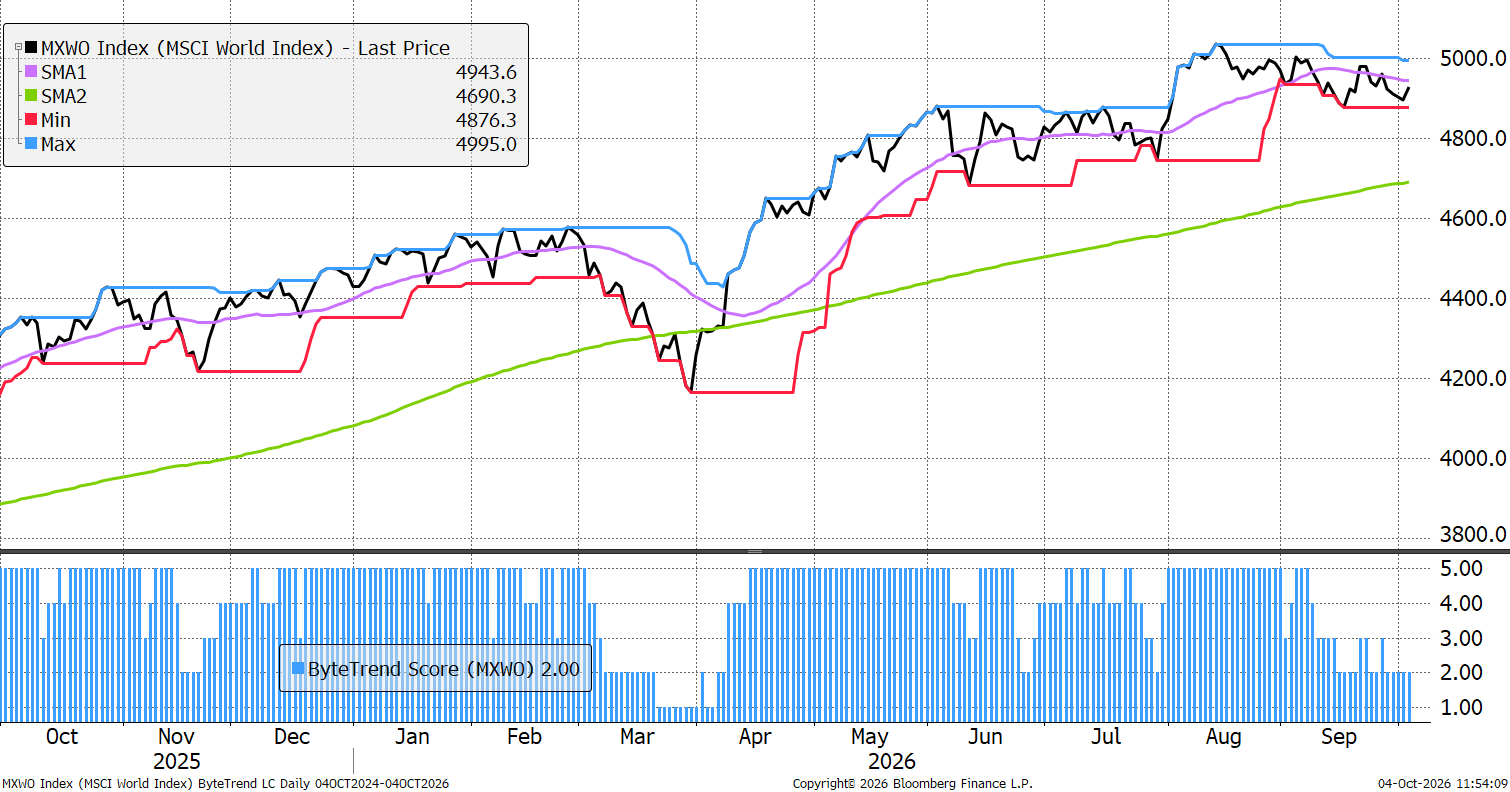
The World Index slides to a ByteTrend Score of 2 in USD. The price is below the 30-day moving average, which is negatively sloping. The last max/min touch was a min, hence a score of 2.
World Index – Developed Markets – Daily
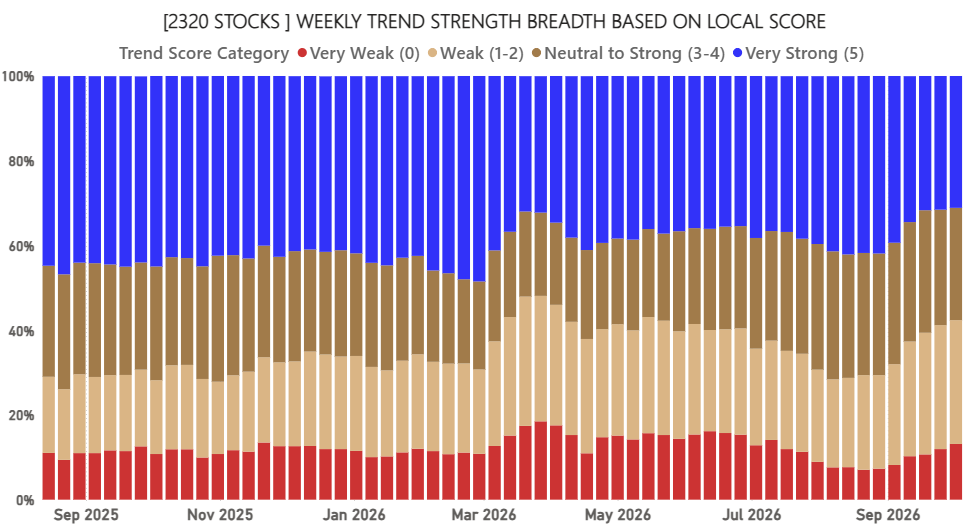
Global Breadth – Local Currency
The price breadth has seen the number of uptrends remain stable, but the downtrends continue to rise, in the face of rising bond yields.
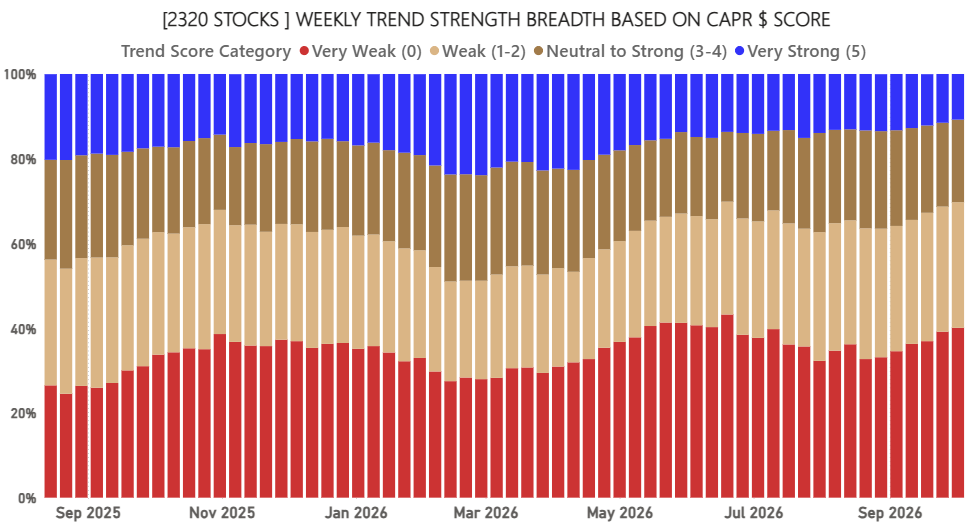
Global Breadth – CAPR
The Alpha breadth in CAPR is down to 10.8% of all stocks, which is historically low. The "Zulu" trends, showing underperformance, are also growing and stand at 40.1%
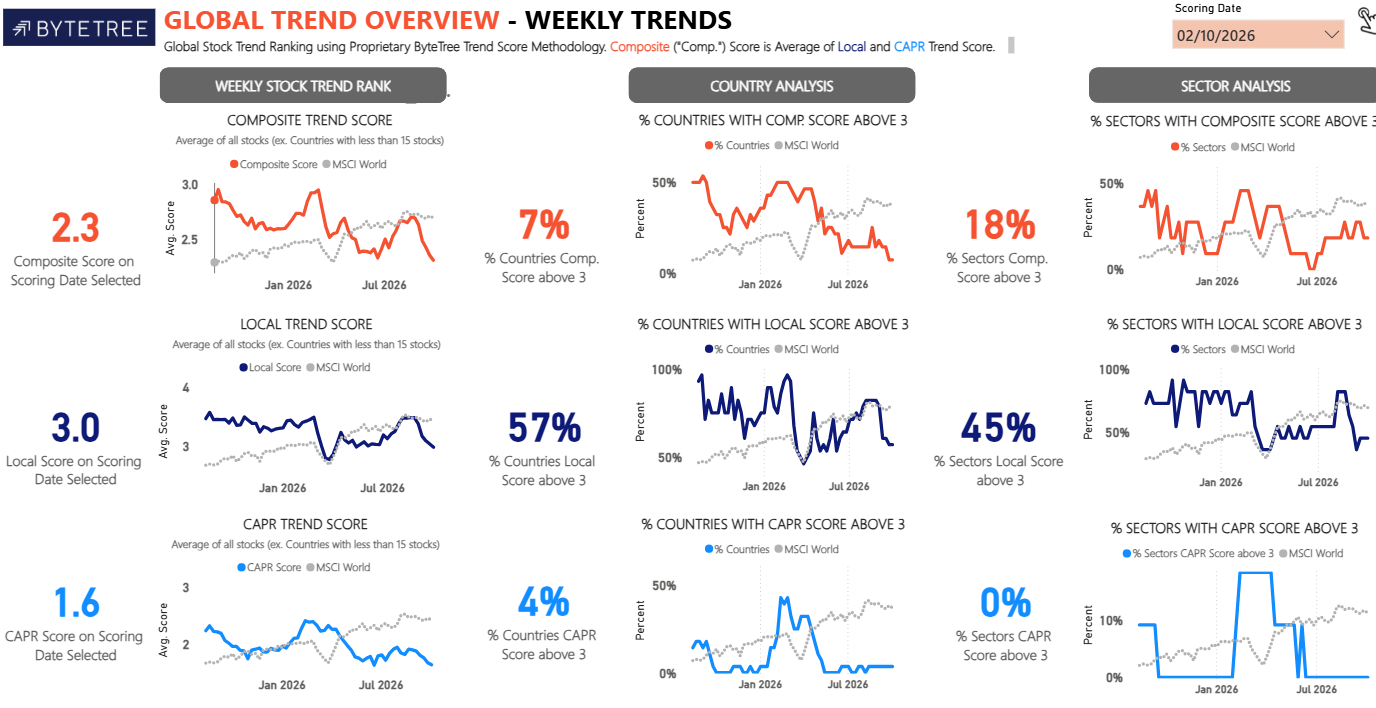
Global Trend Overview
Strong markets, with an average CAPR trend score above 3, are rare. Just 4% of countries (aka Taiwan) and 0% of sectors! It’s tough out there.
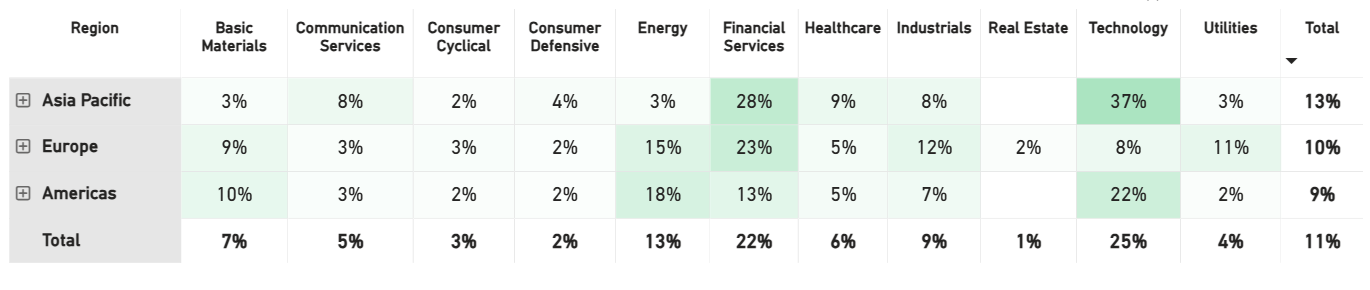
Net Winners
The leading group of stocks remains dominated by financial services, tech and energy, but financials are down 6 points from last week. Basic Materials is up strongly.
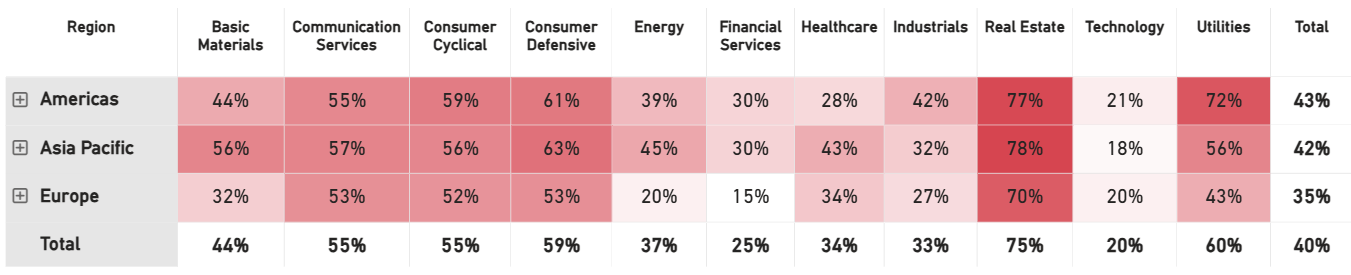
Net Losers
The lagging group of stocks is huge, making up 40% of the global stockmarket. Rate sensitive sectors such as the consumer, real estate, utilities and telecoms dominate the list. Interestingly, Europe has the lowest weight in losers.
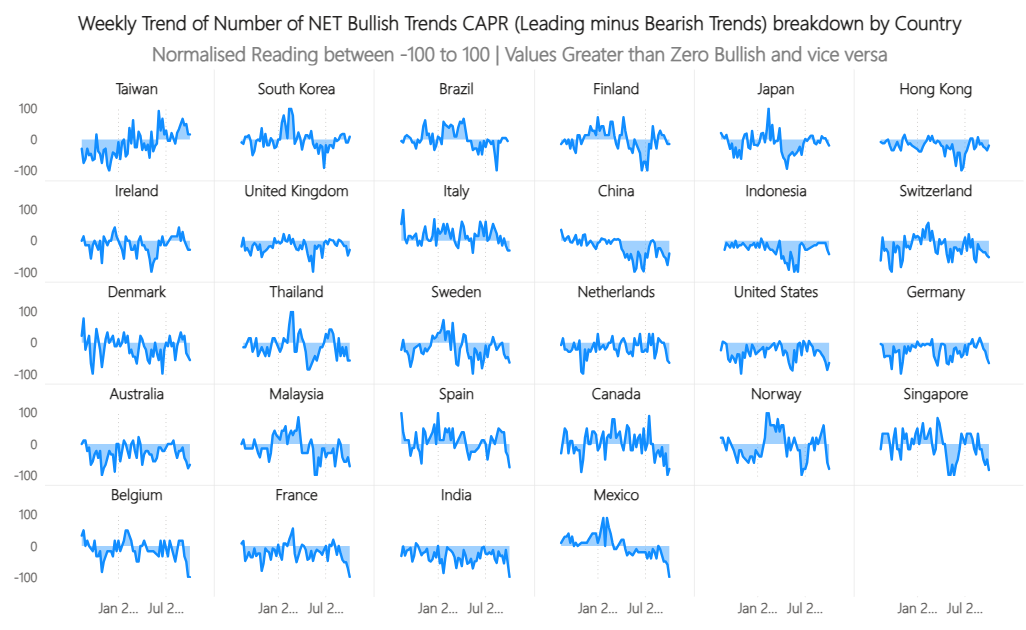
Net Bullish Trends by Country
Chip producing nations have fared well, but most countries had a bad time last week, especially Belgium, France, India and Mexico.
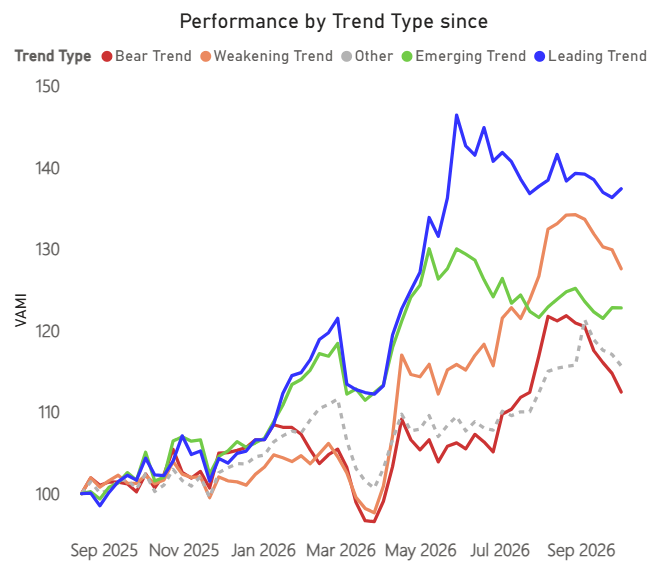
Trend Type Performance
Like last week, the number of leading trends has fallen off a cliff, while emerging trends are already rare. The rotation of May is over. In contrast, weakening and bear trends are exploding.
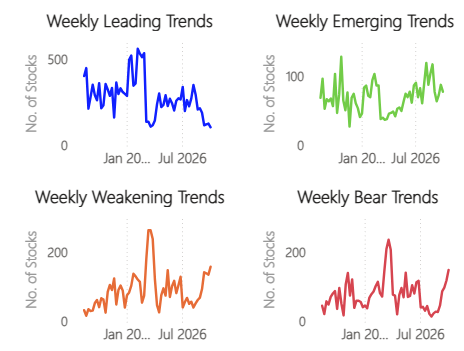
The leaders are low in number but they are holding up. The weakening and bear stocks are under pressure.
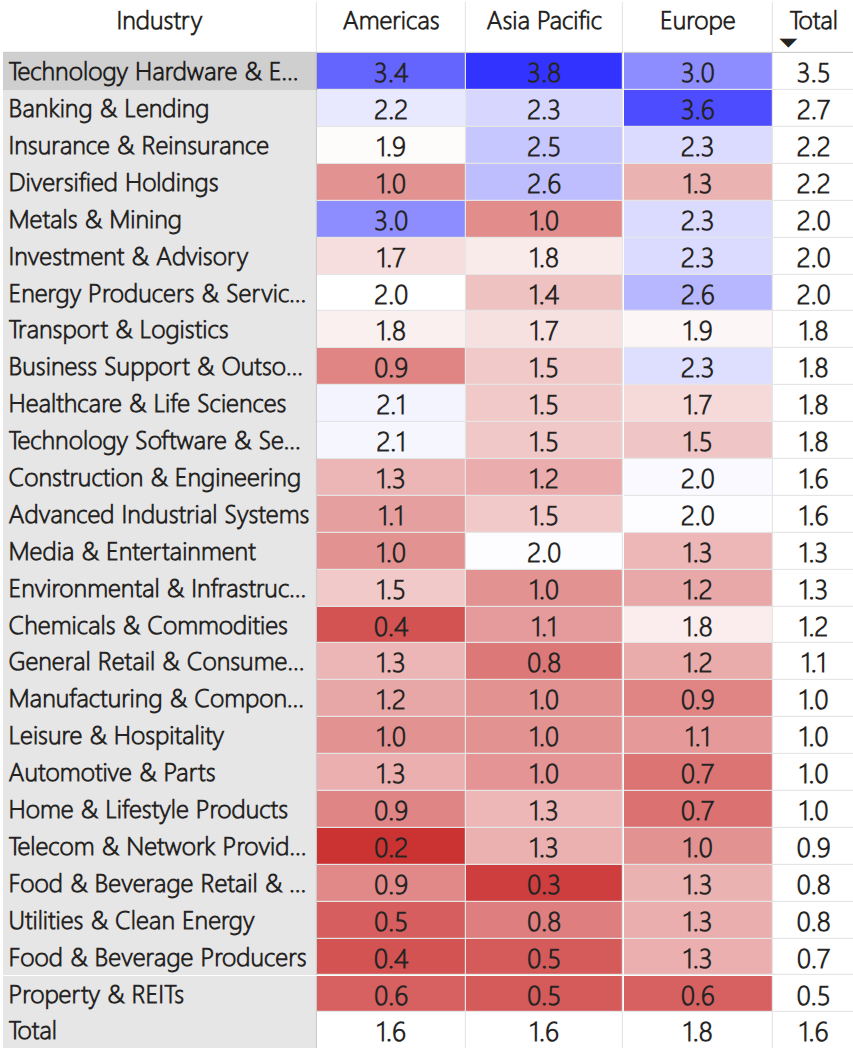
Regions and Industries Average Relative Score
This table (below) shows the average CAPR score for each global industry, by region and in total.
Tech Hardware is not getting the bearish memo. These are the companies the hyperscaler’s capex is flowing into. As a group, Hardware strengthened this week and widened the gap at the top. The resilience in the face of high valuations is impressive. This has coincided with a weak period for Software, as they appear to be competing for the same capital. When Hardware weakens, Software gains, and vice versa. Financials also remain strong, led by the European banks. Energy and commodities are the final industries to offer broad momentum.
The bottom half of the table is where the rest of the action is. So many industries are weak and weakening. The consumer is already weak and under increasing pressure from rising rates. From chocolate to cars to high fashion, everything is weak. Property, Telecoms, and Utilities are rate-sensitive sectors, and natural losers in this environment, but will make for a rich hunting ground if rates turn.
User Guide
Refer to our GTI: User Guide for an overview of the key concepts and terminology used in this report. These concepts may take a little bit of getting used to, but they are very powerful once you do.
ByteTrend Stock Signals
The stocks and signals can be found at the new trend following platform:
Outlook
Global Trends Investor will no longer cover individual stocks, which will move elsewhere. This market is thin, and there is little to say, as there are no new uptrends. Keep your eyes on the bond market.
Thanks for reading Global Trends.


