


Alpha Drought


Issue 84
- Big stocks prop up the market
- Bond yields remain a concern
- Thinnest leadership since Global Trends began in April 2025
Introducing ByteTrend.io
Our key project this year has been to transform our Global Trends dataset from a spreadsheet into an online platform. I am delighted to announce that ByteTrend.io is now live.
ByteTrend.io is much more than a simple digital reproduction of our GTI spreadsheets. We have expanded the Global Trends universe from 2,500 stocks to over 4,000, with many more to be added in due course. Additionally, ByteTrend tracks 1,200 ETFs, 32 commodities, 35 currencies, and 178 digital assets. All assets are now updated daily and are accessible 24/7, another key improvement from the weekly distribution of the spreadsheet.
We will continue to publish the week’s most notable trends in this free note, which will be rebranded from GTI: Top 200 to Global Trends Investor. While the structure will remain the same, we will replace the spreadsheet and tables with insights from ByteTrend.io. Please look out for an update later this week with more information.
Creating a free account on ByteTrend.io will give you access to the top 200 stocks in our Global Trends universe. For full access, upgrade to one of our paid tiers:
- Screens at $25/month, giving you full access to the dataset on the online platform.
- Analyst at $100/month, giving you everything in Screens, plus API and MCP feeds to download and shape the data yourself: powerful if you use Excel, Python, or an AI tool.
By upgrading, you will unlock the true power of ByteTrend. The platform’s interface has been intuitively designed to allow you to quickly screen for notable trends and your favourite assets directly in your browser window. To take this further, use our API to shape the data to your liking, or connect our MCP server to your preferred AI tool.
Not every signal leads to a winning trend, but every winning trend starts with a signal. ByteTrend is the compass that shows you where to focus. Start by creating an account today:
Now, back to today’s note.
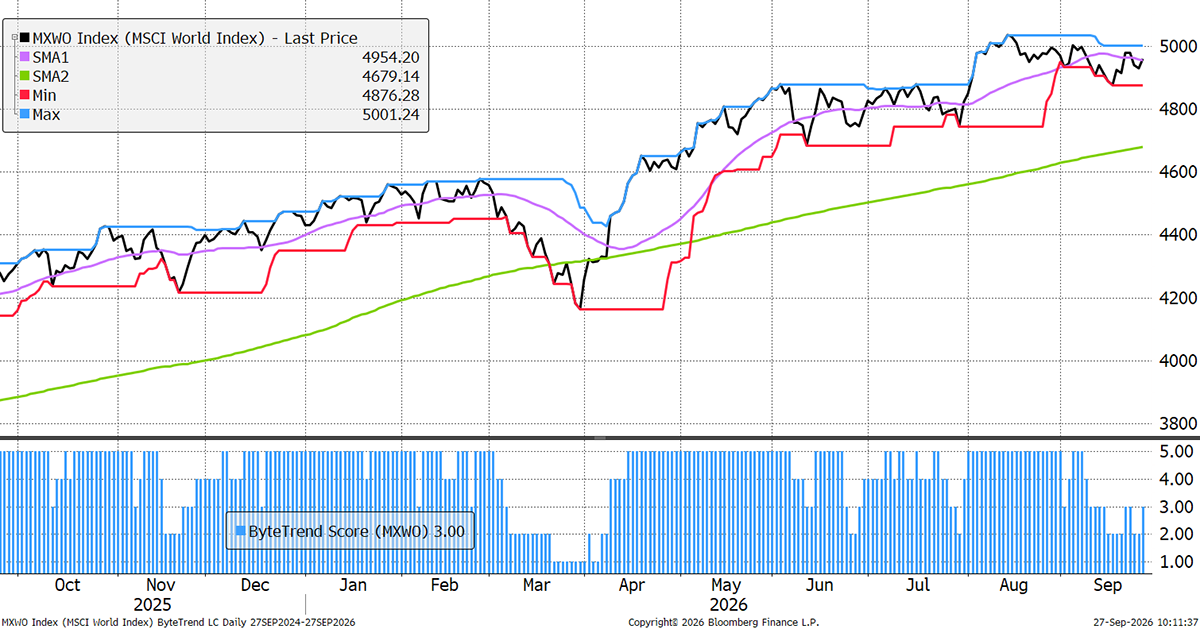
World Index – Developed Markets – Daily
The World Index holds a ByteTrend Score of 3 in USD. The weakness from recent weeks has paused.
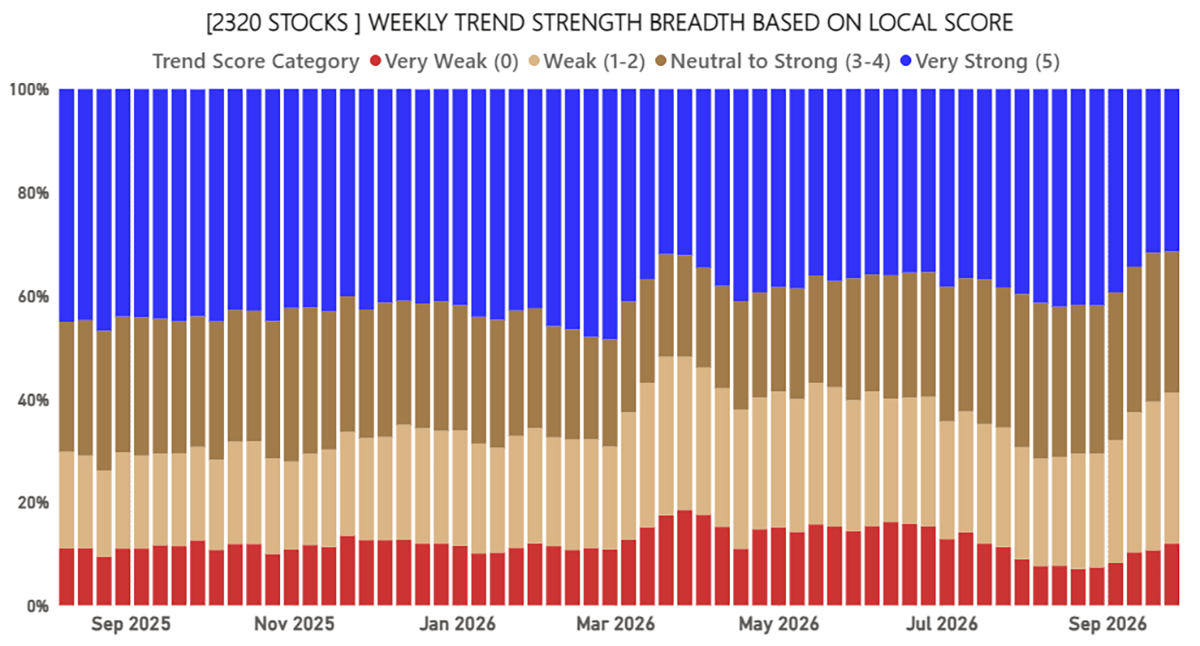
Global Breadth – Local Currency
The breadth chart has the same number of winners after four slowing weeks, but the bears have increased slightly.
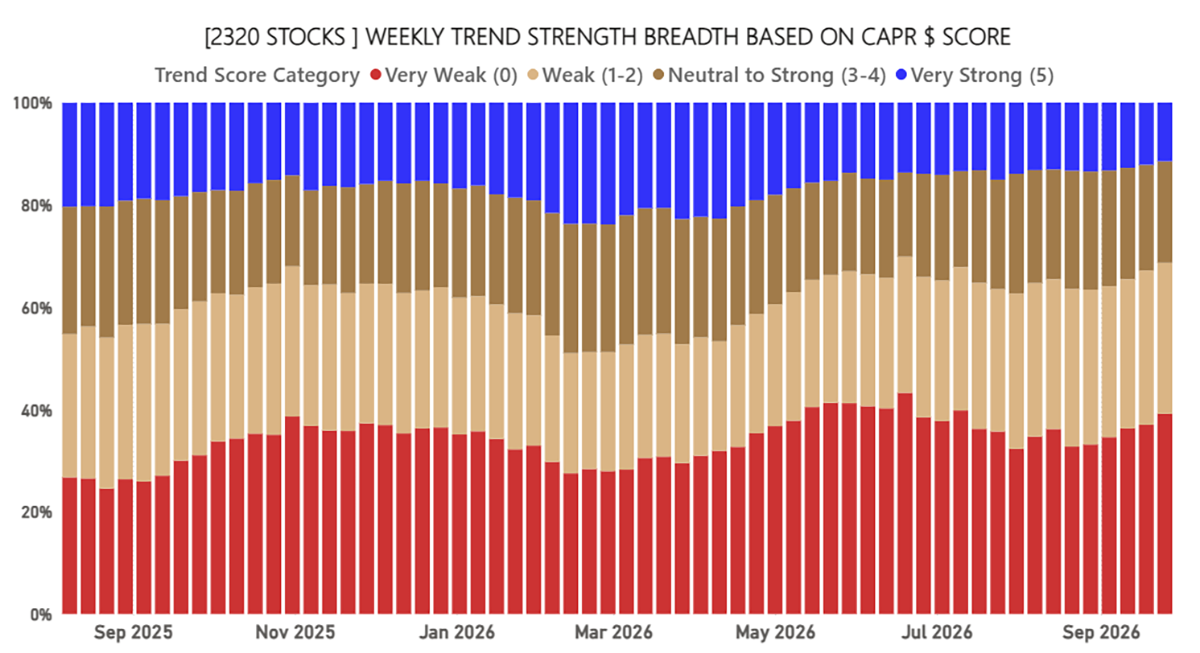
Global Breadth – CAPR
The alpha breadth, showing stocks beating the market, is back to extremely low levels. Currently, 39.1% of stocks are underperforming (red), and another 29.5% are lagging slightly.
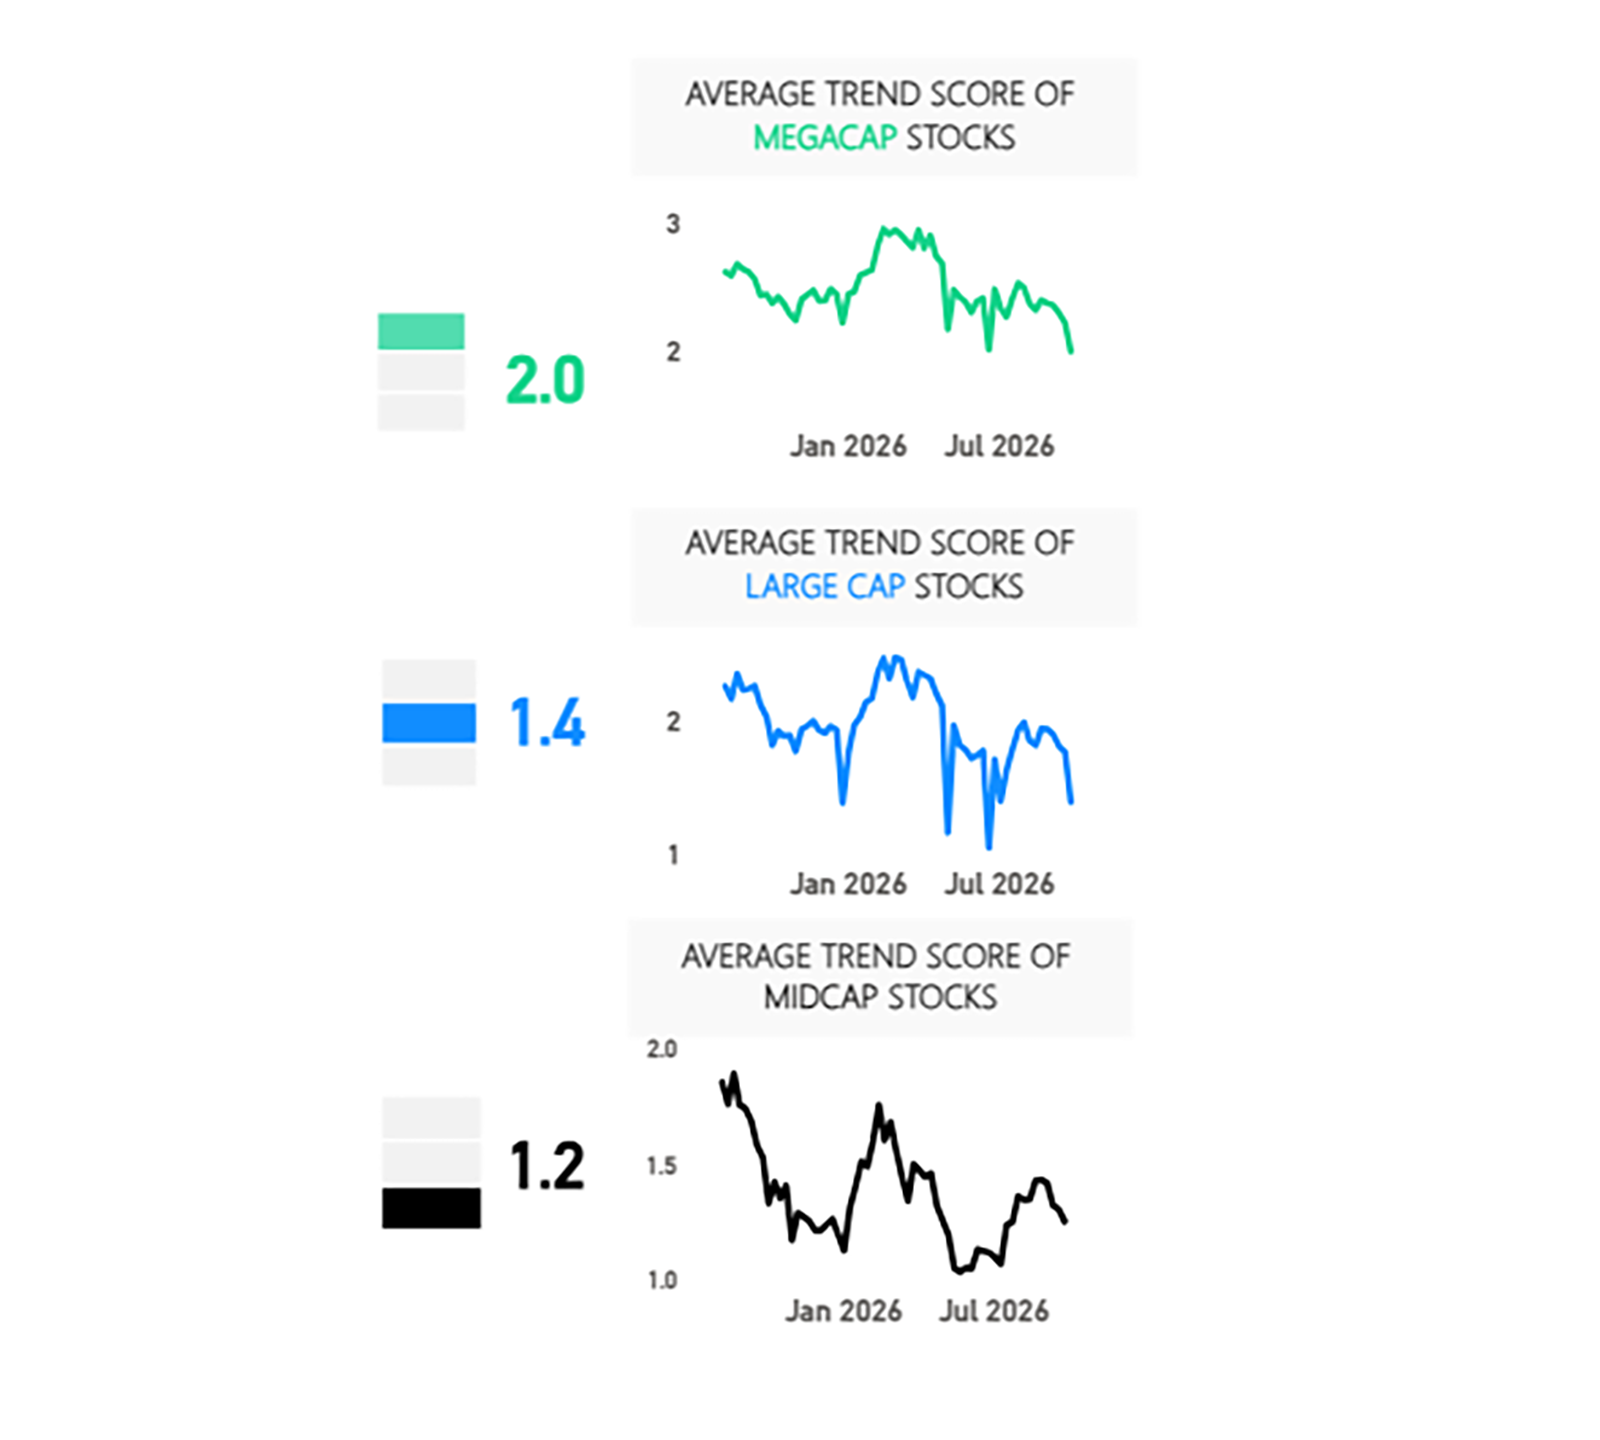
Global Breadth by Size
Breadth is falling but is most notable by size. The mega-caps have an average CAPR score of 2, large-caps 1.4, and mid-caps 1.2. There is no question about size still mattering in this market.
Net Winners
The leading group of stocks remains dominated by financial services, tech and energy.

Trend Type Performance
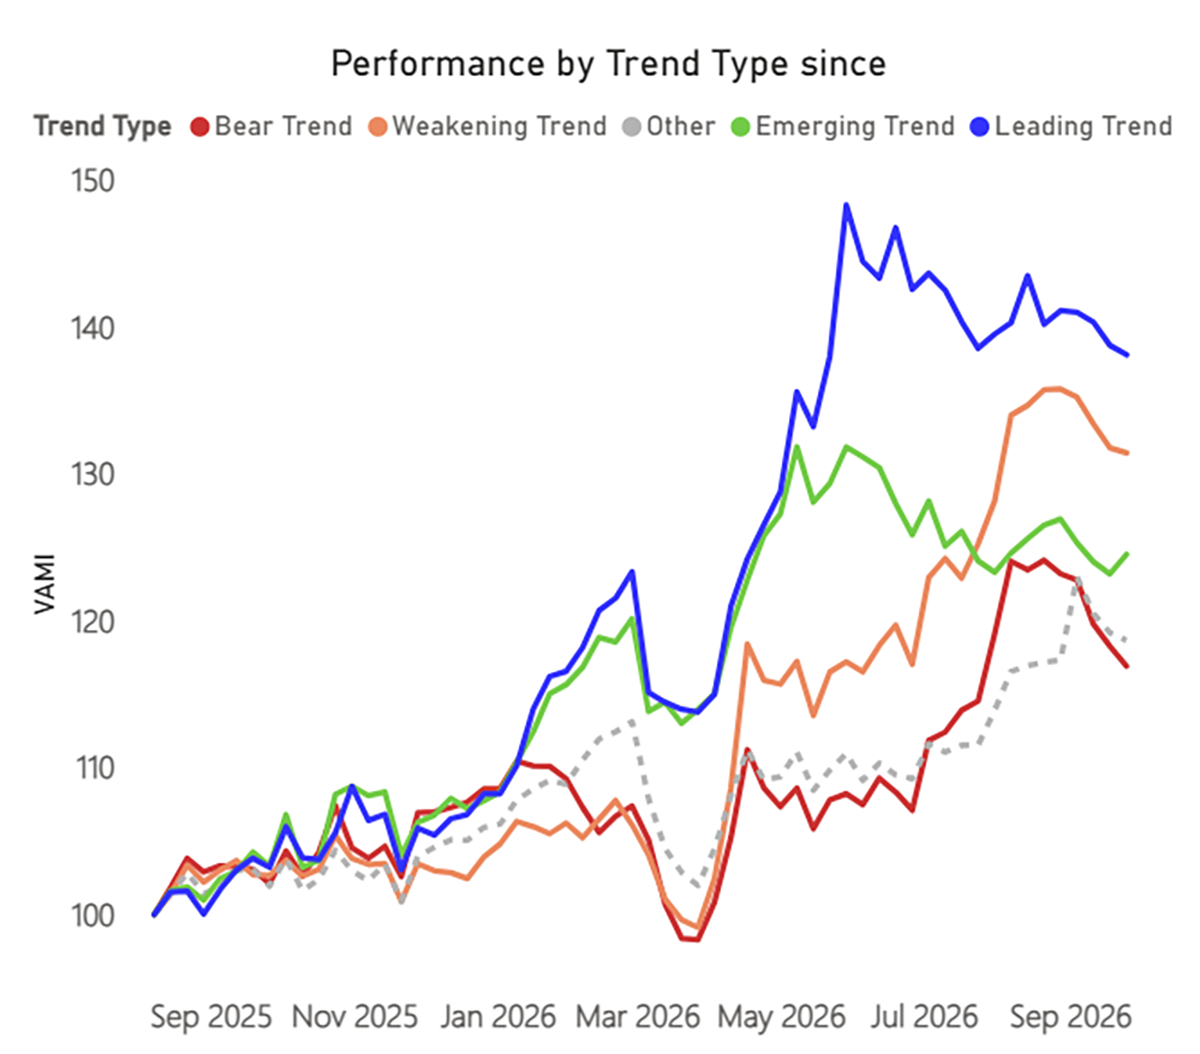
Leading trends have dropped off a cliff, while bear trends are nearing highs.
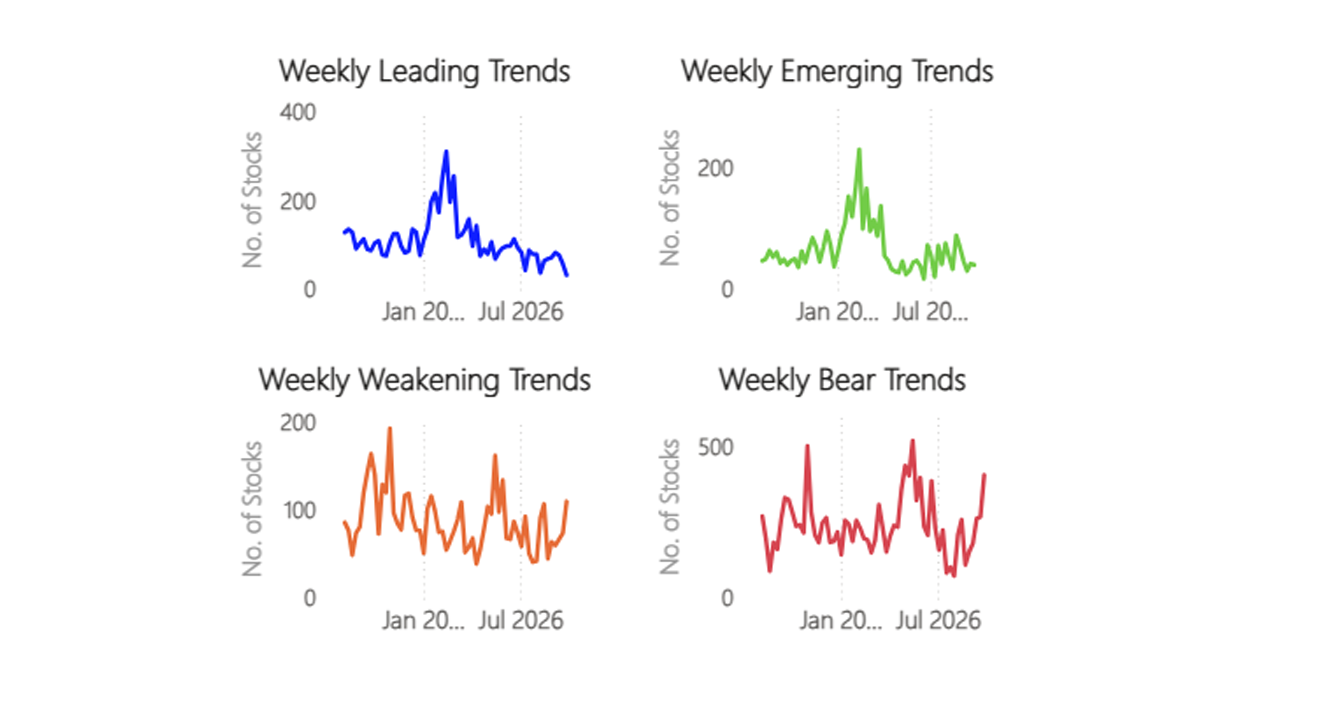
Overall, performance is waning across all groups, although emerging trends have made some ground.
Regions and Industries Average Relative Score
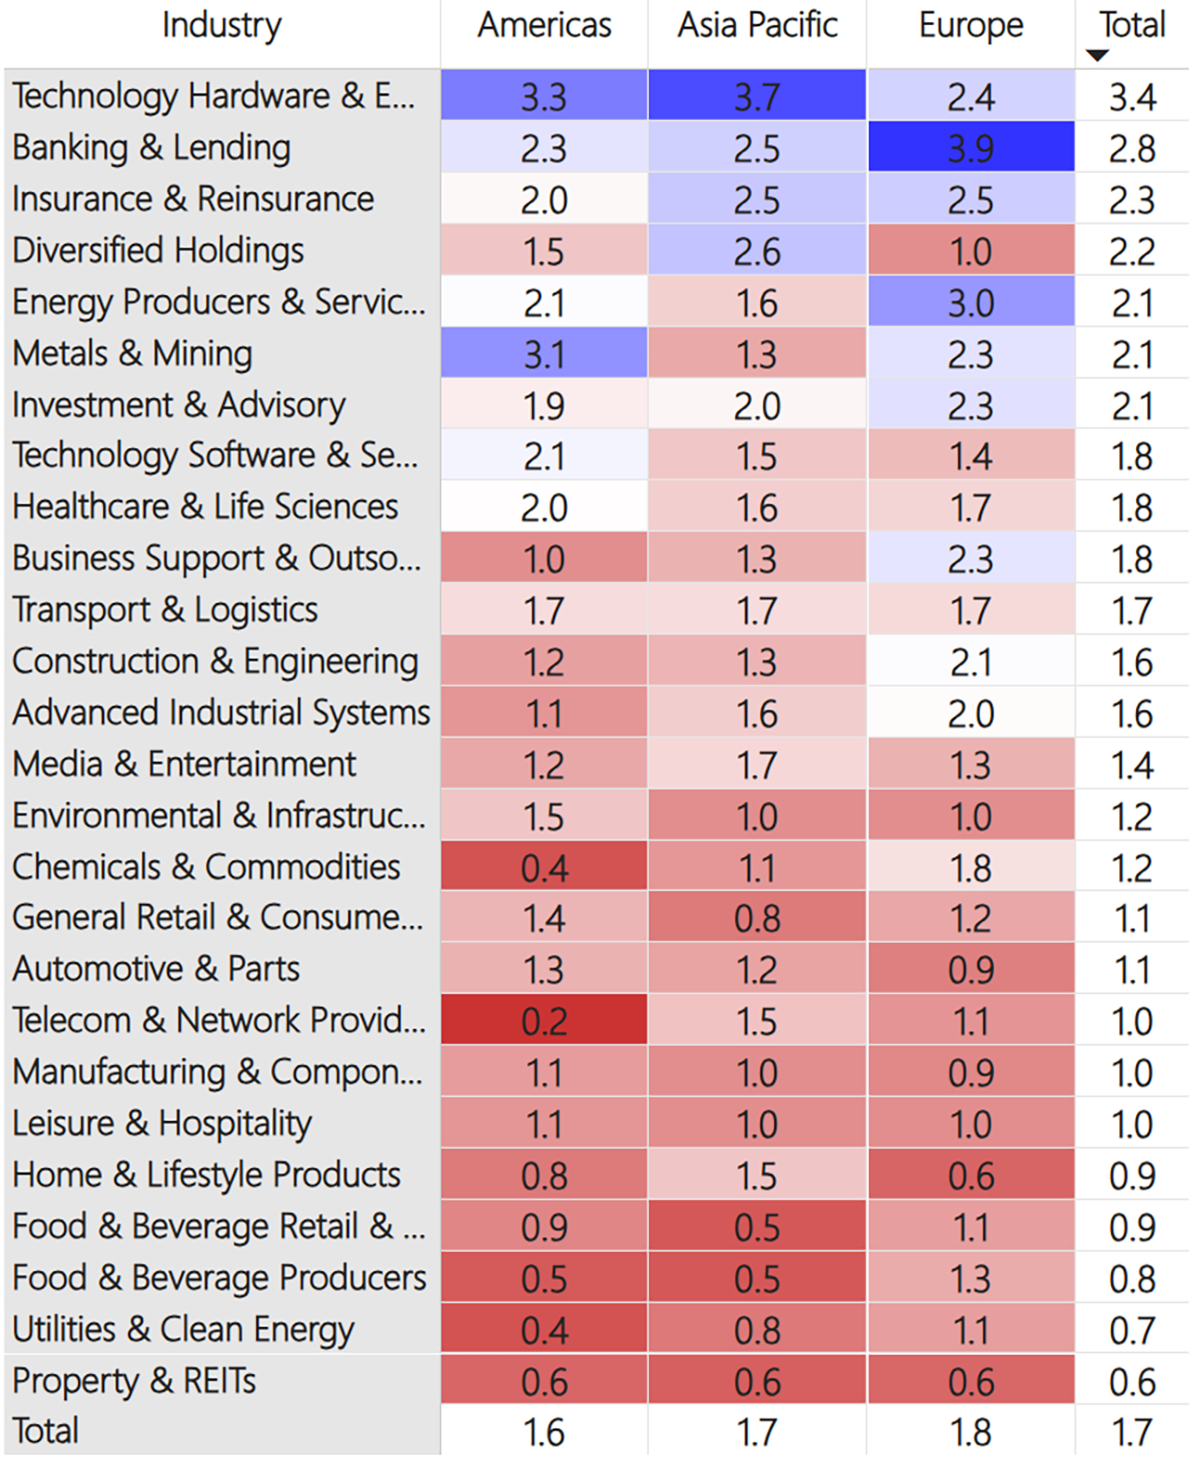
This table (below) shows the average CAPR score for each global industry, by region and in total.
At the top of the table, Tech Hardware keeps its crown. In Europe, it is closer to average. Despite rising interest rates, which should increase their income, Insurance stocks fell slightly again last week. Within financials, Investment stocks are sliding more seriously now.
In the middle of the table, Software’s impressive comeback is taking a pause, as it has fallen for a few weeks now. Construction, Autos, and Advanced Industrials are the most notably weakening industries here, with their average trend scores declining for over six months.
Finally, at the bottom of the table, REITs and Utilities are really suffering from the interest rate panic of the last few weeks. Food & Beverage aren’t faring much better, and all these weak sectors are only getting weaker – a bad sign.
User Guide
Refer to our GTI: User Guide for an overview of the key concepts and terminology used in this report. These concepts may take a little bit of getting used to, but they are very powerful once you do.
Leading Trends with New Highs
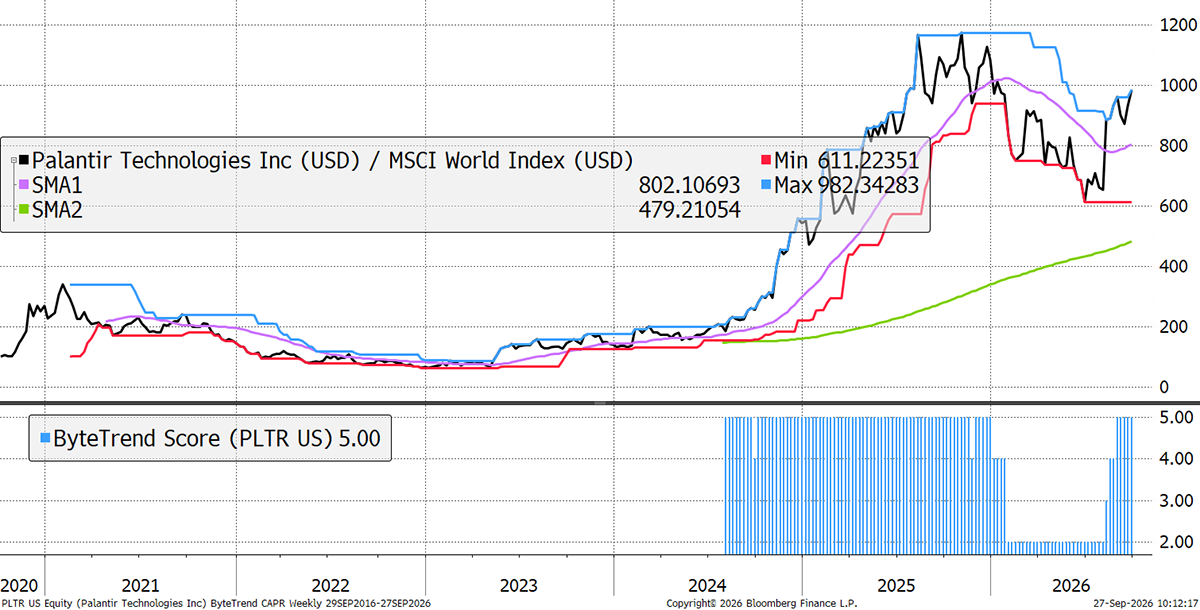
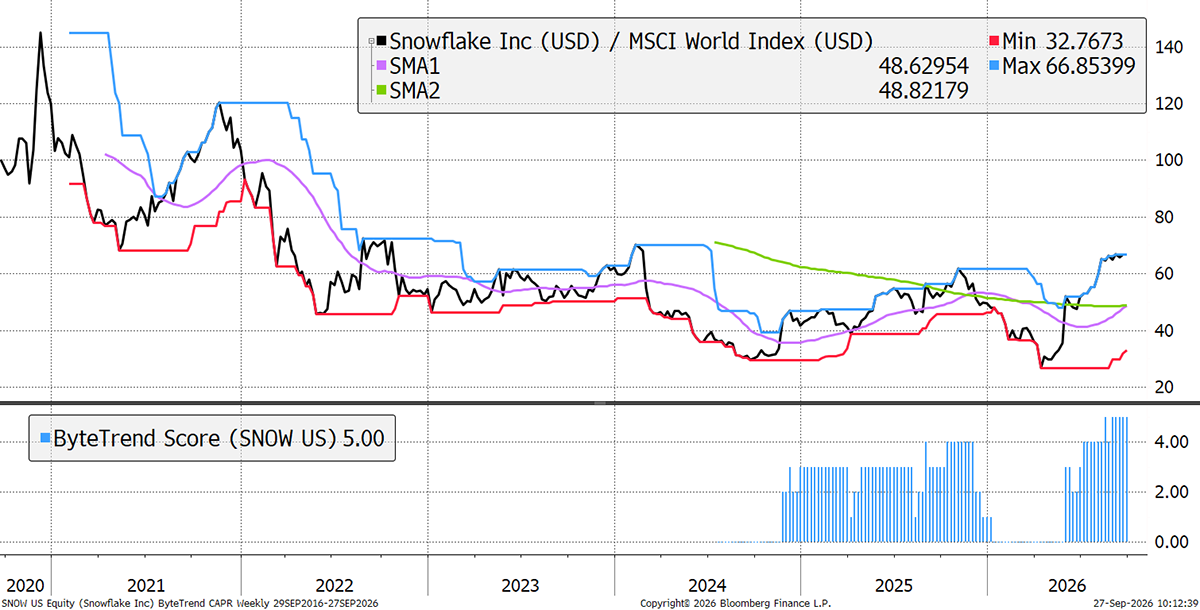
These stocks are trading at the 30-week CAPR highs with a ByteTrend Score of 5. All charts shown are CAPR rebased to 100.
| Name | Annual Vol 30w | Mkt Cap $Bn | Industry |
| Advanced Micro Devices, Inc. | 66 | 1028 | Technology Hardware & Equipment |
| Palantir Technologies Inc. | 76 | 435 | Technology Software & Services |
| MediaTek Inc. | 88 | 266 | Technology Hardware & Equipment |
| Arista Networks, Inc. | 52 | 260 | Technology Hardware & Equipment |
| CrowdStrike Holdings, Inc. | 60 | 257 | Technology Software & Services |
| Fortinet, Inc. | 51 | 127 | Technology Software & Services |
| Cloudflare, Inc. | 60 | 124 | Technology Software & Services |
| Snowflake Inc. | 80 | 116 | Technology Software & Services |
| ASE Technology Holding Co., Ltd. | 46 | 97 | Technology Hardware & Equipment |
| Hewlett Packard Enterprise Company | 54 | 83 | Technology Hardware & Equipment |
| WuXi AppTec Co., Ltd. | 42 | 77 | Healthcare & Life Sciences |
| Unimicron Technology Corp. | 81 | 59 | Technology Hardware & Equipment |
| A.P. Møller - Mærsk A/S | 44 | 52 | Transport & Logistics |
Palantir
Palantir never even fell back to its long-term trend, beginning a new, even steeper uptrend in the last few weeks. It builds software that pools an organisation's scattered data into one place and lets non-technical staff analyse and act on it. It began with defence and intelligence agencies, but the growth now comes from American companies, where sales rose 149% last quarter. Group revenue nearly doubled, up 93% to $1.9bn, with free cash flow margins above 60%. The risk is the price, at around 55 times this year's sales, which leaves no room for growth to slow.
Snowflake
Snowflake stores company data in the cloud and charges for the computing power used to analyse it. Buffett famously bought into the Snowflake IPO. I say famously, because it has nothing in common with most of his previous investments. High growth but richly valued, it followed the classic hot IPO pattern of spiking, then grinding lower for a few years. Now, continued strong results and raised guidance, from a lower base, have revived it.
New Leading Trends
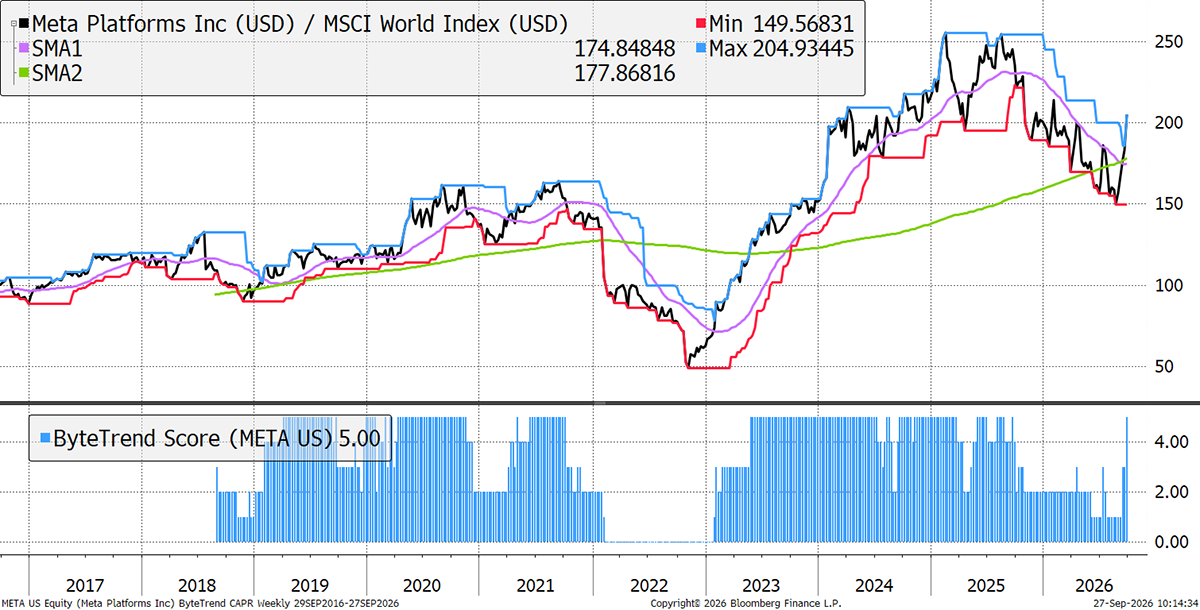
These stocks are trading at the 30-week CAPR highs with a ByteTrend Score of 5, except they are new trends this week, having previously had a score below 5. All charts shown are CAPR rebased to 100.
| Name | Annual Vol 30w | Mkt Cap $Bn | Industry |
| Meta Platforms, Inc. | 49 | 1915 | Technology Software & Services |
Meta Platforms
It wasn’t quite Steve Jobs and the iPhone, but Meta’s launch of its AI agent Muse was certainly a significant moment. It can haggle with insurers and book local tennis courts for you, switch utility plans or claim money back for delayed flights. It comes as an App or a device, and people have been sharing remarkable stories of its capabilities online. It’s the closest thing yet to a genuinely useful virtual PA, and it has sent the Meta stock soaring once again.
Emerging Trends
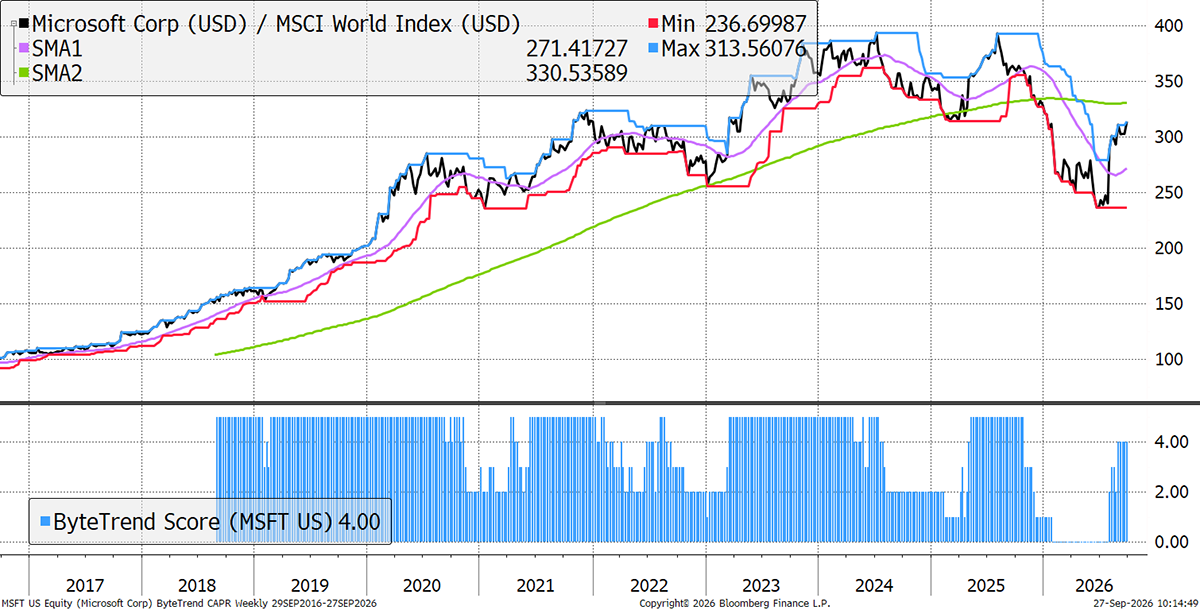
These stocks are trading at the 30-week CAPR highs with a ByteTrend Score of less than 5. They don’t have to be in an uptrend, just emerging. All charts shown are CAPR rebased to 100.
| Name | Annual Vol 30w | Mkt Cap $Bn | Industry |
| Microsoft Corporation | 44 | 3833 | Technology Software & Services |
| Thermo Fisher Scientific Inc. | 34 | 250 | Healthcare & Life Sciences |
| Deere & Company | 30 | 186 | Environmental & Infrastructure Services |
| Danaher Corporation | 35 | 158 | Healthcare & Life Sciences |
| Moderna, Inc. | 184 | 79 | Healthcare & Life Sciences |
Microsoft
Capex fears have given way to the fear of missing out at Microsoft, as the big tech stocks of old reassert their dominance. They were sold to fund purchases of tech hardware stocks, but capital is rotating back into the original tech darlings – the Magnificent 7. Microsoft’s cloud platform Azure, which rents server capacity to AI and other companies, grew more than 40% in the latest quarter, surpassing $100bn in annual revenue. The risk is OpenAI, which accounted for a quarter of Azure sales on its own.
Weakening
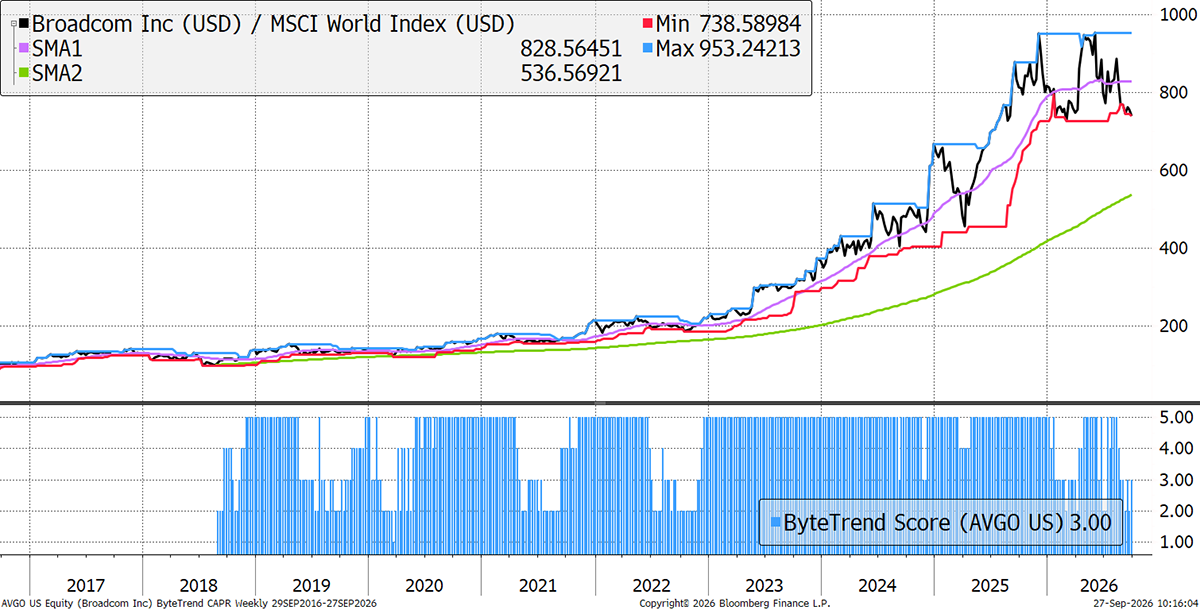
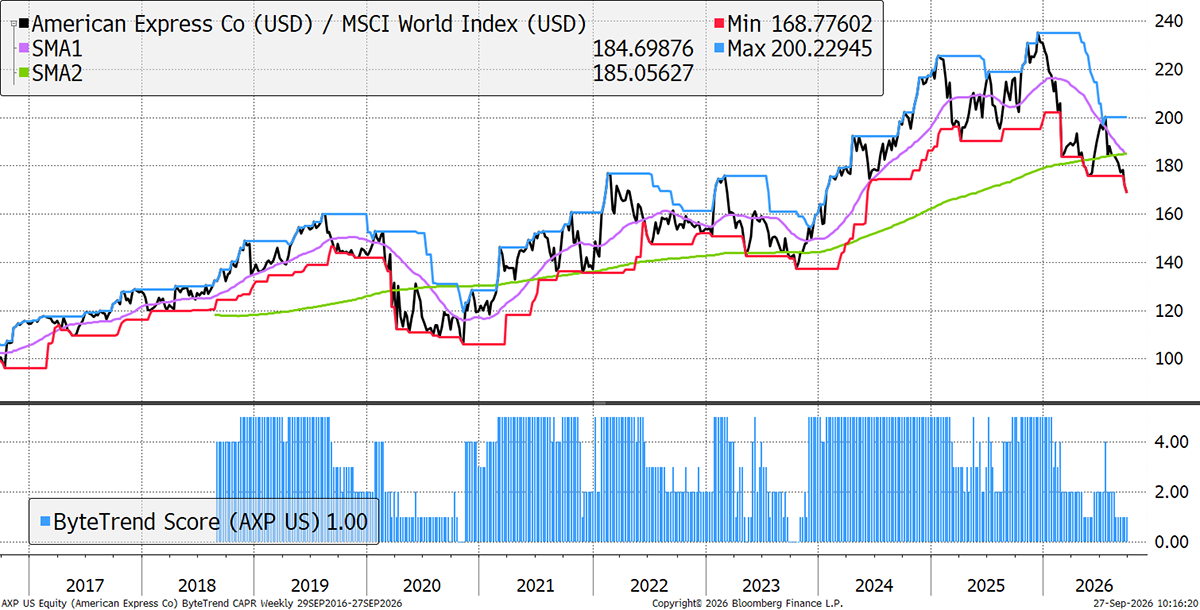
These stocks are trading at the 30-week CAPR lows with a ByteTrend Score above 0. They are weakening trends but not yet downtrends. All charts shown are CAPR rebased to 100.
| Name | Annual Vol 30w | Mkt Cap $Bn | Industry |
| Broadcom Inc. | 49 | 1679 | Technology Hardware & Equipment |
| American Express Company | 22 | 209 | Banking & Lending |
| Siemens Energy AG | 41 | 139 | Construction & Engineering |
| British American Tobacco p.l.c. | 34 | 119 | Home & Lifestyle Products |
| Bharti Airtel Limited | 20 | 116 | Telecom & Network Providers |
| Enel S.p.A. | 21 | 101 | Utilities & Clean Energy |
| NetEase, Inc. | 33 | 74 | Media & Entertainment |
| Cummins Inc. | 33 | 72 | Construction & Engineering |
| Engie S.A. | 24 | 68 | Utilities & Clean Energy |
| FedEx Corporation | 25 | 68 | Transport & Logistics |
| AB Volvo | 28 | 67 | Construction & Engineering |
| Royal Caribbean Cruises Ltd. | 35 | 65 | Leisure & Hospitality |
| TC Energy Corporation | 25 | 61 | Energy Producers & Services |
| PACCAR Inc | 26 | 59 | Construction & Engineering |
| CRH plc | 34 | 57 | Construction & Engineering |
| Hyundai Motor Company | 63 | 53 | Automotive & Parts |
| Rheinmetall AG | 58 | 52 | Advanced Industrial Systems |
| E.on Se | 26 | 51 | Utilities & Clean Energy |
Broadcom
Broadcom isn’t in the informal “Magnificent 7” category, but it is the sixth-largest company in America by market cap, having soared past Tesla and Meta during this AI-driven bull market. It designs the custom AI chips that Google, Meta and OpenAI use instead of buying generic ones from Nvidia. It also offers VMware, the software that runs corporate data centres. Revenue rose 85% last quarter, AI chip sales more than tripled to $16.7bn, and they expect $115bn of AI revenue next year. However, fourth-quarter guidance only matched expectations, contributing to the recent weakness.
American Express
Another Buffett stock, Amex is seeing continued growth in card spending. However, higher rates are a challenge for its client base, as they could increase the amount of debt they can’t repay. High rates hurt indebted consumers the most, and while Amex skews higher on the economic spectrum, its high valuation leaves little room for a slowdown.
Bear Trends
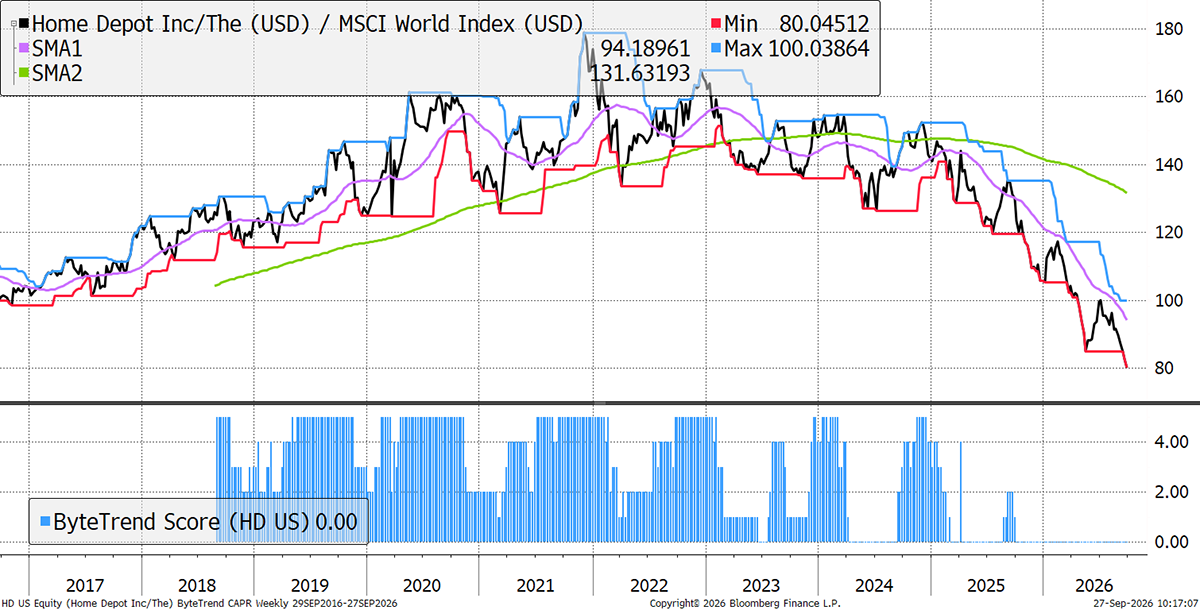
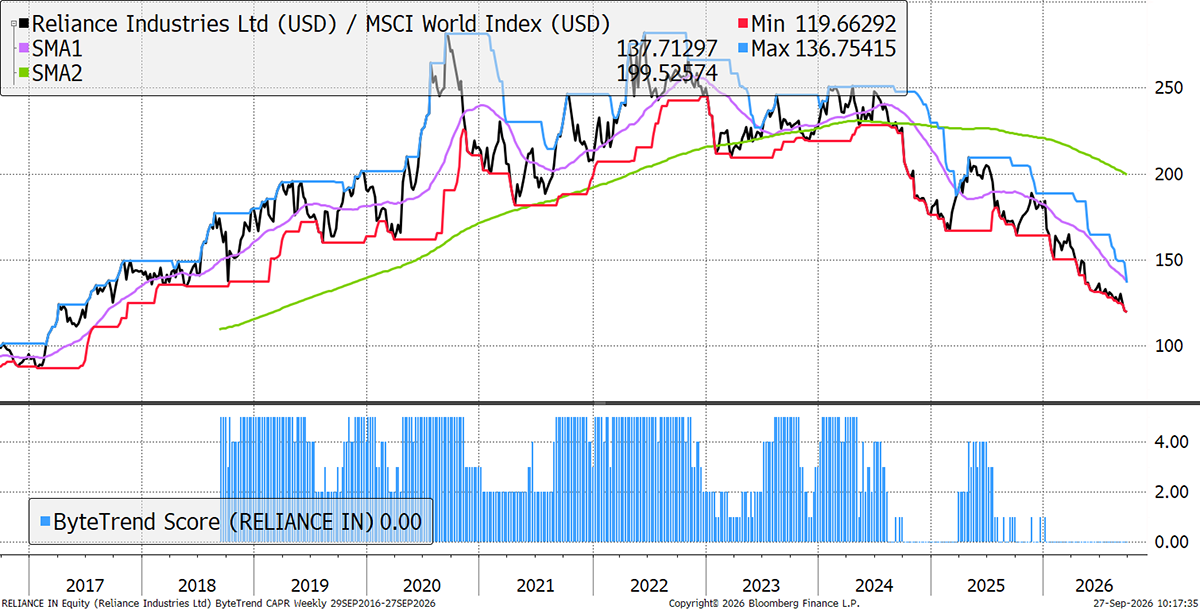
These stocks are trading at the 30-week CAPR lows with a ByteTrend Score of 0. They are in a downtrend. All charts shown are CAPR rebased to 100.
| Name | Annual Vol 30w | Mkt Cap $Bn | Industry |
| Roche Holding AG | 10 | 310 | Healthcare & Life Sciences |
| The Home Depot, Inc. | 27 | 292 | Home & Lifestyle Products |
| Nestlé S.A. | 21 | 240 | Food & Beverage Producers |
| LVMH Moët Hennessy - Louis Vuitton, Société Européenne | 26 | 223 | Home & Lifestyle Products |
| T-Mobile US, Inc. | 25 | 177 | Telecom & Network Providers |
| Commonwealth Bank of Australia | 22 | 177 | Banking & Lending |
| PepsiCo, Inc. | 17 | 176 | Food & Beverage Producers |
| Reliance Industries Limited | 20 | 173 | Energy Producers & Services |
| Novo Nordisk A/S | 34 | 171 | Healthcare & Life Sciences |
| McDonald's Corporation | 17 | 168 | Food & Beverage Producers |
| Hermès International S.C.A. | 31 | 161 | Home & Lifestyle Products |
| NextEra Energy, Inc. | 17 | 159 | Utilities & Clean Energy |
| The Boeing Company | 34 | 157 | Advanced Industrial Systems |
| Anheuser-Busch InBev SA/NV | 29 | 152 | Food & Beverage Producers |
| Prologis, Inc. | 20 | 124 | Property & REITs |
| Lockheed Martin Corporation | 35 | 120 | Advanced Industrial Systems |
| PDD Holdings Inc. | 31 | 110 | General Retail & Consumer Goods |
| Starbucks Corporation | 27 | 108 | Food & Beverage Producers |
| Lowe's Companies, Inc. | 25 | 106 | Home & Lifestyle Products |
| Zurich Insurance Group AG | 19 | 105 | Insurance & Reinsurance |
| Stryker Corporation | 32 | 104 | Healthcare & Life Sciences |
| Enbridge Inc. | 23 | 102 | Energy Producers & Services |
| Equinix, Inc. | 25 | 99 | Property & REITs |
| Sanofi | 20 | 98 | Healthcare & Life Sciences |
| The Southern Company | 17 | 95 | Utilities & Clean Energy |
| Duke Energy Corporation | 17 | 88 | Utilities & Clean Energy |
| Prosus N.V. | 40 | 88 | Technology Software & Services |
| Waste Management, Inc. | 20 | 83 | Environmental & Infrastructure Services |
| United Parcel Service, Inc. | 30 | 80 | Transport & Logistics |
| American Tower Corporation | 22 | 79 | Property & REITs |
| Tata Consultancy Services Limited | 26 | 79 | Technology Software & Services |
| Comcast Corporation | 32 | 78 | Telecom & Network Providers |
| National Grid plc | 26 | 75 | Utilities & Clean Energy |
| Northrop Grumman Corporation | 32 | 73 | Advanced Industrial Systems |
| Cigna Corporation | 19 | 72 | Healthcare & Life Sciences |
| Brookfield Asset Management Ltd. | 27 | 71 | Investment & Advisory |
| Vinci S.A. | 22 | 70 | Construction & Engineering |
| Colgate-Palmolive Company | 17 | 69 | Home & Lifestyle Products |
| América Móvil, S.A.B. de C.V. | 25 | 66 | Telecom & Network Providers |
| American Electric Power Company, Inc. | 23 | 64 | Utilities & Clean Energy |
| Air Products and Chemicals, Inc. | 25 | 63 | Chemicals & Commodities |
| Truist Financial Corporation | 24 | 59 | Banking & Lending |
| Aon plc | 28 | 59 | Insurance & Reinsurance |
| Wesfarmers Limited | 28 | 59 | Home & Lifestyle Products |
| Aflac Incorporated | 17 | 58 | Insurance & Reinsurance |
| Larsen & Toubro Limited | 29 | 56 | Construction & Engineering |
| Nongfu Spring Co., Ltd. | 29 | 55 | Food & Beverage Producers |
| Public Storage | 25 | 54 | Property & REITs |
| Dominion Energy, Inc. | 21 | 53 | Utilities & Clean Energy |
| NIKE, Inc. | 35 | 53 | General Retail & Consumer Goods |
| London Stock Exchange Group plc | 31 | 53 | Investment & Advisory |
| Realty Income Corporation | 18 | 52 | Property & REITs |
| Alimentation Couche-Tard Inc. | 28 | 51 | General Retail & Consumer Goods |
| Sempra | 21 | 51 | Utilities & Clean Energy |
| Compass Group PLC | 31 | 50 | Food & Beverage Producers |
Home Depot
Home Depot is America's largest home improvement retailer, and its fortunes follow the housing market, which has been stuck since 2022. Mortgage rates above 7% (vs 6.3% a year ago) mean nobody wants to move and give up the cheap loan they already have, and fewer moves mean fewer new kitchens and bathrooms. Sales in Q2 still rose to $47.9bn, but the growth is in small jobs, with big projects down 2%.
Reliance Industries
Reliance is India's largest company, a conglomerate that refines oil, makes chemicals, and owns both the country's biggest mobile network, Jio, and its largest retail chain. It should be a winner from the refining boom, but despite good results from its retail and telecom divisions, it hasn’t been. The shares keep making new relative lows, as volatile supply chains put its retail margins at risk and investments in growth soak up earnings.
GTI 200 Spreadsheet
We are pleased to share the GTI 200 spreadsheet. Download the spreadsheet below to view the CAPR and local currency scores, and more, for the world’s largest 200 stocks. Have a look at the different groups and the main list “All stocks”. The Insights tab is interesting, and don’t forget to expand the columns by clicking on the “+” at the top of the page if you want to see more trend data.
Outlook
The market is weaker than in recent times but is not falling. Large stocks are propping up the indices, while stock pickers struggle. Oil and bond yields hold the cards.
Thanks for reading GTI.


