


The Summer Lull Is Over


Issue 82;
- Breadth is deteriorating again
- Warsh could raise rates this week
- Sanctuary in oil
The World Index holds a ByteTrend Score of 3 in USD. The moving averages are rising, but the price recently touched the 20-day min line.
World Index – Developed Markets – Daily
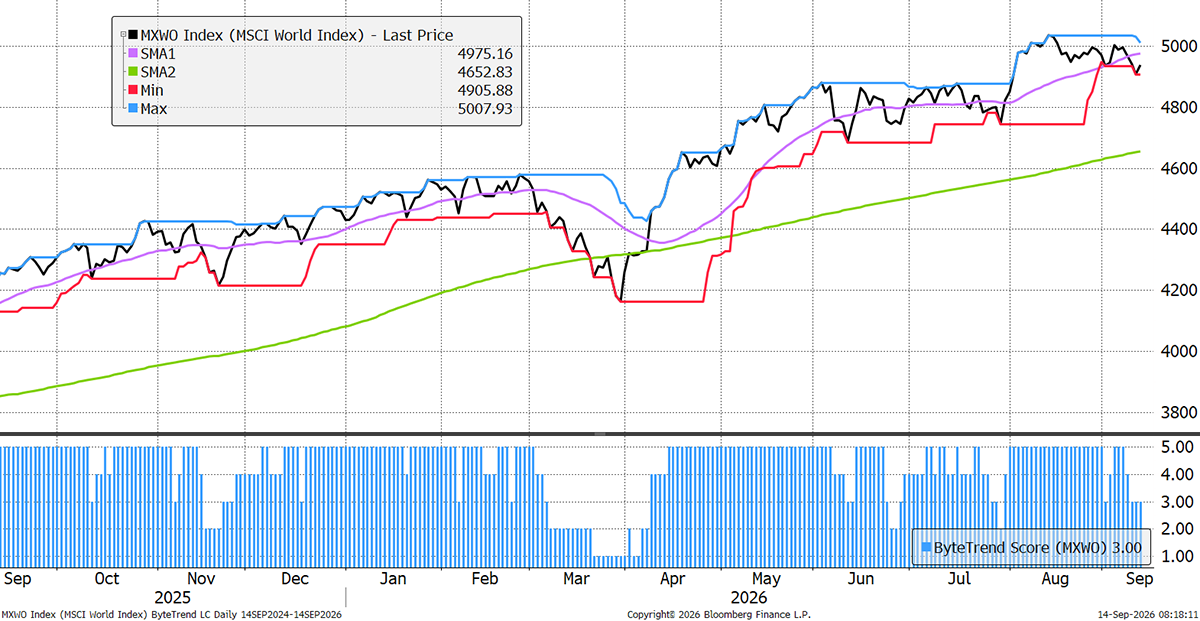
After his Jackson Hole speech, Kevin Warsh is likely to raise rates this week. He told the world that the Fed must be confident that underlying inflation is moving toward the 2% target “clearly and at sufficient speed. Otherwise, we have work to do.”
Friday’s CPI release rose 3.4% over the past year, with energy and telecoms as big drivers. A 0.25% hike looks likely on Wednesday. How will markets take it?
Market Breadth – Local Currency
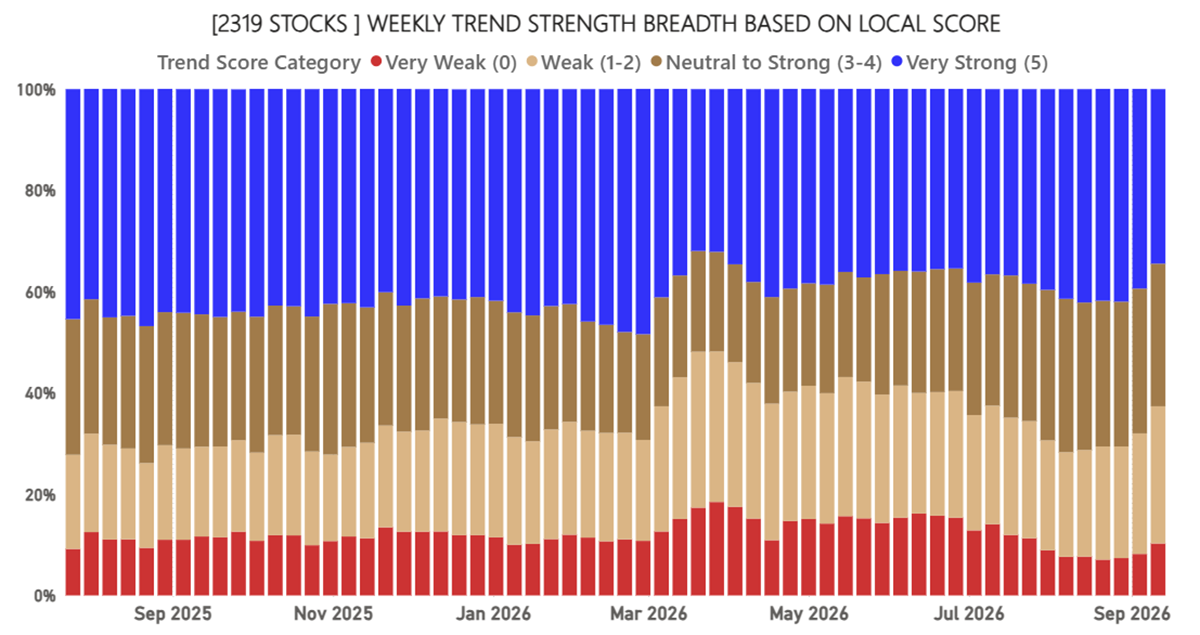
Breadth is clearly deteriorating for the third consecutive week. The rate-sensitive sectors such as real estate are feeling the pinch.
Market Leadership
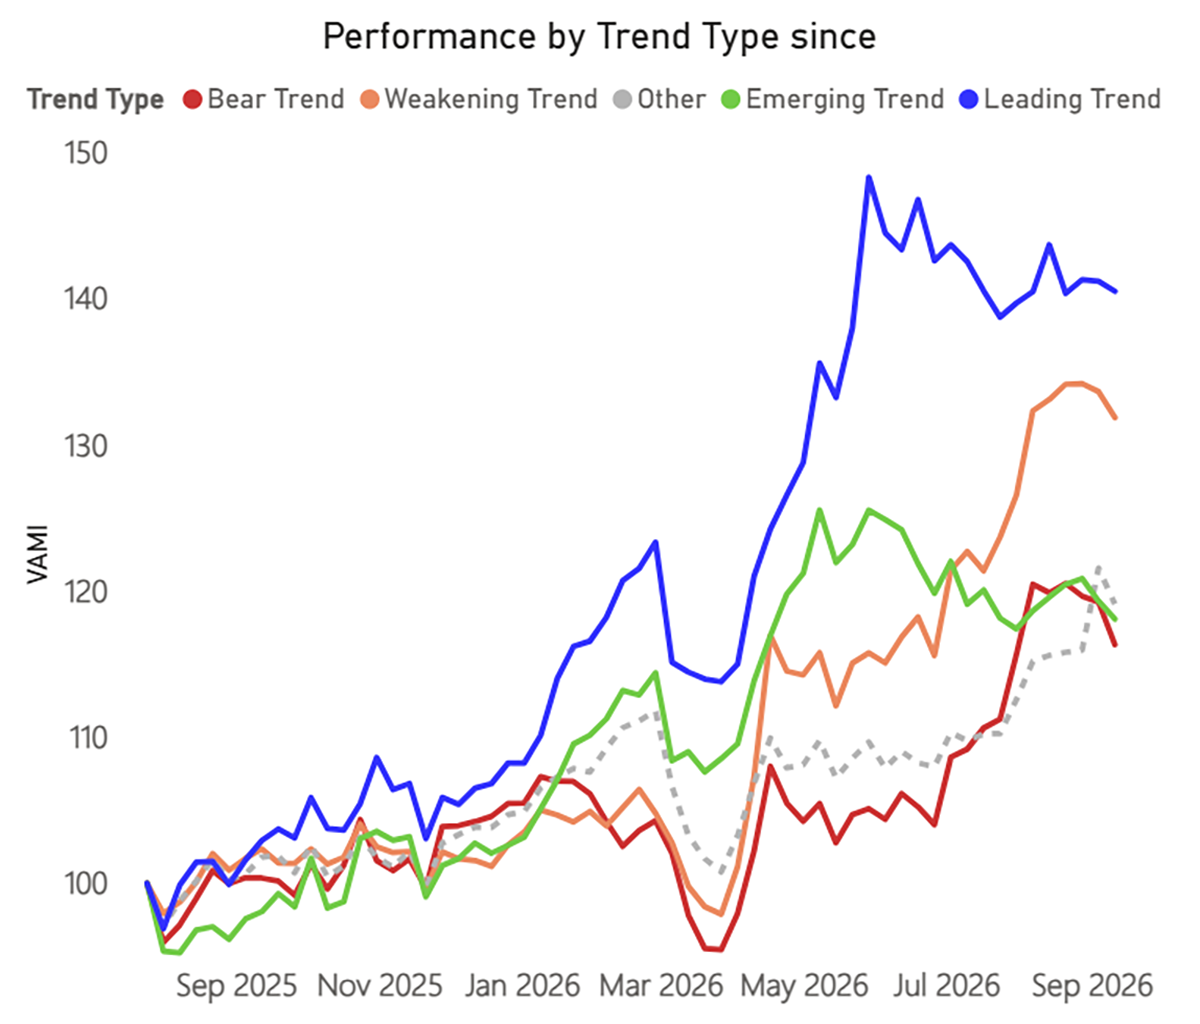
The leadership is increasingly focused on areas immune to, or beneficiaries of, rising interest rates and commodity price shocks. Energy is up this week, catching up with the prevailing winners of tech and financials.

Trend Type Performance
The number of leading and emerging trends is down, while the number of weak and bear trends is up. This is a bearish setup and confirms the deterioration in breadth.
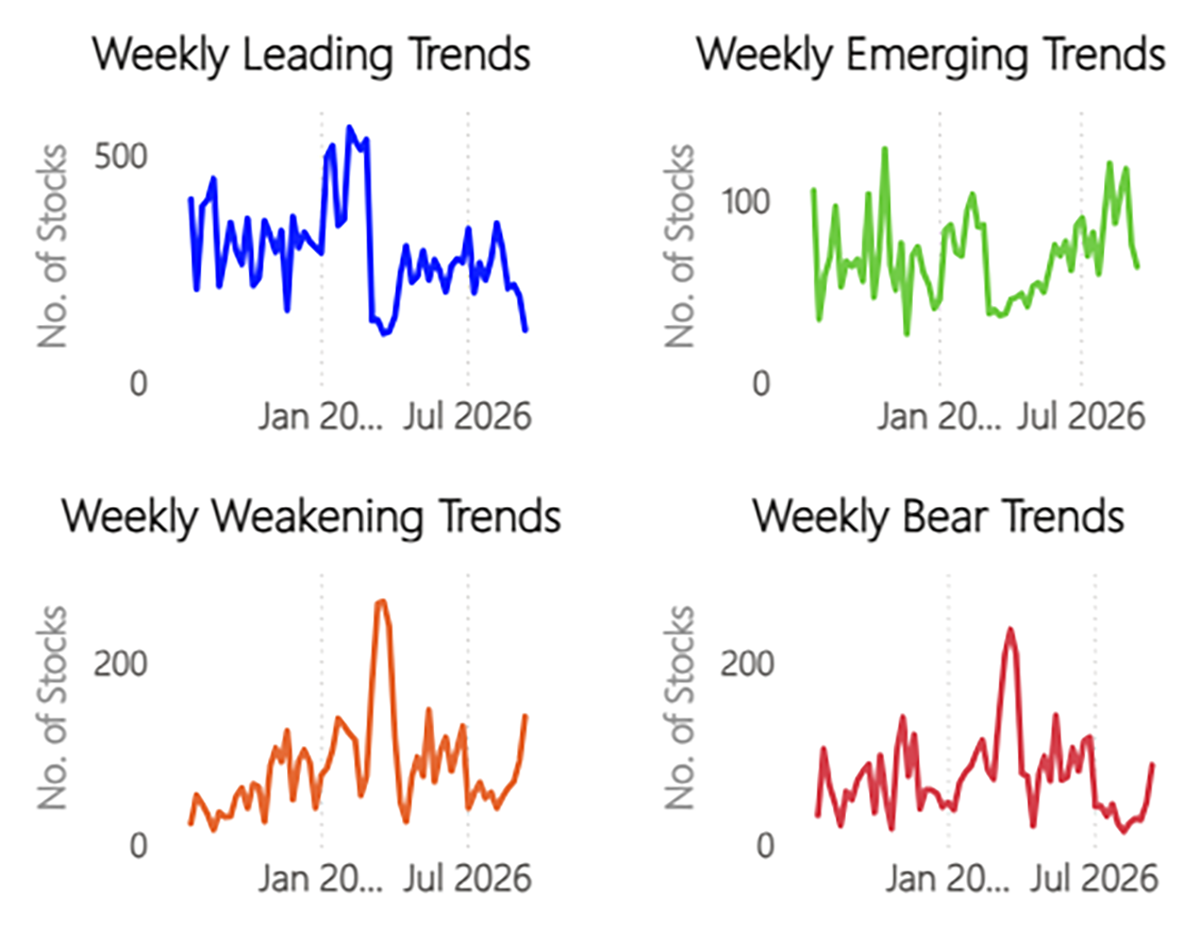
The market divergence is over for now. The winners are stable, while the losers are showing signs of stress.
Regions and Industries Average Relative Score
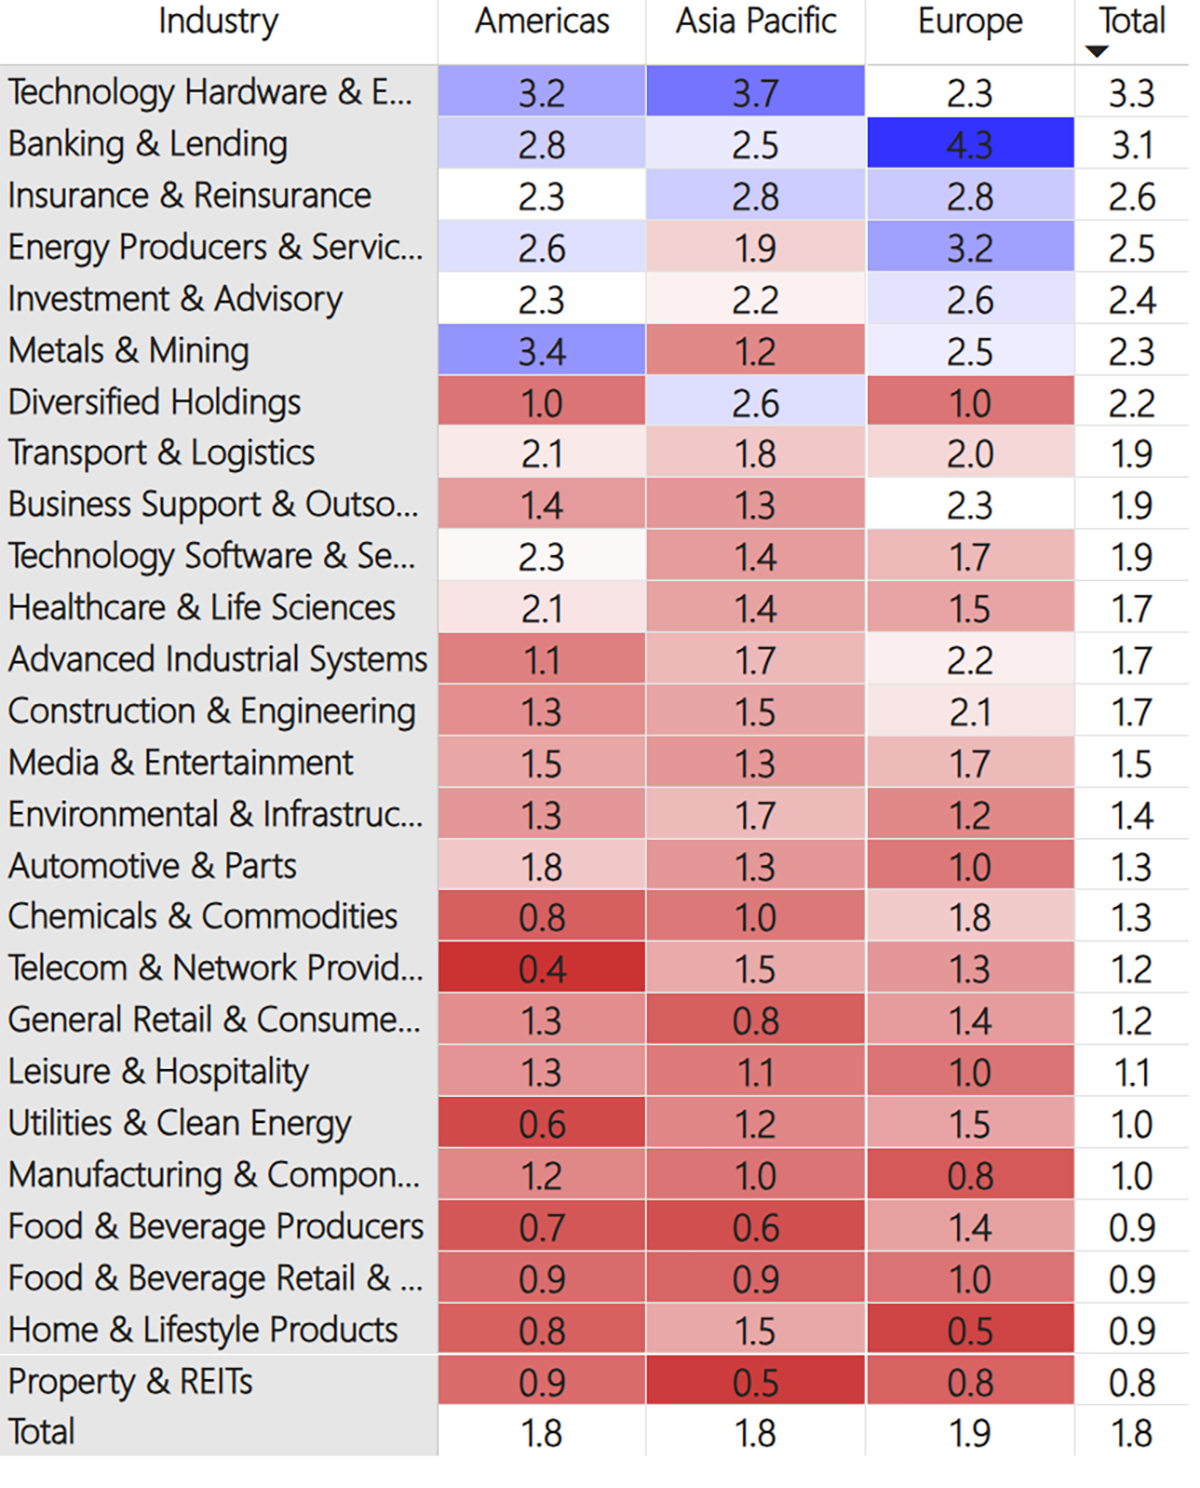
This table (below) shows the average CAPR score for each global industry, by region and in total.
Although some Tech Hardware stocks are still making new relative highs, they continue to weaken as a group. At the top of the table, Energy stocks were the strongest last week, rising to fourth. Within financials, Banking and Insurance continue to show strength, but Investment stocks are showing early signs of weakness.
Software’s multi-month rally has paused, and Advanced Industrials continue to weaken from a previously strong position. Construction and Engineering stocks are also continuing to decline, alongside General Retail and Leisure & Hospitality stocks. Telecoms, however, are showing early signs of strength after six months of relative weakness.
At the bottom of the table, Home & Lifestyle and Property stocks both continued to worsen, as rising rates hurt the consumer.
User Guide
Refer to our GTI: User Guide for an overview of the key concepts and terminology used in this report. These concepts may take a little bit of getting used to, but they are very powerful once you do.
Leading Trends with New Highs
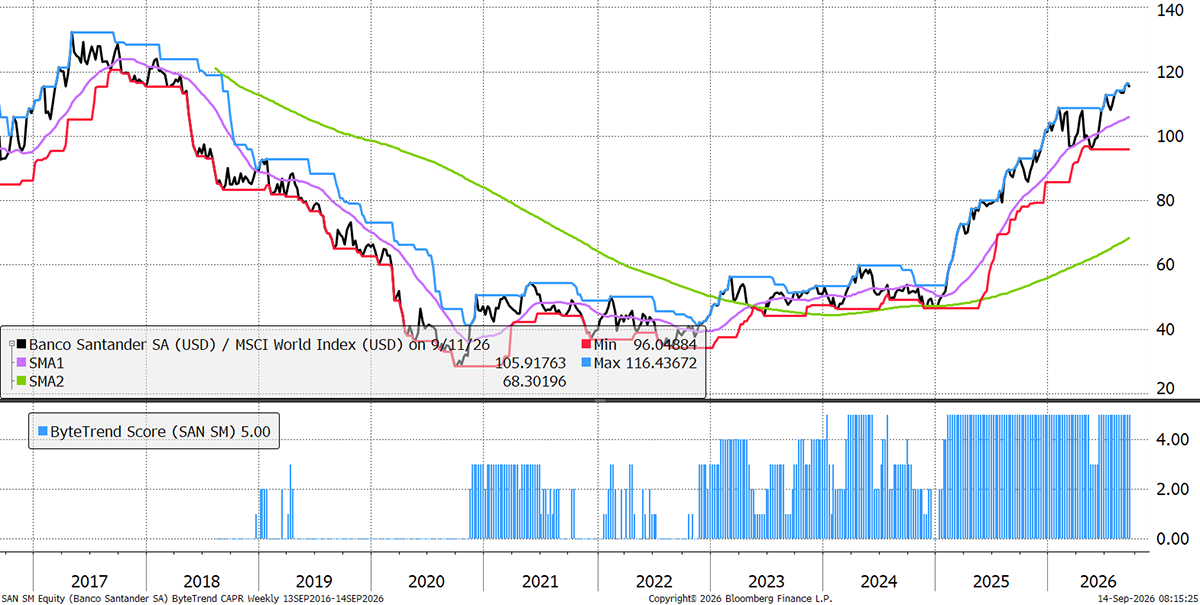
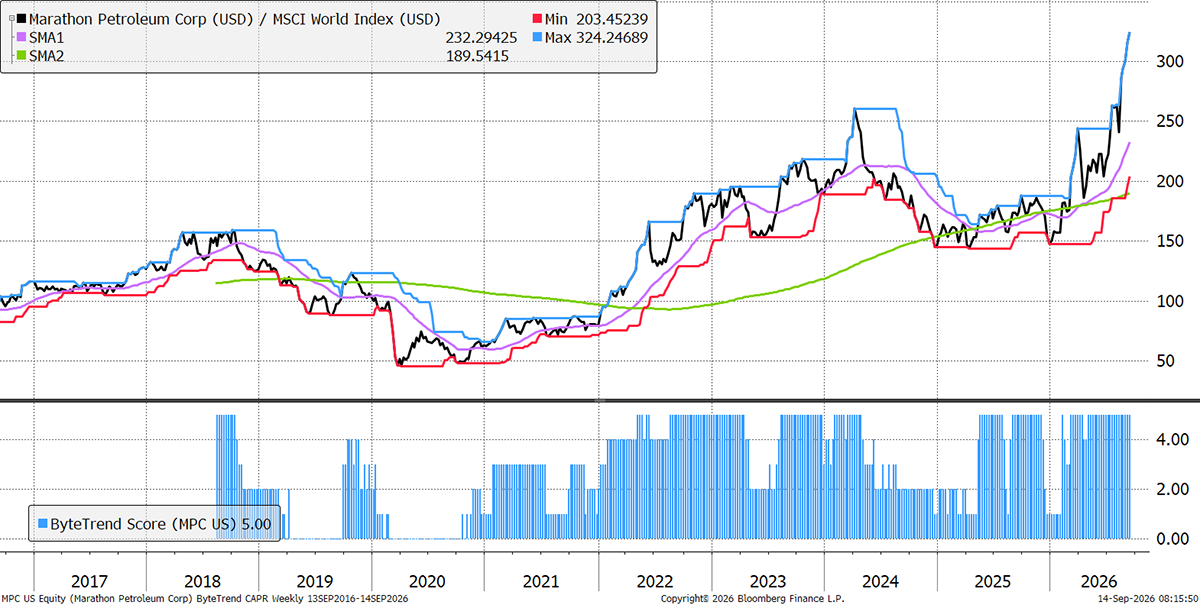
These stocks are trading at the 30-week CAPR highs with a ByteTrend Score of 5. All charts shown are CAPR rebased to 100.
| Name | Annual Vol 30w | Mkt Cap $Bn | Industry |
| Dell Technologies Inc. | 81 | 377 | Technology Hardware & Equipment |
| Bank of China Limited | 23 | 327 | Banking & Lending |
| China Construction Bank Corporation | 22 | 299 | Banking & Lending |
| Arista Networks, Inc. | 53 | 251 | Technology Hardware & Equipment |
| MediaTek Inc. | 87 | 231 | Technology Hardware & Equipment |
| Banco Santander, S.A. | 30 | 219 | Banking & Lending |
| Banco Bilbao Vizcaya Argentaria, S.A. | 26 | 163 | Banking & Lending |
| UniCredit S.p.A. | 32 | 149 | Banking & Lending |
| Intesa Sanpaolo S.p.A. | 26 | 140 | Banks |
| Mizuho Financial Group, Inc. | 34 | 137 | Banking & Lending |
| Marathon Petroleum Corporation | 43 | 116 | Energy Producers & Services |
| The Bank of Nova Scotia | 21 | 114 | Banking & Lending |
| Valero Energy Corporation | 37 | 112 | Energy Producers & Services |
| ING Groep N.V. | 26 | 106 | Banking & Lending |
| Phillips 66 | 38 | 104 | Energy Producers & Services |
| Hewlett Packard Enterprise Company | 56 | 82 | Technology Hardware & Equipment |
| Assicurazioni Generali S.p.A. | 21 | 78 | Insurance & Reinsurance |
| Nordea Bank Abp | 18 | 70 | Banking & Lending |
| Standard Chartered PLC | 29 | 68 | Banking & Lending |
| Nan Ya Plastics Corporation | 78 | 59 | Chemicals & Commodities |
| Commerzbank AG | 29 | 54 | Banking & Lending |
| State Street Corporation | 20 | 54 | Investment & Advisory |
| Polski Koncern Naftowy ORLEN Spólka Akcyjna | 29 | 50 | Energy Producers & Services |
Banco Santander
Spanish bank Santander is leading along with the rest of the European banks. First-half underlying profit rose 15% to a record €7.3bn, with costs down 2%. Return on equity rose to 15.6%, a major improvement versus a decade ago, and 12 million new customers brought the total to 182 million. Higher-for-longer rates, a 14% dividend increase and another €1.8bn of buybacks do the rest.
Marathon Petroleum
The oil refiners are doing the best during this crisis, as the Hormuz partial closure (estimates say 6-10 million barrels pass through each day vs 20 million pre-war) is exacerbated by Ukrainian strikes on Russian oil refineries. Marathon is America’s largest refiner, and its Q2 net income quadrupled to $5.1bn with record refining margins of $36 per barrel, a figure that will have risen further since. Diesel costs more than twice crude oil, the widest gap ever. The longer this goes on, the better for Marathon.
New Leading Trends
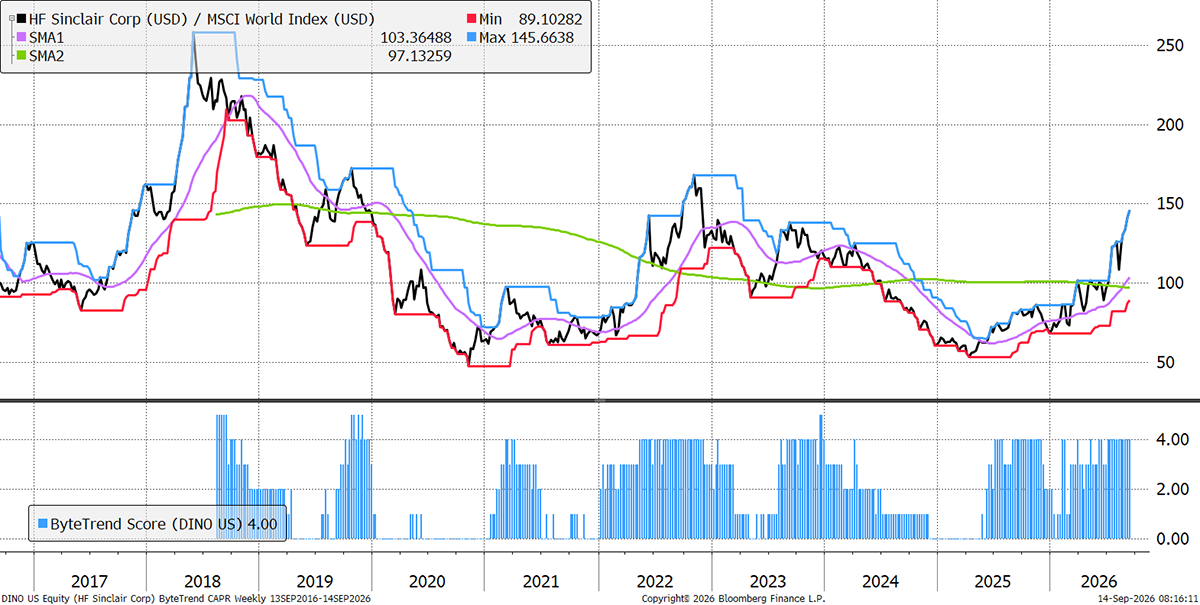
These stocks are trading at the 30-week CAPR highs with a ByteTrend Score of 5, except they are new trends this week, having previously had a score below 5. All charts shown are CAPR rebased to 100.
| Name | Annual Vol 30w | Mkt Cap $Bn | Industry |
| Vodafone Group Plc | 30 | 40 | Telecom & Network Providers |
HF Sinclair
HF Sinclair is the smaller, scrappier refiner, running 640,000 barrels a day across the American West, with lubricants, renewables and midstream bolted on. Second-quarter net income jumped to $892m from $208m, as refining margins rose 57% to $25.95 a barrel, and the renewables arm finally turned a profit. In other news, they plan to separate Lubricants & Specialities over the next year, leaving a cleaner but more cyclical refiner behind.
Emerging Trends
These stocks are trading at the 30-week CAPR highs with a ByteTrend Score of less than 5. They don’t have to be in an uptrend, just emerging. All charts shown are CAPR rebased to 100.
| Name | Annual Vol 30w | Mkt Cap $Bn | Industry |
| Cenovus Energy Inc. | 39 | 61 | Energy Producers & Services |
| Toyota Tsusho Corporation | 38 | 52 | Diversified Holdings |
Cenovus
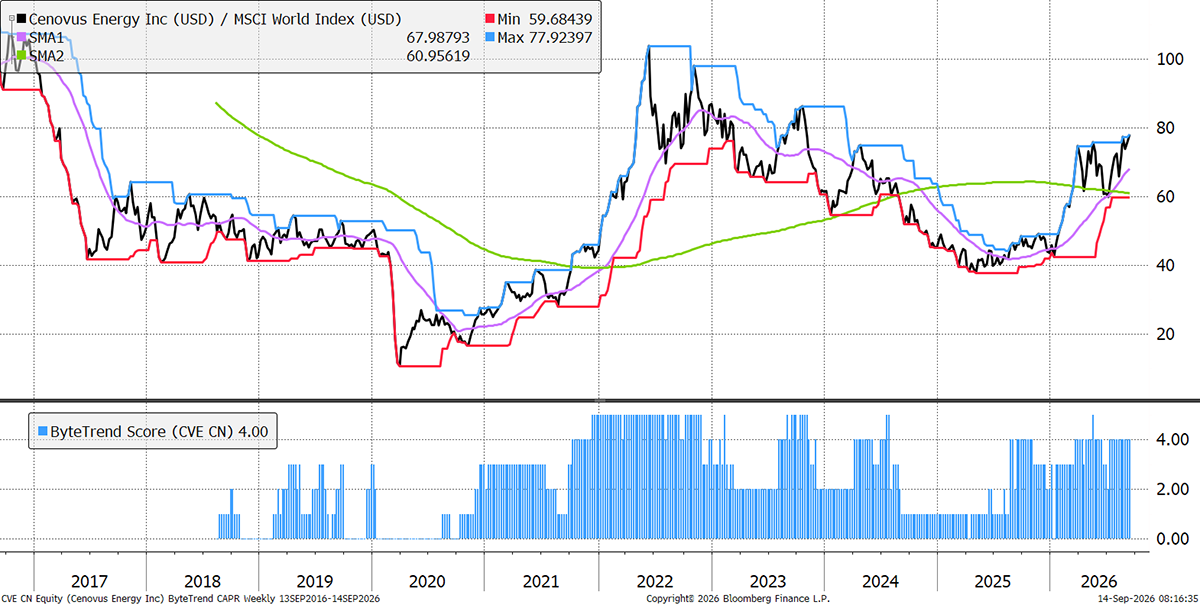
Cenovus is a Canadian oil company, and most of what it owns is oil sands - thick bitumen in Alberta that is steamed out of the ground rather than drilled conventionally. It is expensive to build but cheap to run. It also owns refineries, which turn its own heavy crude into fuel. Last year's C$7.9bn purchase of neighbouring MEG Energy has just delivered record oil sands output of nearly one million barrels per day, and $5.9bn of operating profit (an all-time high).
Weakening
These stocks are trading at the 30-week CAPR lows with a ByteTrend Score above 0. They are weakening trends but not yet downtrends. All charts shown are CAPR rebased to 100.
| Name | Annual Vol 30w | Mkt Cap $Bn | Industry |
| Novartis AG | 29 | 261 | Healthcare & Life Sciences |
| Siemens Energy AG | 41 | 143 | Construction & Engineering |
| Fast Retailing Co., Ltd. | 36 | 133 | General Retail & Consumer Goods |
| Bharti Airtel Limited | 20 | 120 | Telecom & Network Providers |
| Enel S.p.A. | 27 | 103 | Utilities & Clean Energy |
| Trane Technologies plc | 25 | 97 | Construction & Engineering |
| Howmet Aerospace Inc. | 34 | 92 | Advanced Industrial Systems |
| FedEx Corporation | 24 | 74 | Transport & Logistics |
| Royal Caribbean Cruises Ltd. | 34 | 70 | Leisure & Hospitality |
| Hilton Worldwide Holdings Inc. | 21 | 69 | Leisure & Hospitality |
| Mitsubishi Electric Corp. | 37 | 67 | Advanced Industrial Systems |
| TransDigm Group Incorporated | 28 | 64 | Advanced Industrial Systems |
| TC Energy Corporation | 25 | 63 | Energy Producers & Services |
| CRH plc | 34 | 59 | Construction & Engineering |
Howmet
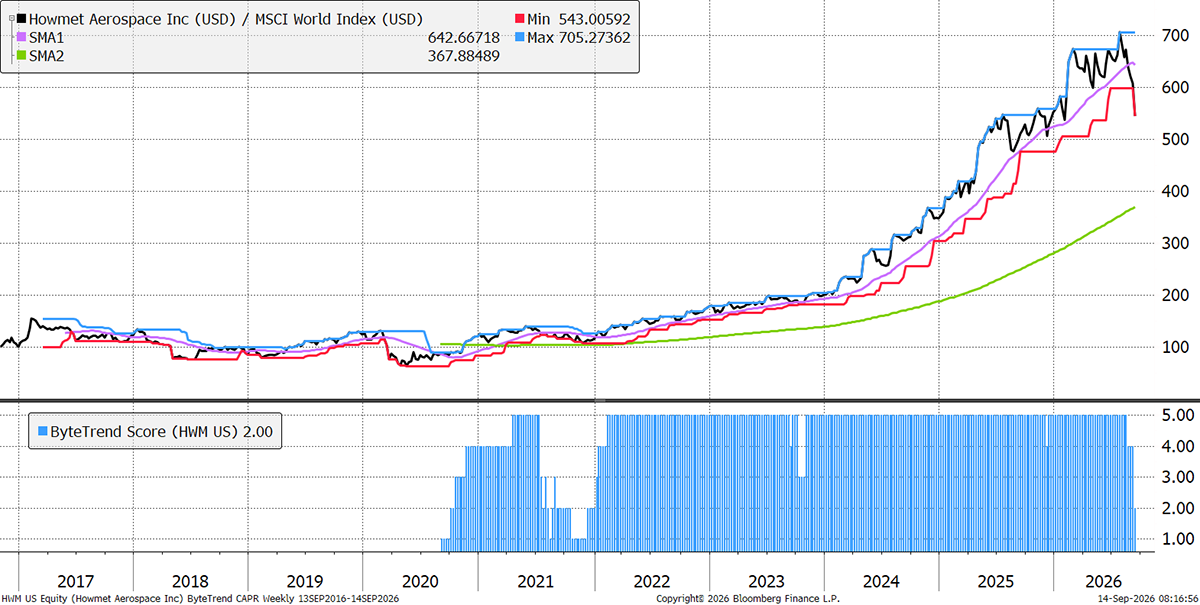
Howmet makes the castings, forgings and fasteners that hold jet engines together, and it has been one of the decade’s great industrials, with revenue up 24% last quarter and heading to $10bn annually. Then, on 9 September, GE Aerospace agreed to buy Consolidated Precision Products for $11.75bn. The fear is that GE will start making in-house what it used to buy, leading Howmet shares to fall roughly 10% on the day and 18% in a month.
Bear Trends
These stocks are trading at the 30-week CAPR lows with a ByteTrend Score of 0. They are in a downtrend. All charts shown are CAPR rebased to 100.
| Name | Annual Vol 30w | Mkt Cap $Bn | Industry |
| Tencent Holdings Limited | 32 | 492 | Technology Software & Services |
| Costco Wholesale Corporation | 17 | 401 | Food & Beverage Retail & Distribution |
| Nestlé S.A. | 21 | 244 | Food & Beverage Producers |
| LVMH Moët Hennessy - Louis Vuitton, Société Européenne | 29 | 238 | Home & Lifestyle Products |
| Linde plc | 20 | 216 | Chemicals & Commodities |
| Commonwealth Bank of Australia | 22 | 185 | Banking & Lending |
| McDonald's Corporation | 17 | 179 | Food & Beverage Producers |
| Reliance Industries Limited | 20 | 178 | Energy Producers & Services |
| Hermès International S.C.A. | 30 | 170 | Home & Lifestyle Products |
| The TJX Companies, Inc. | 24 | 139 | General Retail & Consumer Goods |
| Prologis, Inc. | 20 | 127 | Property & REITs |
| HDFC Bank Limited | 22 | 114 | Banking & Lending |
| PDD Holdings Inc. | 32 | 111 | General Retail & Consumer Goods |
| Lowe's Companies, Inc. | 25 | 110 | Home & Lifestyle Products |
| Stryker Corporation | 33 | 106 | Healthcare & Life Sciences |
| Enbridge Inc. | 22 | 104 | Energy Producers & Services |
| Sanofi | 20 | 102 | Healthcare & Life Sciences |
| The Southern Company | 17 | 100 | Utilities & Clean Energy |
| GSK plc | 26 | 96 | Healthcare & Life Sciences |
| Prosus N.V. | 40 | 88 | Technology Software & Services |
| Cadence Design Systems, Inc. | 43 | 80 | Technology Software & Services |
| Christian Dior SE | 27 | 79 | Home & Lifestyle Products |
| EssilorLuxottica S.A. | 32 | 78 | Healthcare & Life Sciences |
| National Grid plc | 27 | 77 | Utilities & Clean Energy |
| Vinci S.A. | 23 | 72 | Construction & Engineering |
| O'Reilly Automotive, Inc. | 22 | 71 | General Retail & Consumer Goods |
| Colgate-Palmolive Company | 18 | 69 | Home & Lifestyle Products |
| Chugai Pharmaceutical Co., Ltd. | 28 | 69 | Healthcare & Life Sciences |
| América Móvil, S.A.B. de C.V. | 28 | 68 | Telecom & Network Providers |
| Aon plc | 27 | 64 | Insurance & Reinsurance |
| Honeywell International Inc. | 31 | 64 | Diversified Holdings |
| Boston Scientific Corporation | 39 | 64 | Healthcare & Life Sciences |
| Wesfarmers Limited | 29 | 59 | Home & Lifestyle Products |
| Nongfu Spring Co., Ltd. | 29 | 57 | Food & Beverage Producers |
| Realty Income Corporation | 17 | 55 | Property & REITs |
| Public Storage | 25 | 55 | Property & REITs |
| NIKE, Inc. | 36 | 54 | General Retail & Consumer Goods |
LVMH Moët Hennessy Louis Vuitton
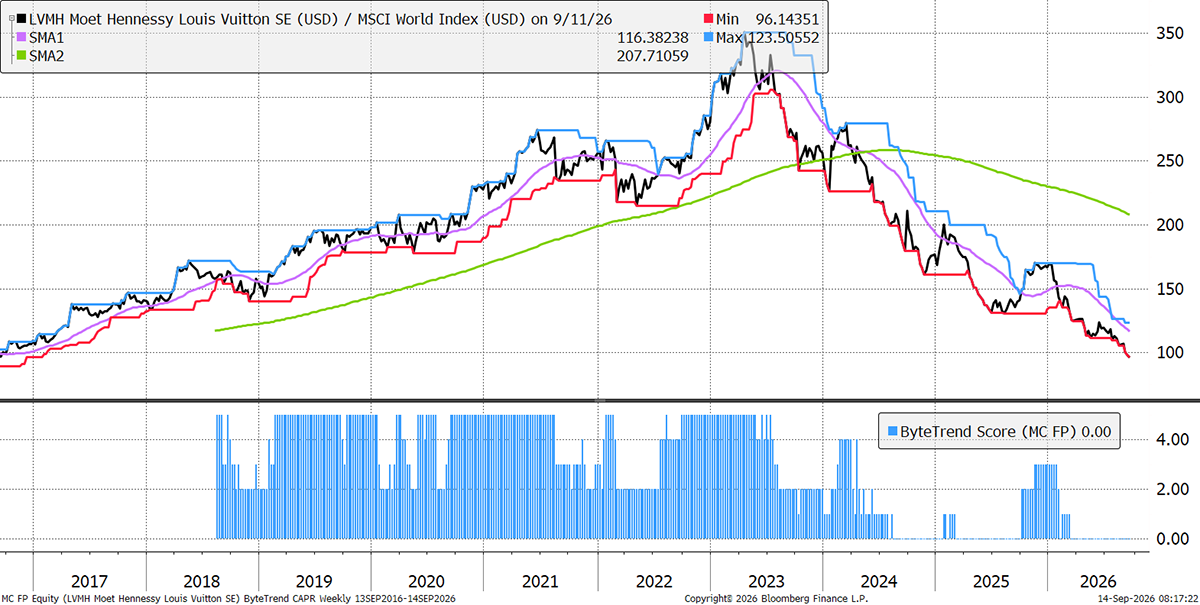
Luxury giant LVMH reached a record valuation of 7.5x in 2021, but the share price has been declining since early 2023, now sitting below 3x sales. Revenue growth, which used to be consistently around 10%, has fallen into negative territory. This stems from it raising prices too aggressively after the pandemic, just before China weakened and cost-of-living issues struck in the West. Diamonds and jewellery have been the resilient areas of the luxury market, while LVMH is more focused on clothing and accessories.
Enbridge
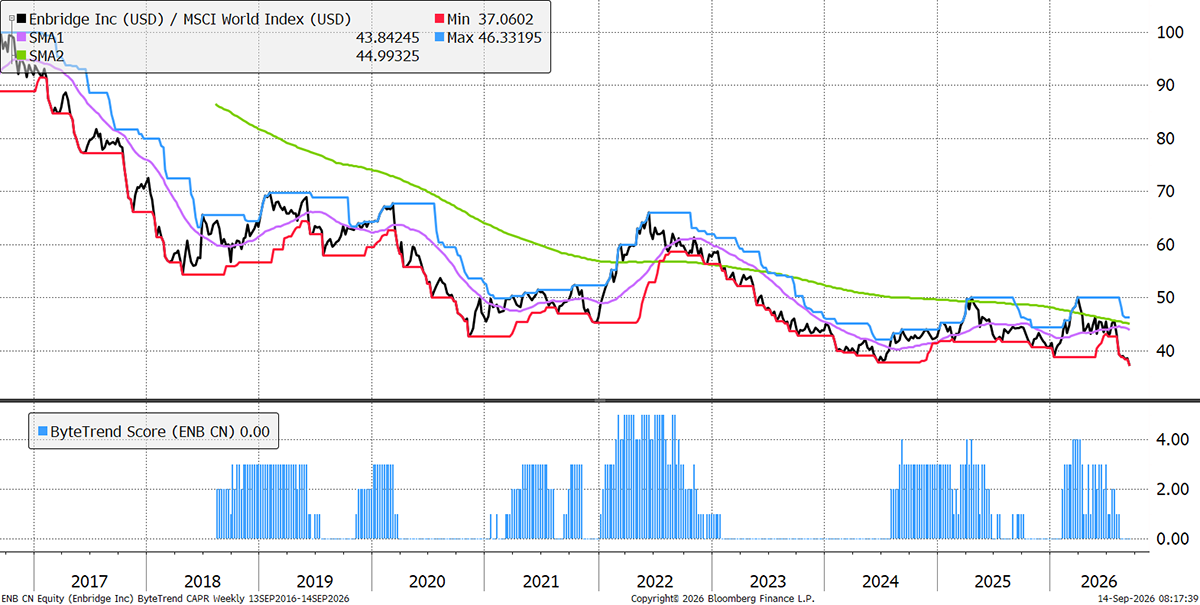
Enbridge owns pipelines that move oil and gas across North America, taking a toll from the huge amount of fossil fuels that pass from Alberta in Canada down to America. The recent tariff spat has hurt it, and the fees it charges are based on volumes, not price, so it hasn’t benefitted from rising energy prices. A big dividend payer with three decades of increases behind it, it’s very bond-like, meaning the high interest rates we are seeing damage its relative appeal.
GTI 200 Spreadsheet
We are pleased to share the GTI 200 spreadsheet. Download the spreadsheet below to view the CAPR and local currency scores, and more, for the world’s largest 200 stocks. Have a look at the different groups and the main list “All stocks”. The Insights tab is interesting, and don’t forget to expand the columns by clicking on the “+” at the top of the page if you want to see more trend data.
Outlook
Labor Day, which marks the beginning of the autumn for markets, is behind us. That means big things could happen. Breadth is clearly deteriorating, and rates are the smoking gun.
Thanks for reading GTI.


