


Current Market Breadth Is Weaker Than in 2008


Issue 86;
- Alpha-Zulu Gap at a 20-year extreme
- Poland takes first prize
- Middle East and Asia under pressure
To learn more about the core concepts, visit ByteTrend Docs.
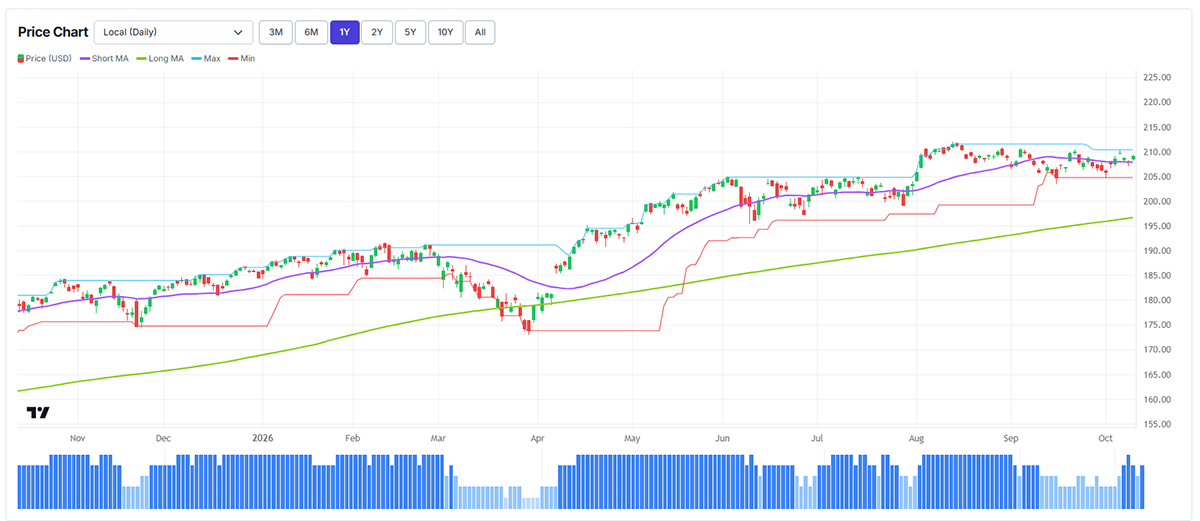
The World Index has a ByteTrend Score of 4 in USD. The last touch of the 20-day max/min lines was a min, hence a 4 rather than a 5. The new high is close but not there yet.
iShares MSCI World ETF (URTH)- Developed Markets – Daily 1-Year
World Market Alpha Breadth (in Daily CAPR) since 2006
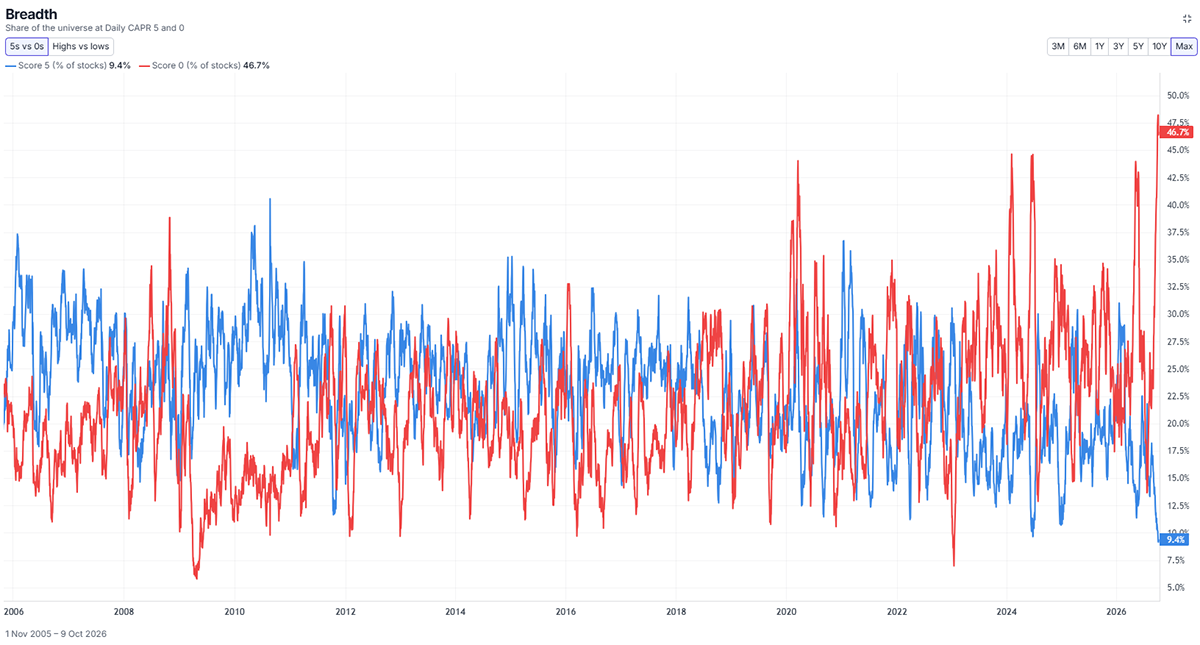
The next chart shows the proportion of our universe that is at a score of 5 or 0. These are the two most important buckets on the ByteTrend platform: the strongest stocks and the weakest. The 5s generate alpha, or outperformance, while the 0s are underperforming. In this chart, we are using daily data, which measures trends over months, rather than weekly data, which measures them over years.
On the ByteTrend platform, we can now show these groups going back to 2006, which is a great step forward for analysing historical momentum. Today, just 9.4% of stocks are outperforming the market with a score of 5, compared to 46.7% with a score of 0. Looking back to 2010, following the Financial Crisis, we had the reverse situation: high breadth, with many strong trends (5s) and few weak trends (0s)
This is the highest number of daily scores of 0 in the 20-year history of our dataset – an extreme reading. Unsurprisingly, the number of Daily CAPR scores of 5 is also at a record low. There have never been so few stocks beating the index. As a result, the gap has never been this wide. Market leadership has not been this narrow since before the Global Financial Crisis.
Stockmarket Breadth (5s vs 0s) in Daily CAPR
World Index with Average CAPR Stock Trend Score
Out of 4,000 stocks, the average CAPR score is 1.4 against a long-term average of around 2.5. Rising bond yields are the driver, making low-growth stocks less attractive than bonds. Very few stocks are growing fast enough to be worth owning at these rates, and the ones that are tend to be mega-caps, which are large enough to keep the index rising even as most stocks fall.
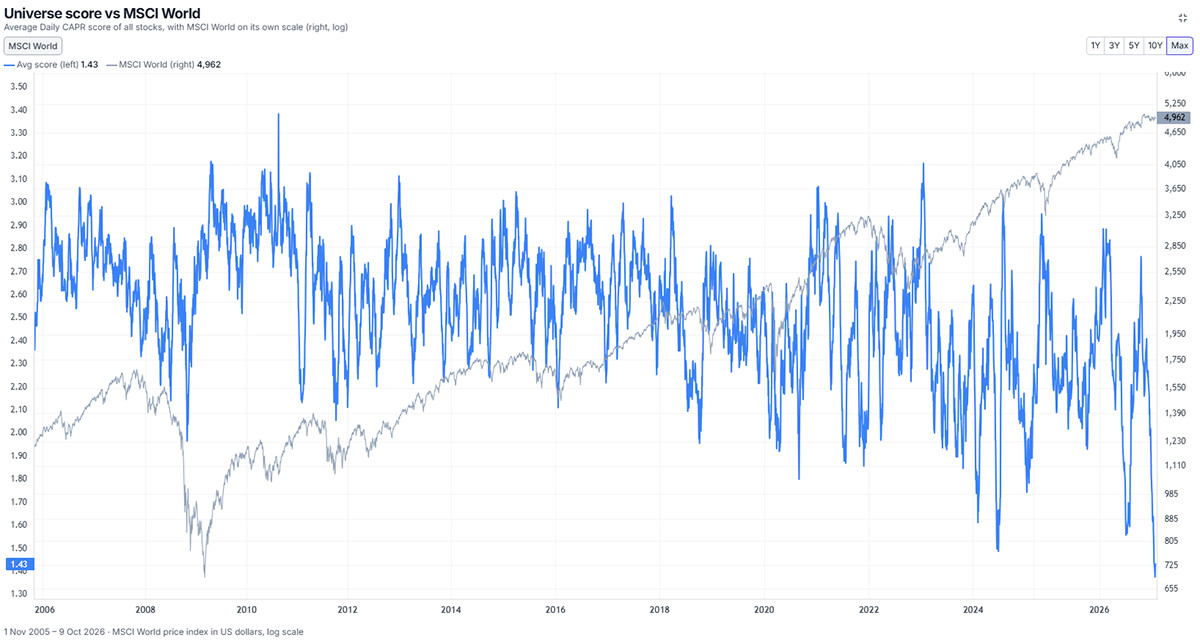
Notice how in 2010, the average Daily CAPR score was high, meaning it was a high-breadth market. That is, small-caps led the market, unlike today, when they are underperforming.
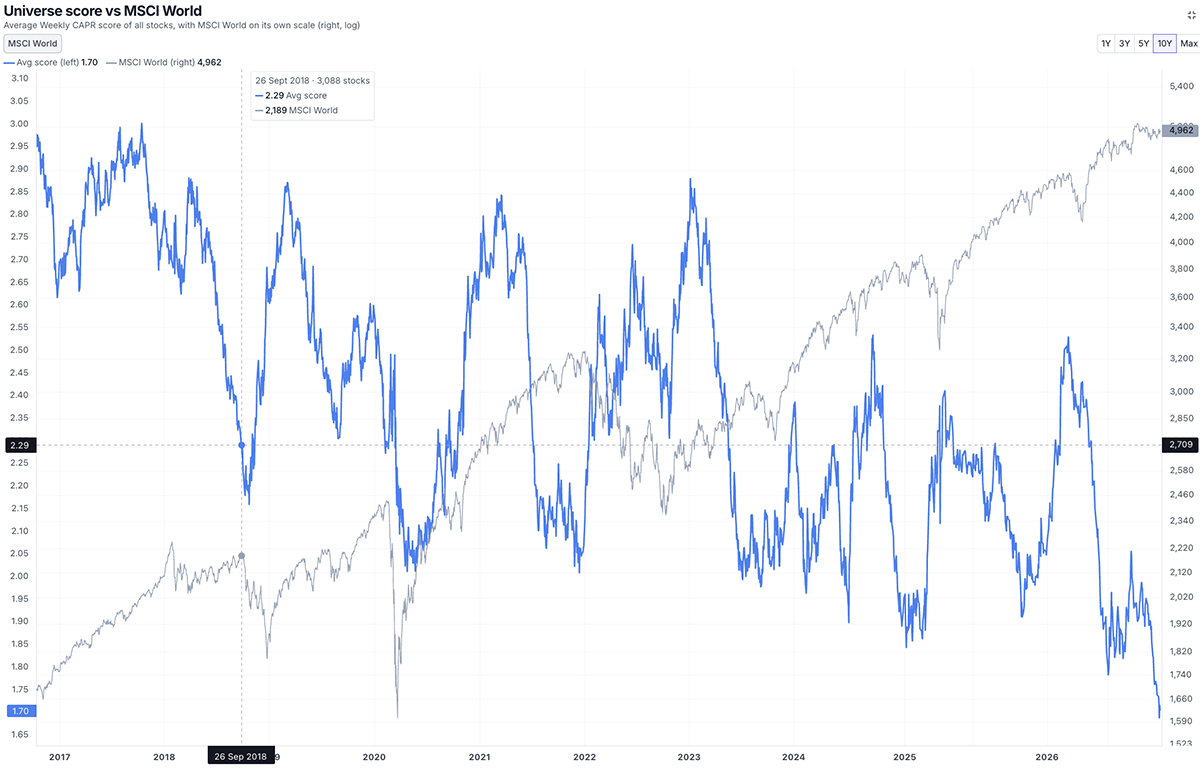
Why does this matter? A falling/low average CAPR score, implying weak breadth (i.e. a market rally led by few stocks), has preceded some recent market falls. For example, on 28 September, 2018, the average CAPR score of our universe had already fallen from 2.9 to 2.3 before the World Index began to fall. Again, before the market crash of March 2020, the average CAPR score fell quickly from 2.6 to 2.3 between Christmas and February 20th. It happened again before the Bear Market in 2022 and the Tariff Shock in March 2025.
Sharply weakening breadth can signal trouble ahead.
Average CAPR Score of the ByteTrend Universe (blue) vs MSCI World Index
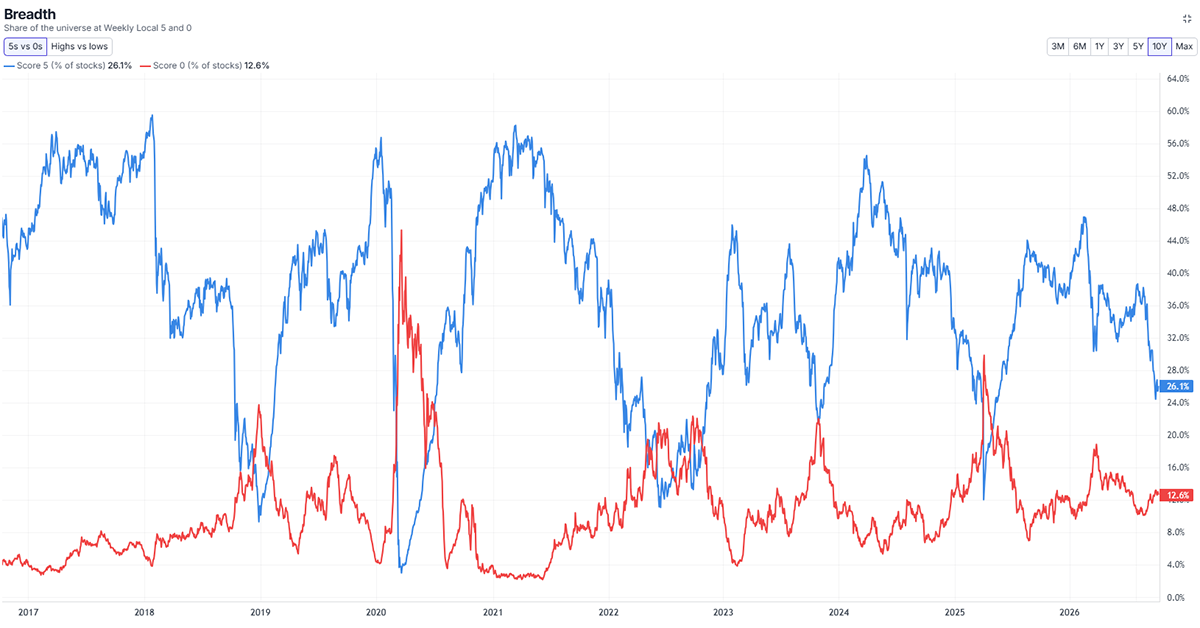
World Market Beta Breadth (in Price, Weekly) since 2017
Breadth in local currency (not relative to the index) terms is also falling, as the blue line comes down. That means fewer stocks are in uptrends in price terms. Crucially, the red line is not rising aggressively. Market shocks generally happen when the number of downtrends explodes, which we have yet to see. The situation is precarious, but not yet disastrous.
Local Currency Breadth - Weekly Data
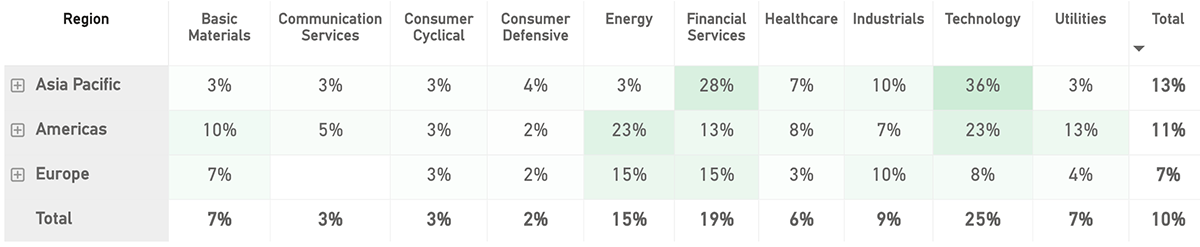
Net Winners
As stated, the leading stocks are few, and they are concentrated in Technology, Energy, and Financial Services. Asia is where the AI and Tech Hardware companies cluster, so it is the strongest block. The Americas got a boost from Brazil’s Bolsonaro election result.
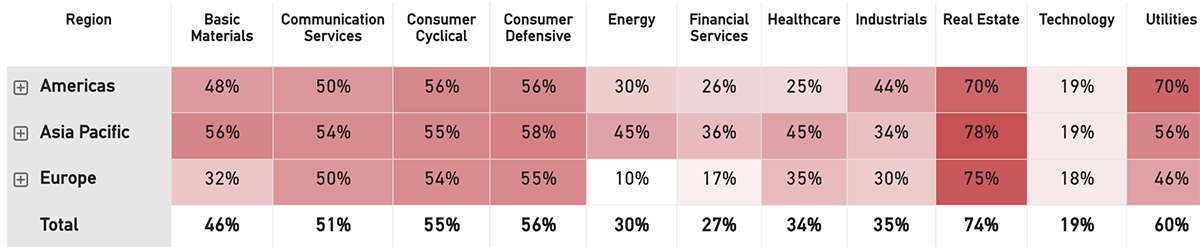
Net Losers
This group is much livelier. The Consumer sectors, Utilities, and Real Estate are the most exposed to the bond market selloff. Communications, including the Telecom stocks hurt by SpaceX’s move last week, are also weak.
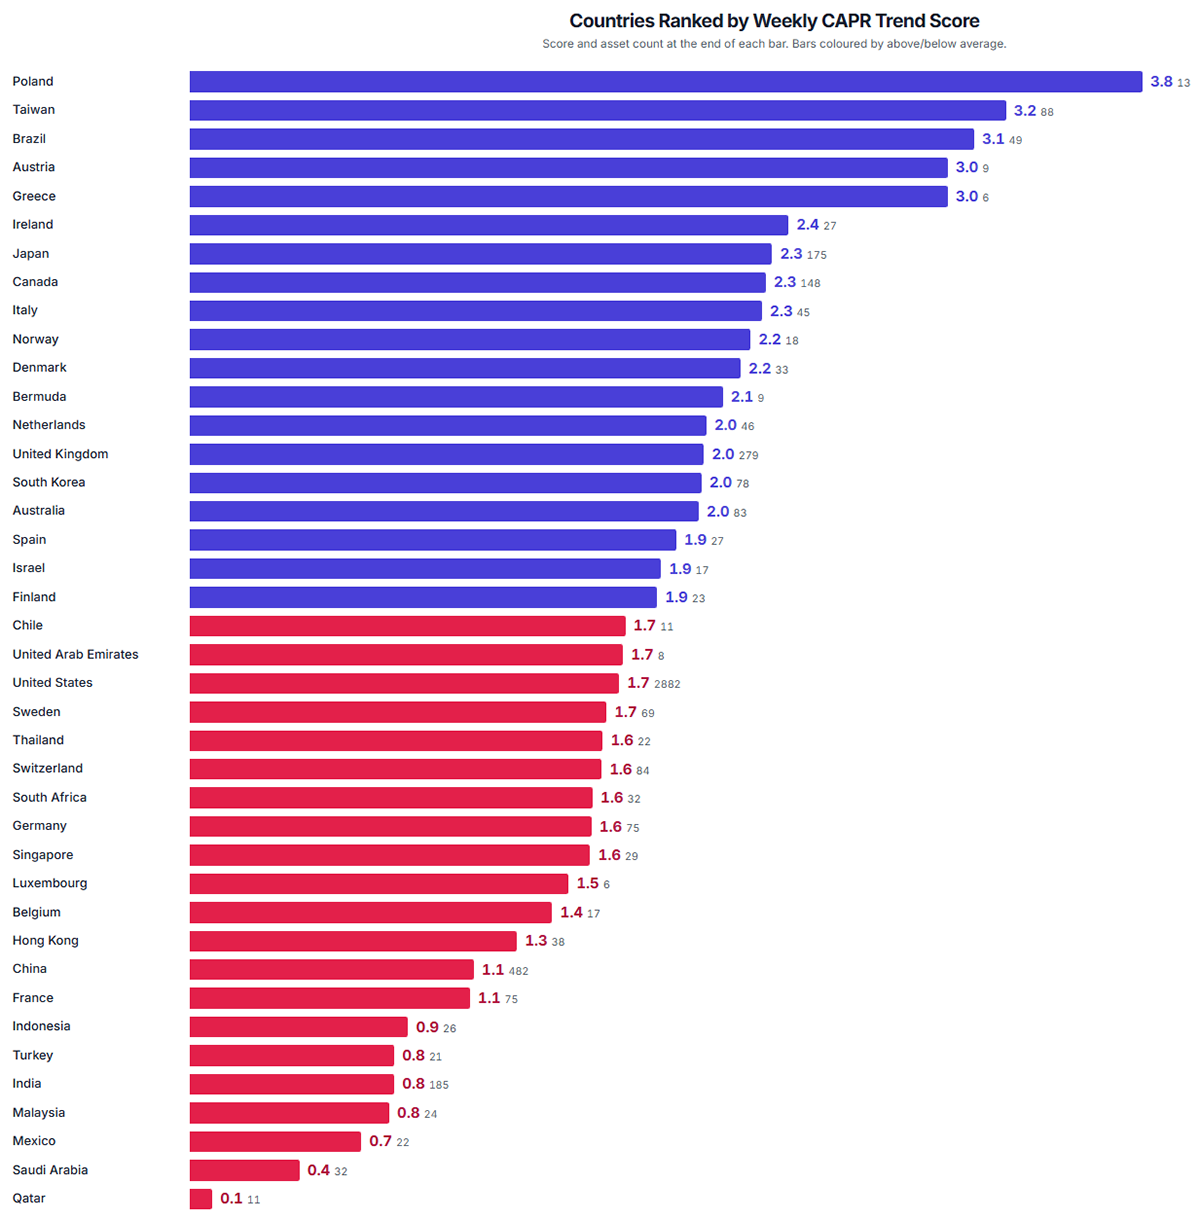
Country Strength
Poland is a small market but has climbed to the top spot, surpassing even Taiwan. Austria makes an appearance near the top of the table, and Brazil is also strong following the election. Asia and the Middle East are weak.
iShares MSCI Poland (EPOL)
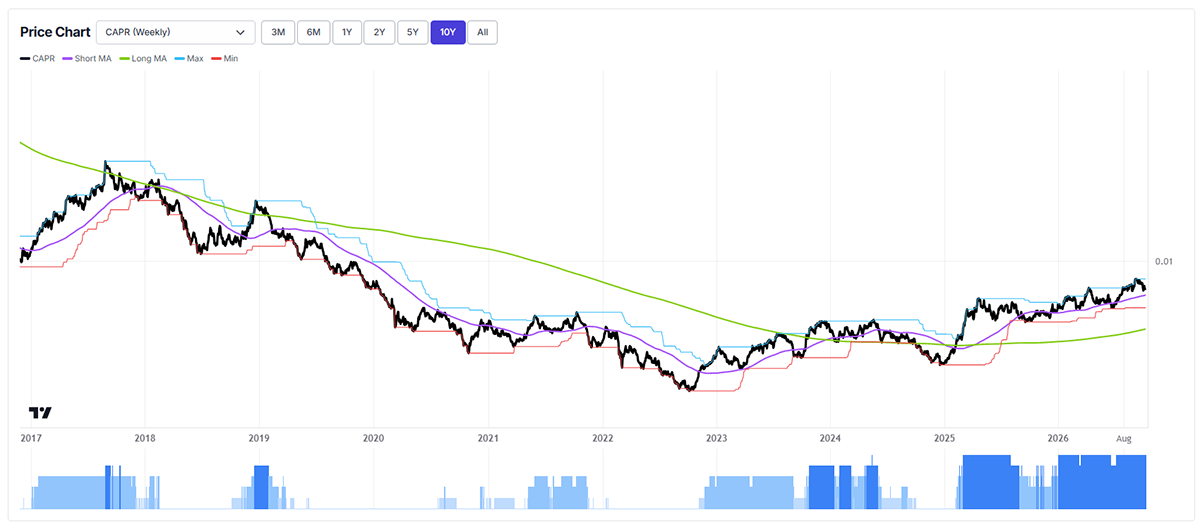
Poland turned up in 2022 and continues to lead the world. Poland has achieved some control over inflation in recent years, as it reached 2.1% in February this year. Its debt-to-GDP ratio is low compared to many developed nations, at around 60%. Retail sales growth, meanwhile, has hovered around 4-5% since the start of 2024, after a slump in 2023. With low debt, low inflation, and healthy growth, it’s no surprise that numerous companies, including Dino Polska, Allegro, and LPP, have benefitted.
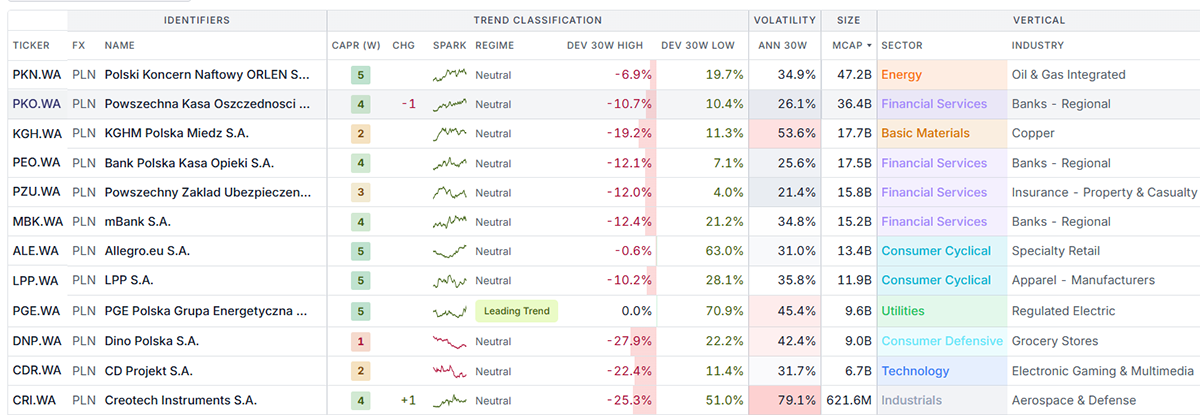
Polish Stocks – Ranked by Size
It’s a small market but with a healthy number of strong trends (CAPR weekly scores of 5). ORLEN is labelled as an oil major involved in electricity generation. KGHM is a copper miner with exposure to gold and silver. The banks have also been doing well.
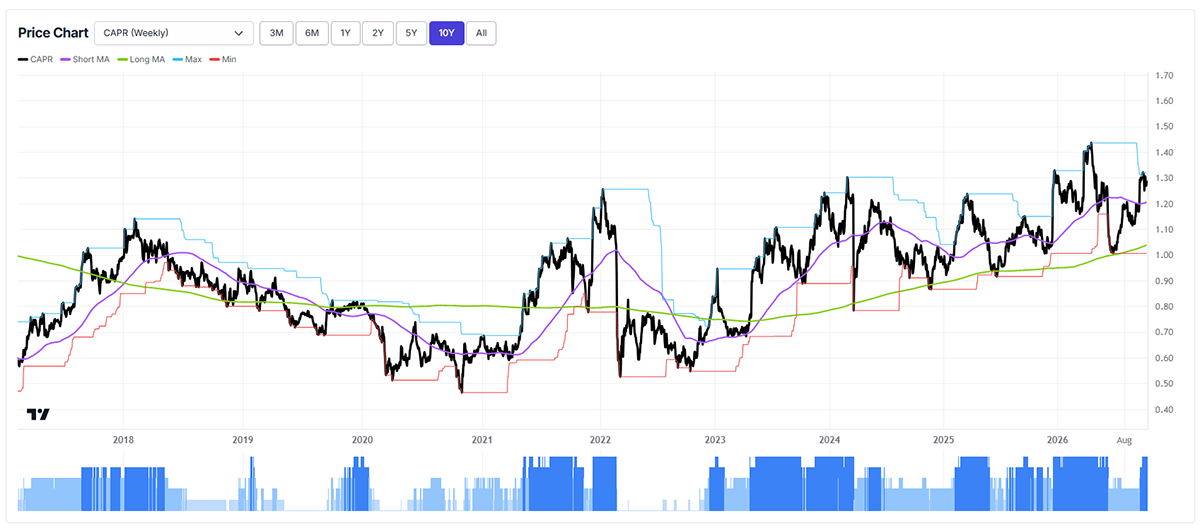
To highlight one example, LPP is a fast-growing fashion conglomerate, akin to H&M or Inditex (Zara), with multiple retail chains (Reserved, Cropp, House, Mohito, and Sinsay), and a 4,000-store footprint in Eastern Europe and beyond. This is double the number of stores from just a few years ago, and it also sells online. Sinsay is the largest chain, accounting for 57% of sales, and its store count is growing nearly 50% year on year.
Group sales grew around 15%, it pays a 3.7% dividend yield, and it trades on a forward PE of 17x, even after doubling in the last three years and beating the World Index. The stock is 60% owned by its founders’ family office.
LPP
Saudi Arabia
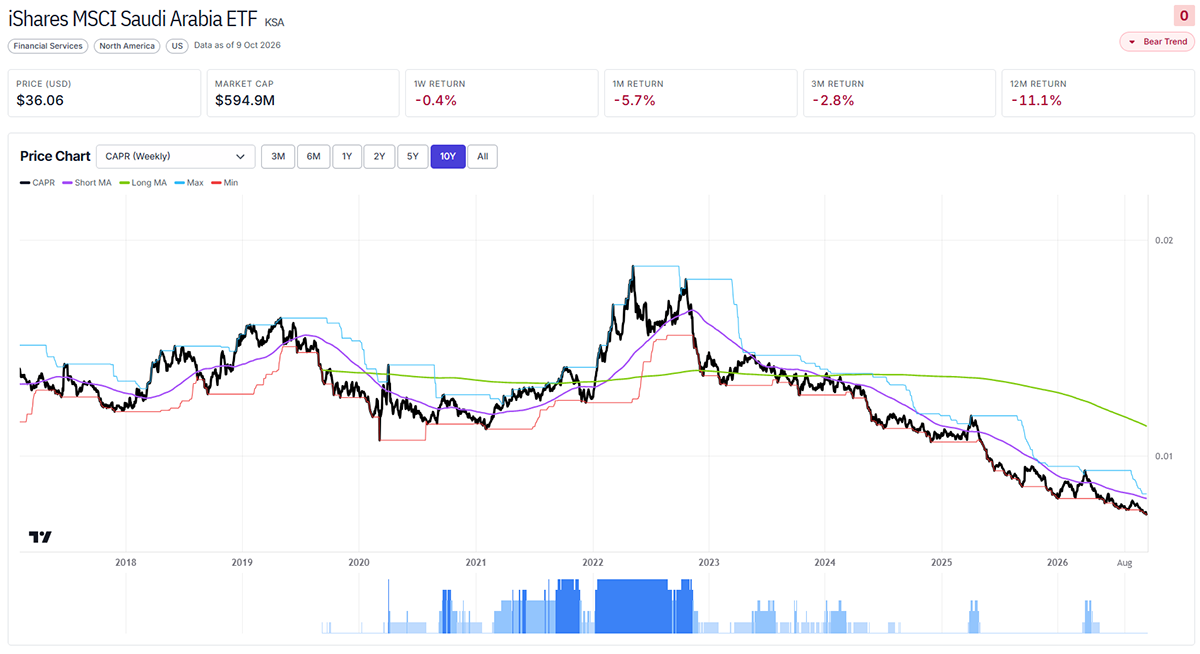
Another notably weak country is Saudi Arabia. In the early days of the war, it looked as though Saudi Arabia would be a net beneficiary in the region. It was not under attack at the beginning, and could still export all its oil. As a result, it briefly outperformed other GCC countries and the world, benefitting from higher oil prices without the costs of physical conflict.
Alas, that soon faded, as it too came under attack. First, its Ras Tanura export hub was hit by the Iranians in the early stages; then, most recently, its Yanbu port and airports were hit by the Houthis. This conflict has gone from bad to worse for the Saudis, as America has not come to their aid against the Houthis.
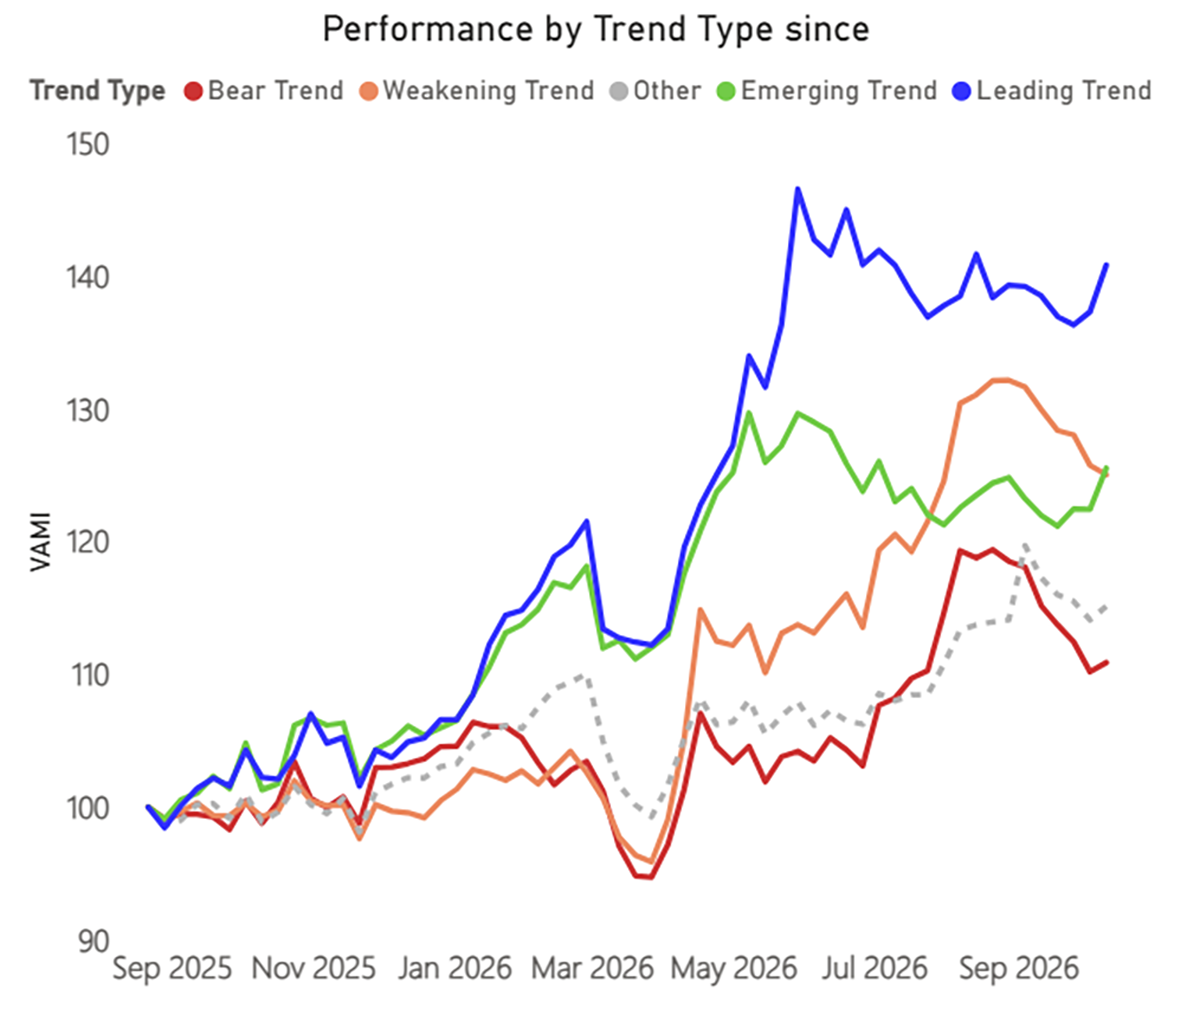
Trend Type Performance
The leading and emerging trends are rising again, while the weakening and bear trends remain under pressure. This week’s highlight is “other”, which covers everything else – the vast majority. These neutral stocks are not doing too badly, so it is too early to panic.
Outlook
The battle between alpha and beta is on. We have not seen such a divergence in 20 years. I would hazard a guess that we last saw it in the late 1990s. But the lagging stocks are not falling, so it is too early to panic.
Feedback is welcome at gti@bytetree.com.
Thank you for reading Global Trends Investor.
Explore ByteTrend
This letter shows only a fraction of what’s available on the ByteTrend platform. For deep market intelligence, explore 4,000 stocks, 1,200 ETFs, 32 commodities, 35 currencies and 175 digital assets:


