


Flight to Quality

Issue 88;
- Emerging Trends confirm rotation.
- The World Index falls to a daily trend score of 2.
- Bonds and low-volatility stocks surge.
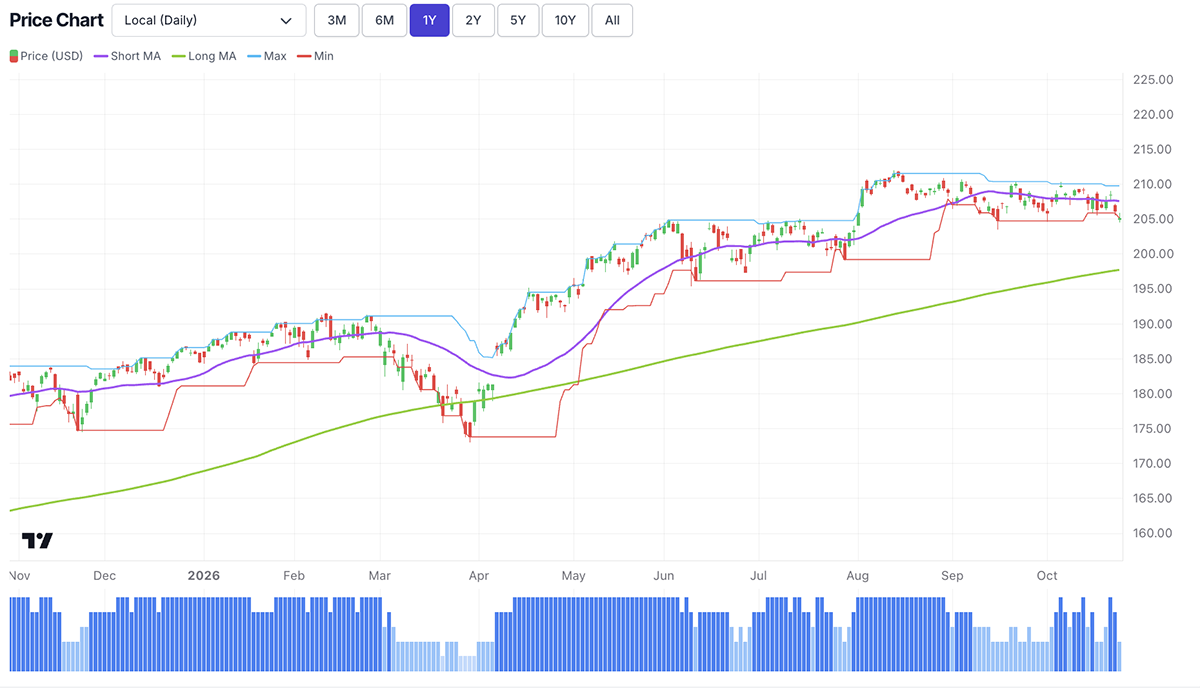
The World Index has a ByteTrend Score of 2 in USD. All short-term signals are bearish, although the long-term trend remains intact. Time will tell if this is a blip or something bigger.
iShares MSCI World ETF (URTH): Developed Markets – Daily, 1-Year
Bonds Outperform Equities in October
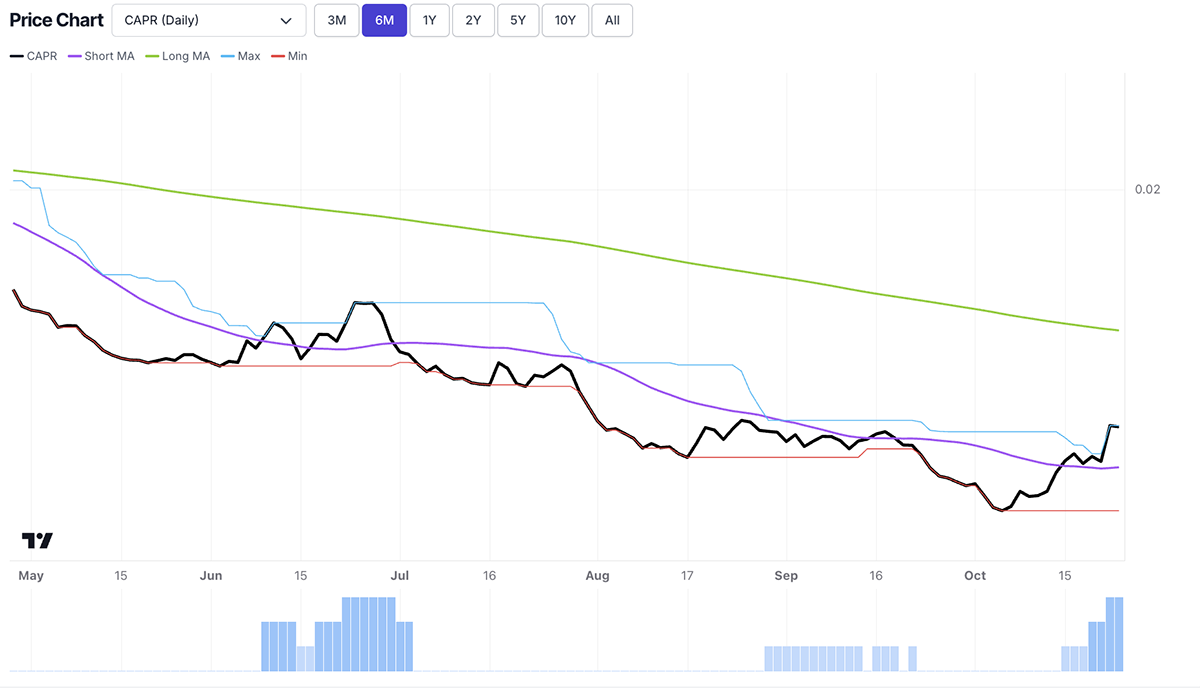
Bonds are not easy to analyse using trends, as we typically think of them in yield and spread terms. However, TLT, the major US bond market ETF, is driven by bond prices, which means we can use it as a proxy for the US bond market. In CAPR, this shows whether US bonds are under- or outperforming world equities. Bonds have been in a five-year bear market, but in October, they suddenly surged relative to equities. This was a flight-to-quality move, meaning high-risk stocks were sold for low-risk US government bonds and other defensive assets.
TLT Weekly CAPR over 6 Months
Market Breadth
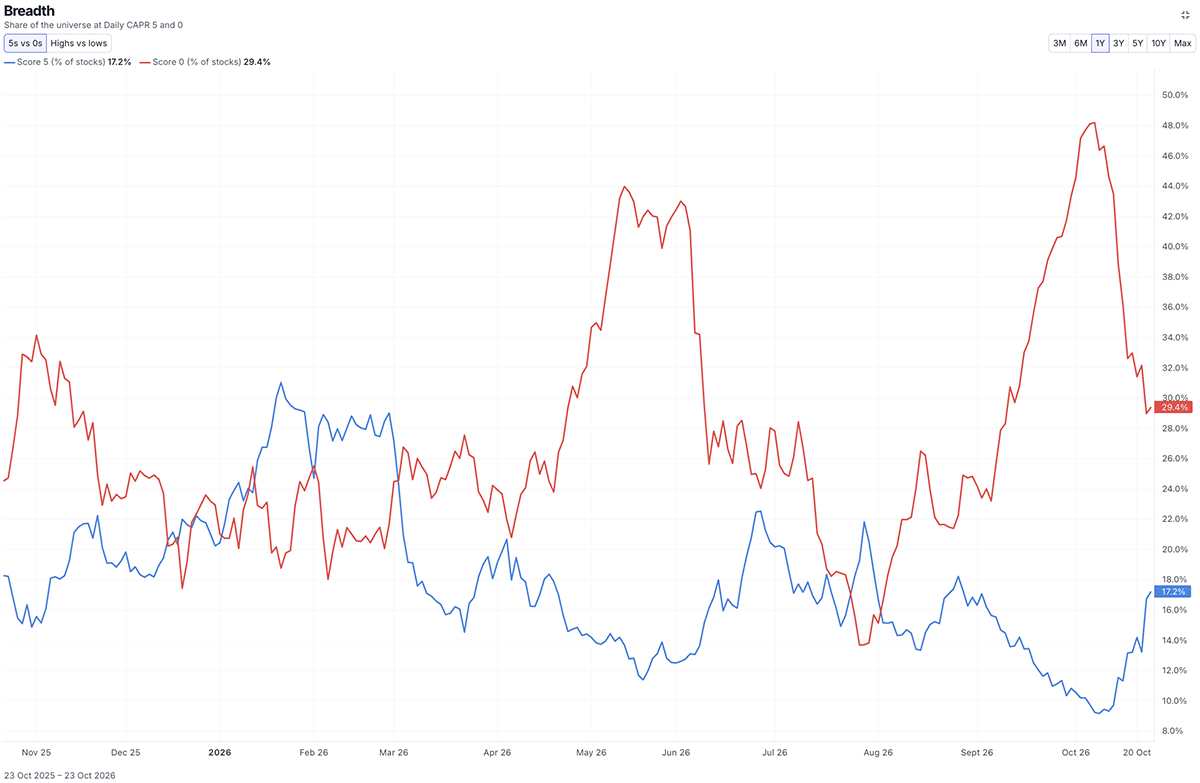
This rotation is also visible in market breadth. In September, we showed that the market was at its narrowest point since at least the 2008 financial crisis. This situation has now begun to reverse, as the momentum effect has seen past winners rotate into today’s losers.
The breadth rotation continued last week, and to capture the short-term shift in October, we use daily data, rather than weekly. We can see that the number of stocks with a daily trend score of 0 was extremely high in September, but it has now fallen by nearly half, from 48% to 29%. Meanwhile, the number of stocks with a score of 5 (the winners) has nearly doubled, from 9% to 17%.
World Market Beta Breadth (in price) – Daily, Past Year
Breadth Weekly - Local Currency
Yet overall, beta breadth (price trends) is still in decline. The chart below shows how many stocks are losers (red) and winners (green) in price terms. There are still more absolute winners than losers. The neutral stocks, in beige, are largely irrelevant in trend terms.
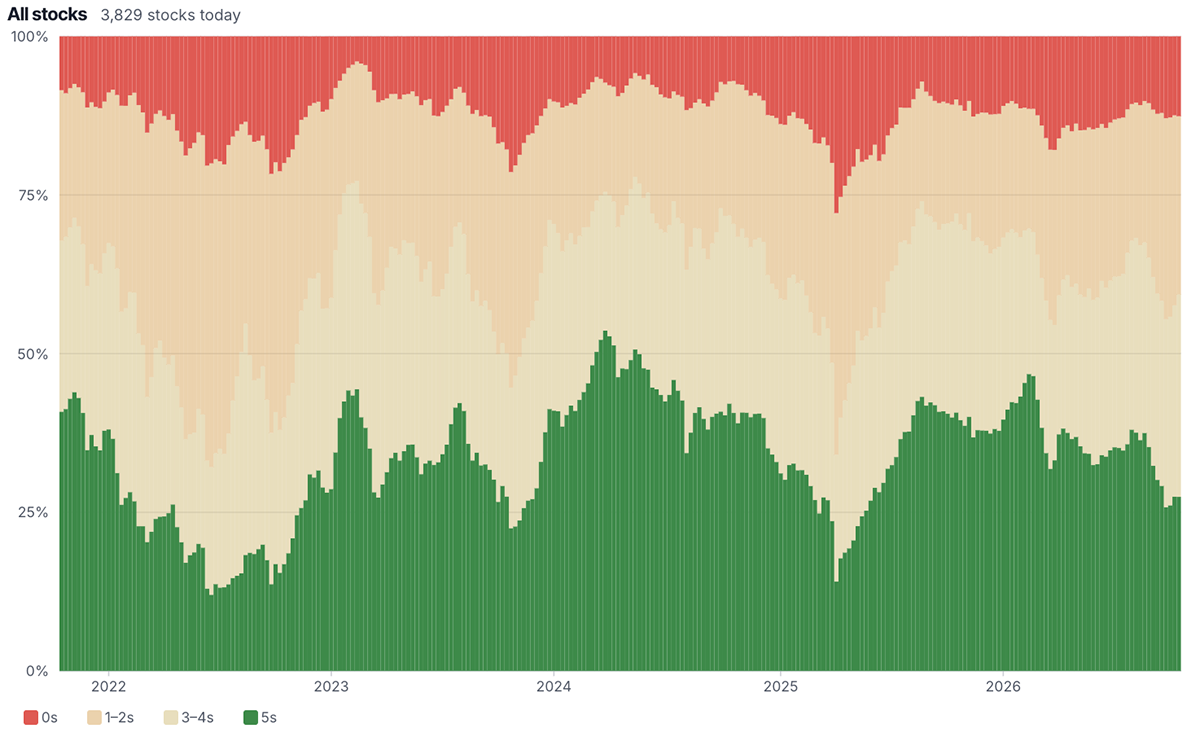
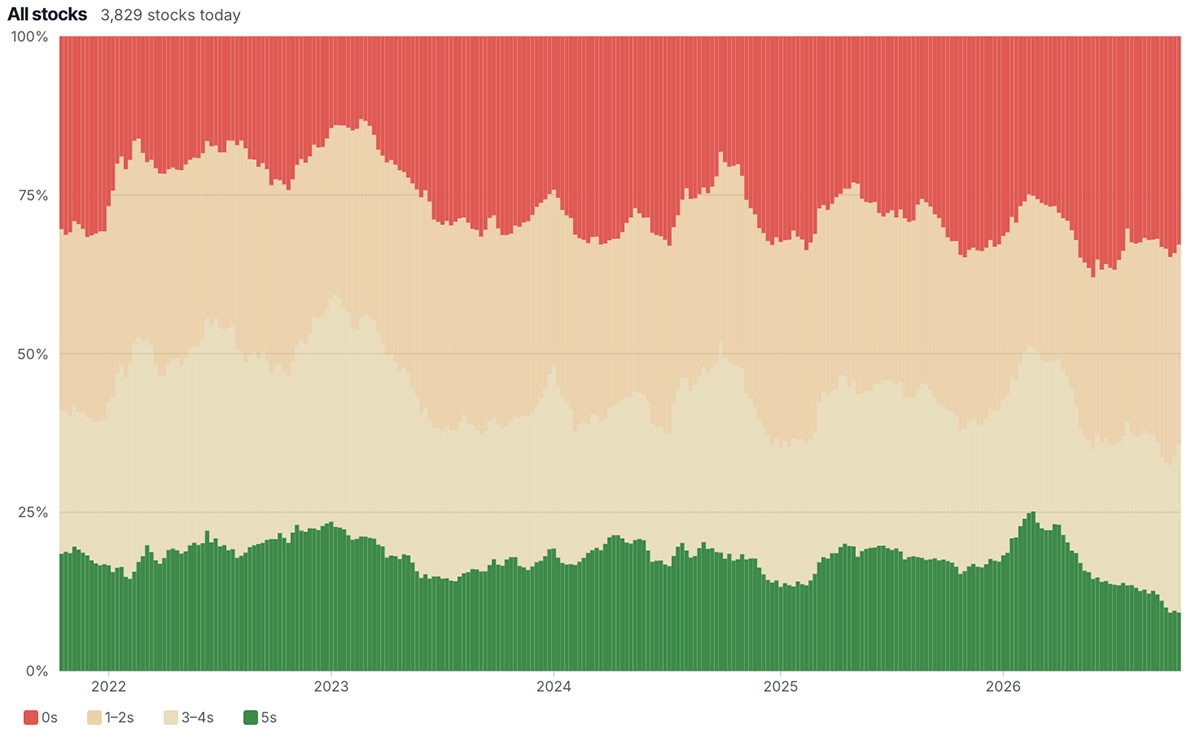
In relative terms (CAPR), this changes. Here, there are far more losers than winners. Notably, 33% of stocks are 0s (red), while just 9% are 5s (green). The world looks different in CAPR.
Alpha Breadth (Weekly CAPR)
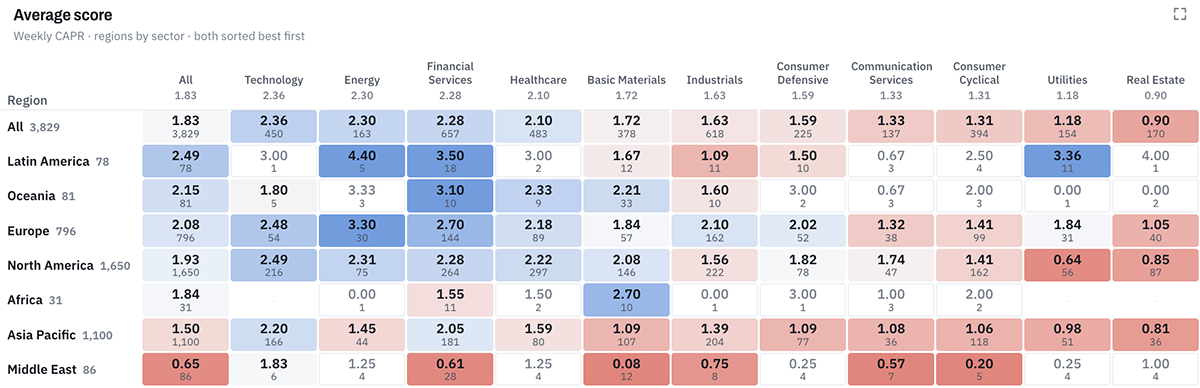
Region and Sector Average Trend Scores
Broken down by region and sector using weekly CAPR scores, Technology remains the strongest and Real Estate the weakest. However, if we zoom in, the picture changes.
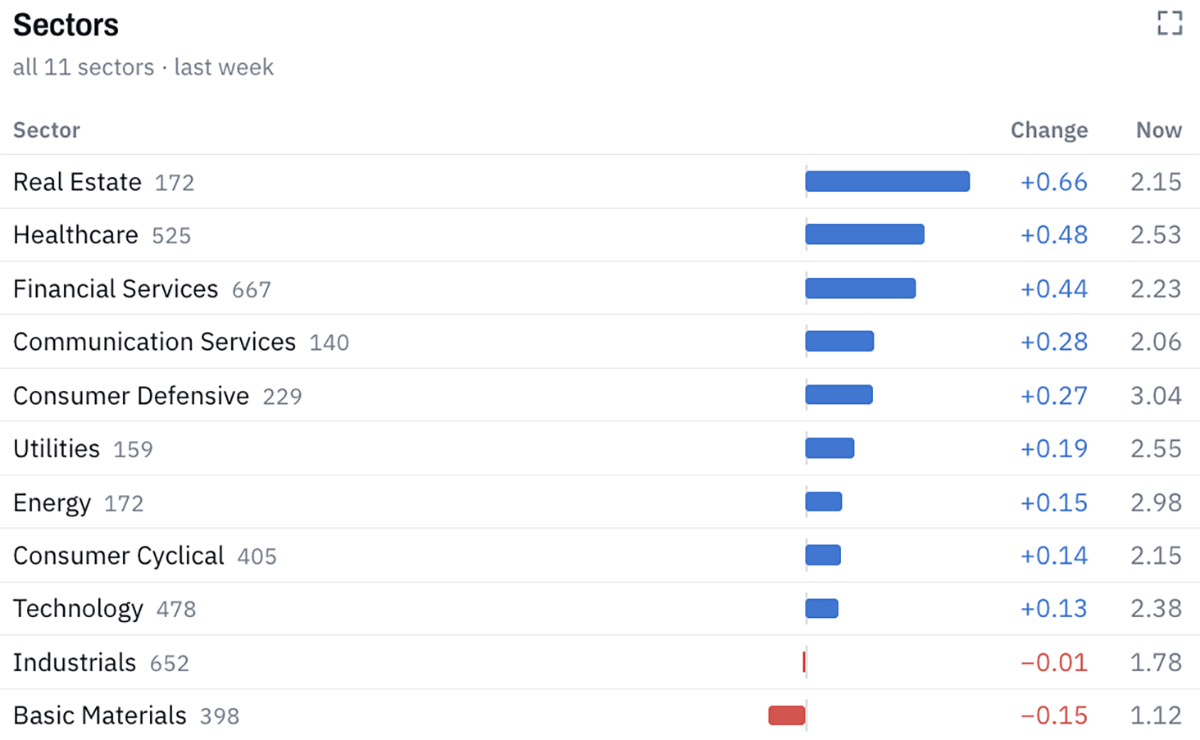
Sectors
This shows the one-week change in average Weekly CAPR score. No surprises here: we have flagged Real Estate as the weakest sector throughout the summer and early autumn. With low valuations, they were ripe for a bounce when yields fell, which they have now done. Their high dividend yields and stable profiles are more attractive than lower-yield sectors, hence the inverse relationship. Meanwhile, Tech and Industrials are among the biggest fallers.
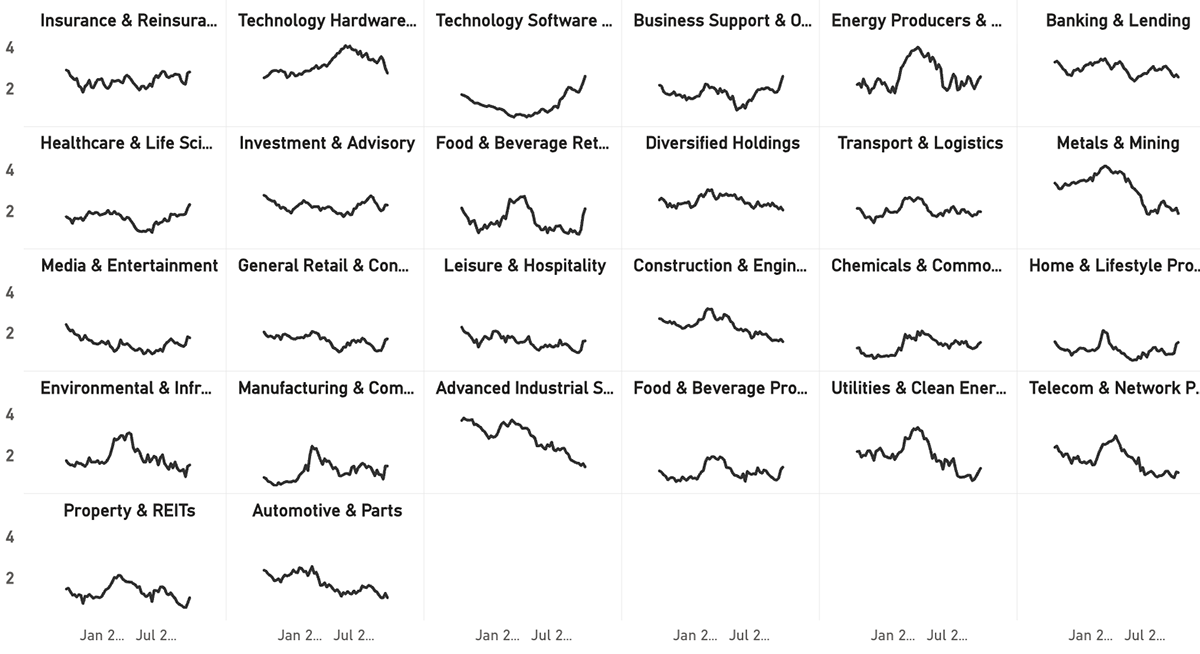
Industries
Tech Hardware has led the market for a long time, but is now giving up ground and feeding alpha back into the rest of the market. Software has staged an extraordinary recovery and is back up to third place in the industry trend rankings. Healthcare and Life Sciences have been strengthening for several months, while Food & Beverage stocks have surged dramatically this month. REITs are surging off a very low base.
The Metals & Mining industry is weak, perhaps because data centre demand for metals like copper drove that trend, while gold and silver have also weakened. Advanced Industrials are also closely tied to the AI trend, as these companies are directly involved in building it. They too are weakening.
Semiconductors
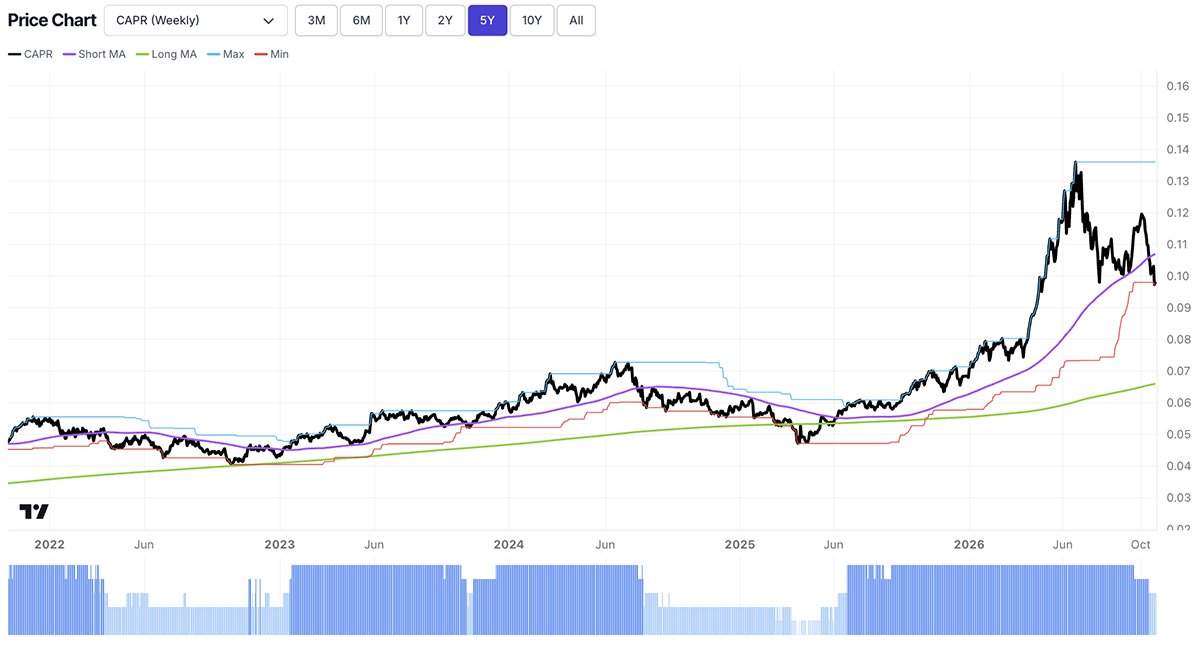
The most notable trend change is in semiconductor stocks, shown here by the SOXX ETF. These have been in a bull market since early 2023, enjoying a (nearly) uninterrupted weekly CAPR score of 5 since June 2025. However, over the past month, the weekly trend has slipped to a 4 and is now a 3. Meanwhile, its daily CAPR score is now a 1. Having failed to make a new relative high, it has broken below its 30W CAPR moving average and is making new relative lows. This is a bearish chart for semis.
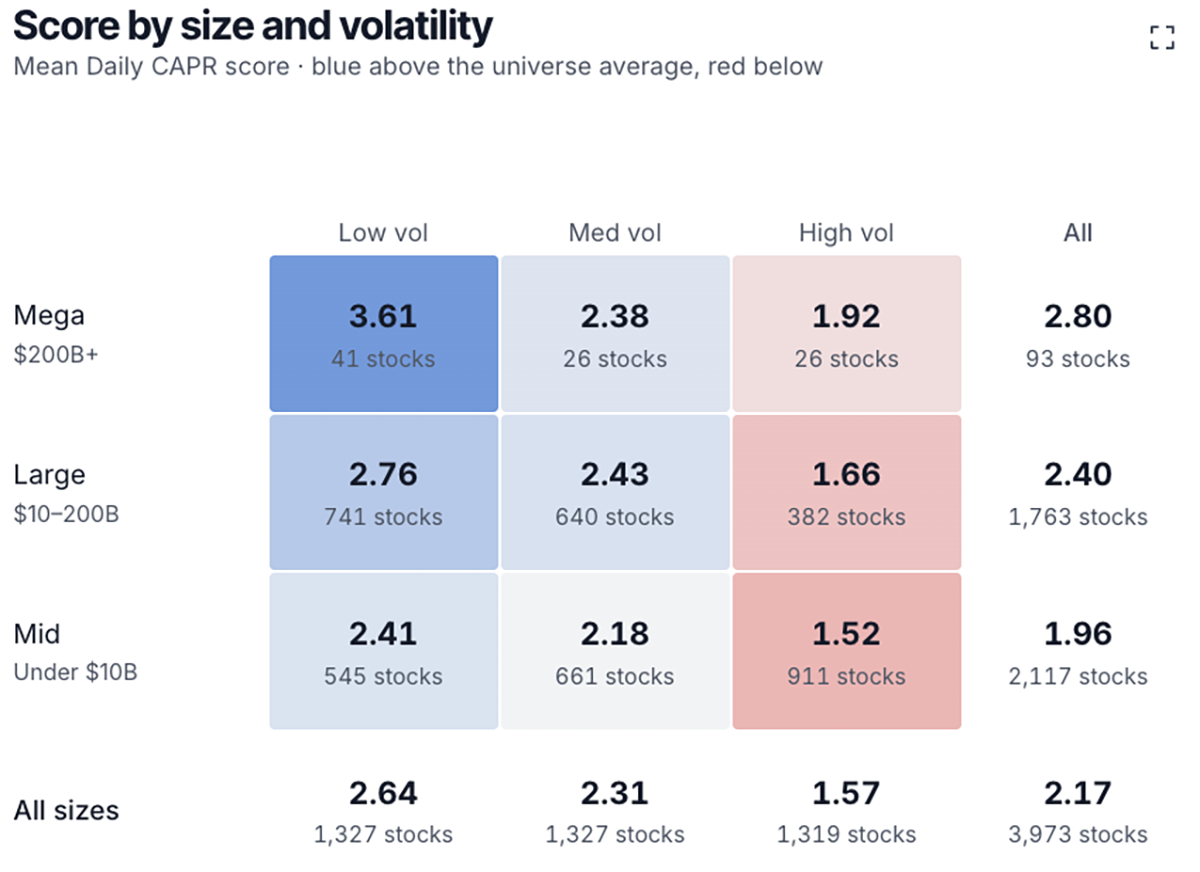
Size and Volatility
In a dramatic shift, low-volatility stocks are now the strongest daily CAPR trend group, following a long period of high-volatility stocks leading the market. Mega-caps still dominate, so no change there. Like the sudden outperformance in bonds, this fits the “flight to quality” narrative.
Trend Type Performance
Emerging trends are exploding in number, as many weak stocks suddenly strengthen, and vice versa. These may become leading trends or fade; emerging trends require careful stock selection.
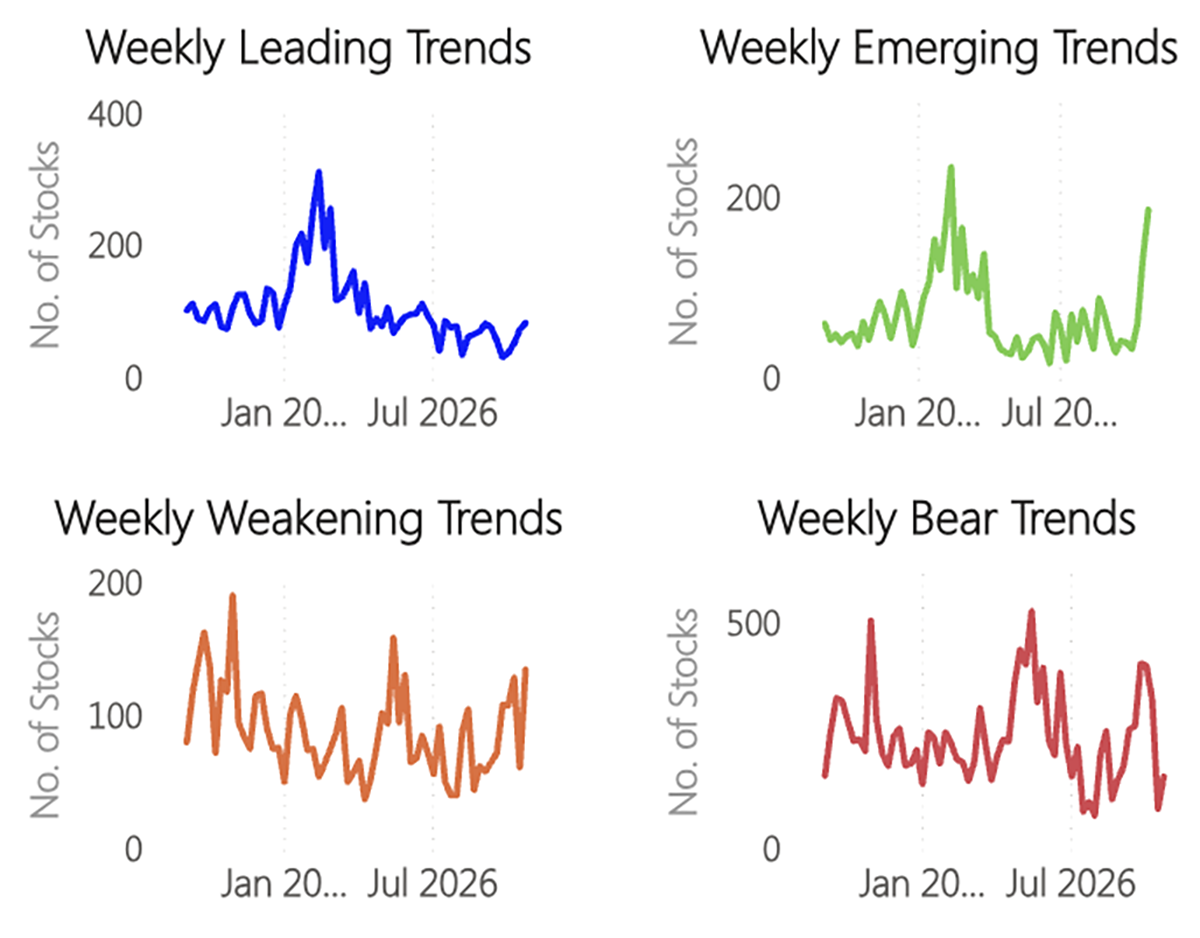
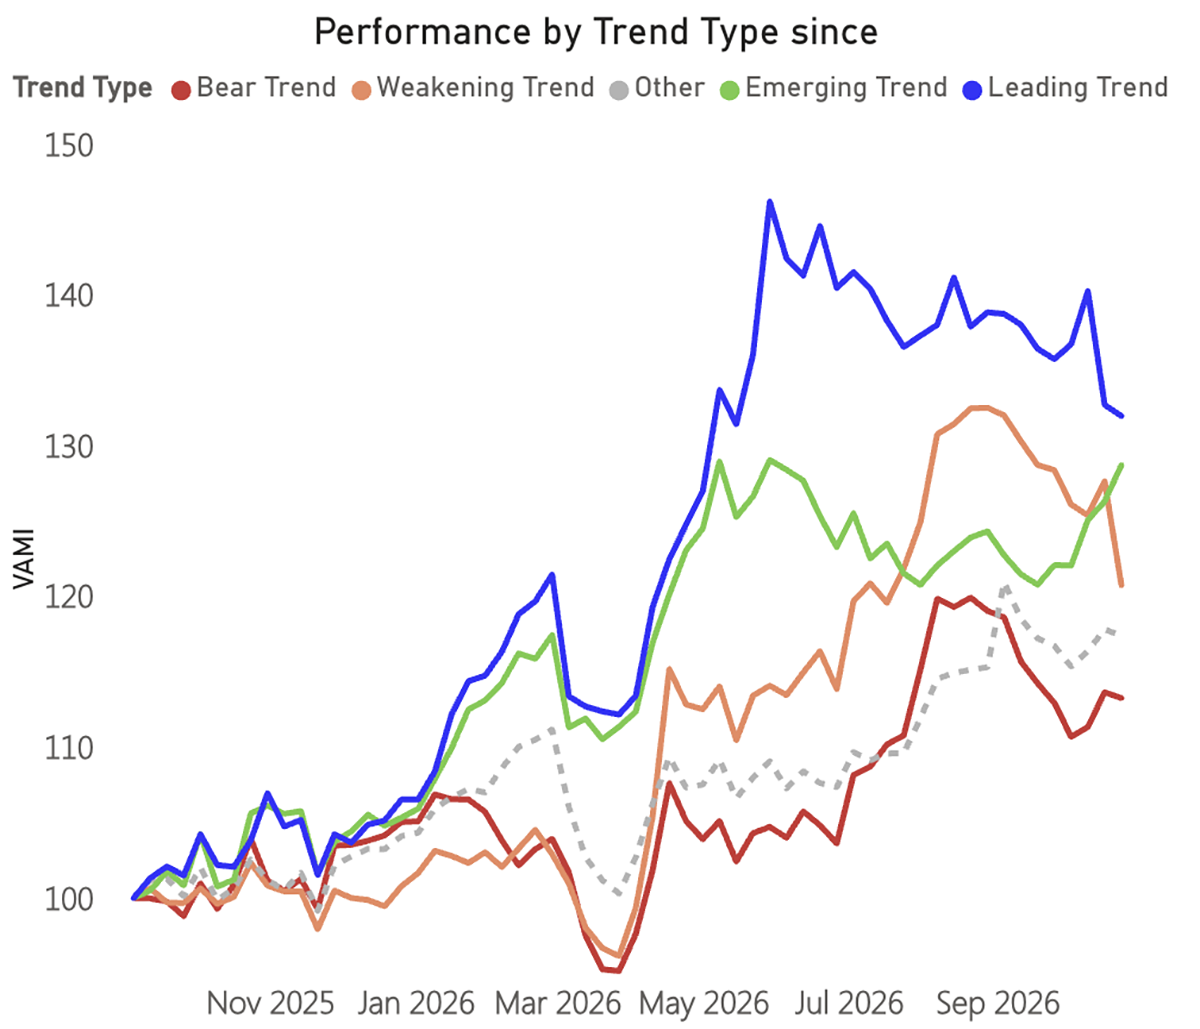
Looking at how each trend group has performed, the number of weakening trends (stocks making new relative lows but not yet at a weekly trend score of 0) fell sharply this week. This is because the many stocks that soared and extended far above their moving averages are being aggressively pulled back to reality. Emerging trends saw the opposite effect. Oversold and overbought stocks are being brought back into line.
Performance of Trend Groups
Outlook
The stock market in 2026 has seen many extremes, and these are now being brought back into line as a traditional “flight to quality” sees risky, overbought stocks sold in favour of defensive stocks and bonds. If this continues, Real Estate and other rate-sensitive sectors look attractive, while overvaluations in Technology and AI-adjacent areas are yet to be fully unwound.
While there is plenty of room for this trend rotation to continue, the same has been true before, which didn’t stop the tech bull market from grinding ever higher. The coming weeks will tell us whether this is a true shift in markets, or just another dip to buy. As always, the trends will show us the way.
Thanks for reading the Global Trends Investor. Please follow us on X for more charts and trend analysis.


