
Peace Triggers Rotation


Issue 65;
- Peace in Iran sees oil fall, while gold bounces
- Major rotation as the weakest stocks bounce
- Asia struggles
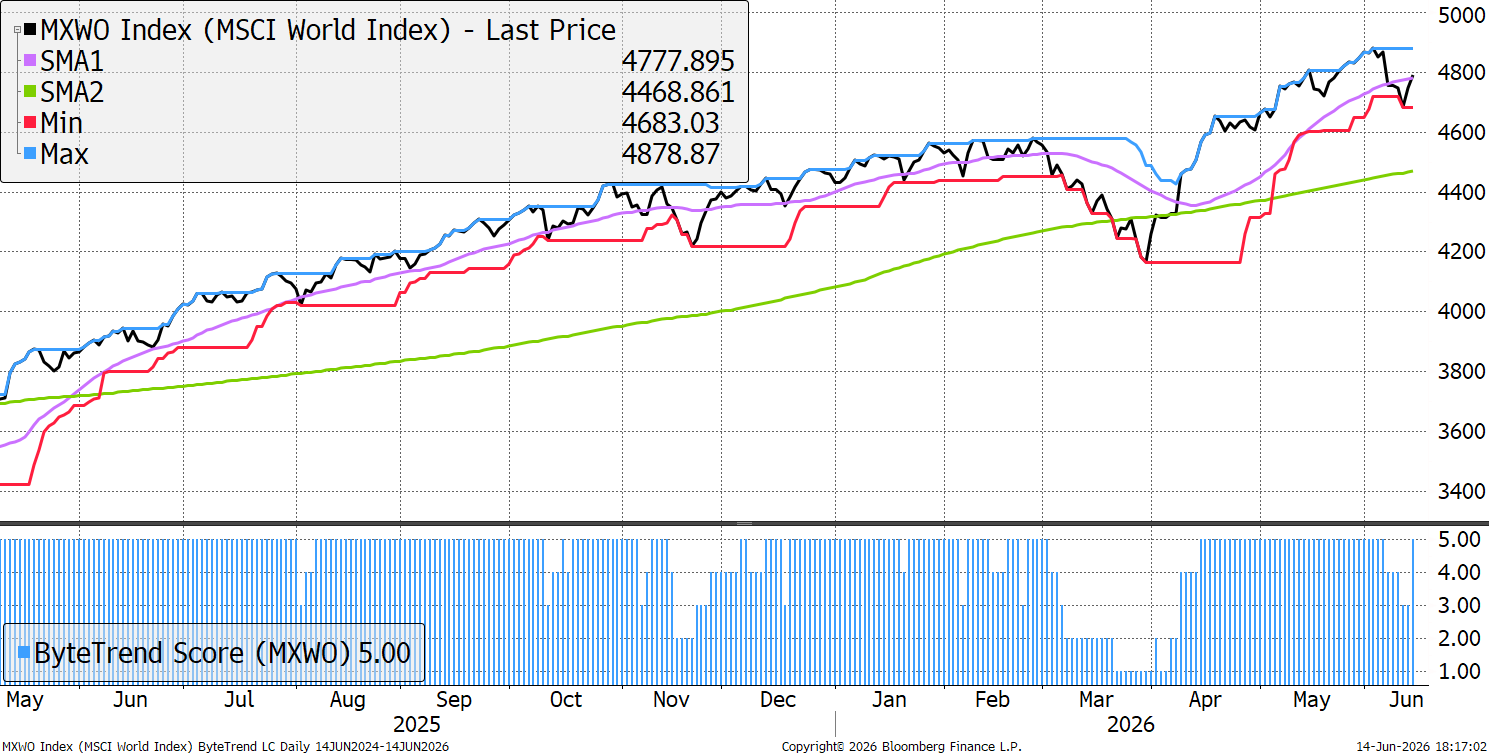
The World Index returns to a bullish ByteTrend Score of 5 in USD. The price has moved back above the 30-day moving average.
World Index – Developed Markets – Daily
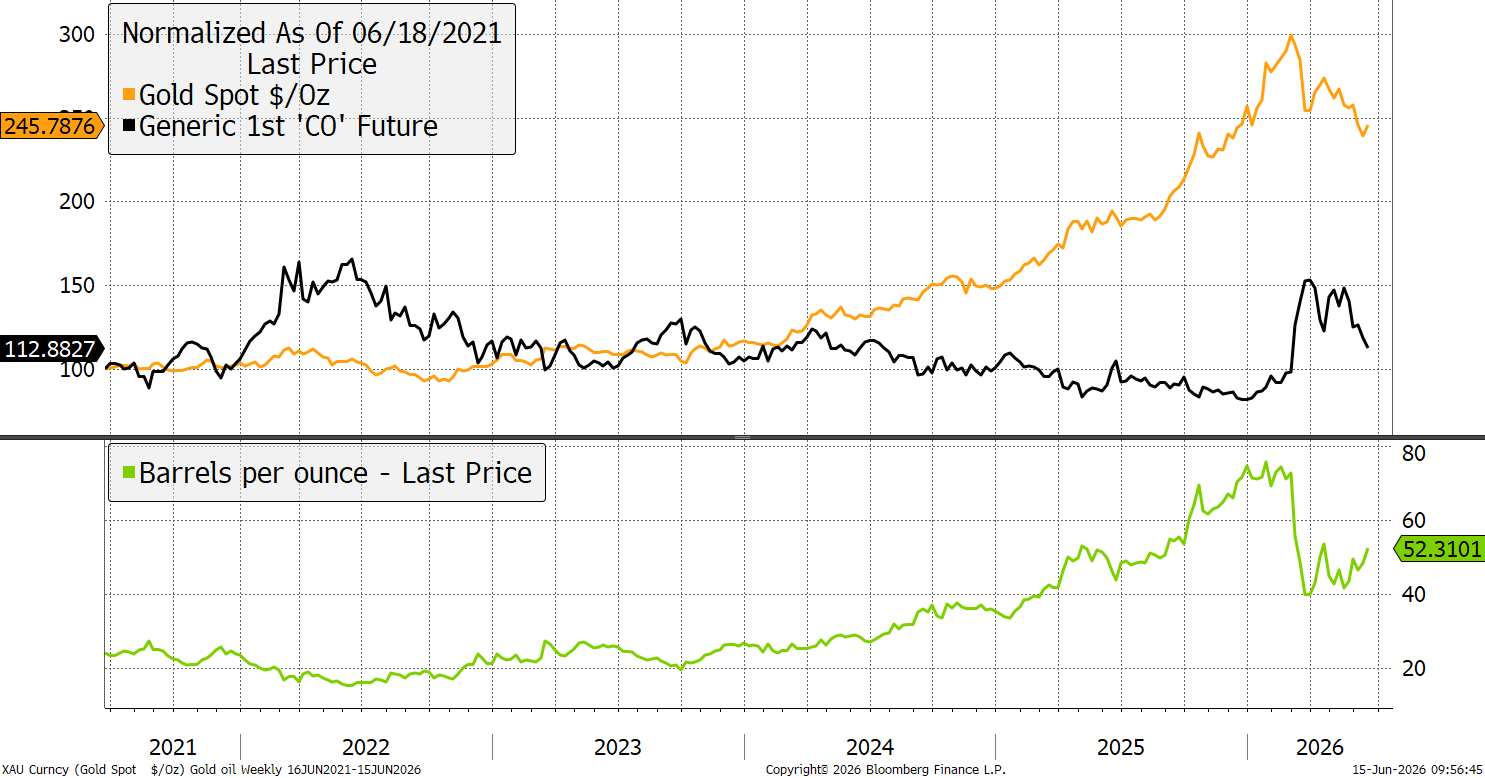
Gold versus Oil
As peace in the Straits of Hormuz seems more likely, gold has made a low, while the oil pullback continues.
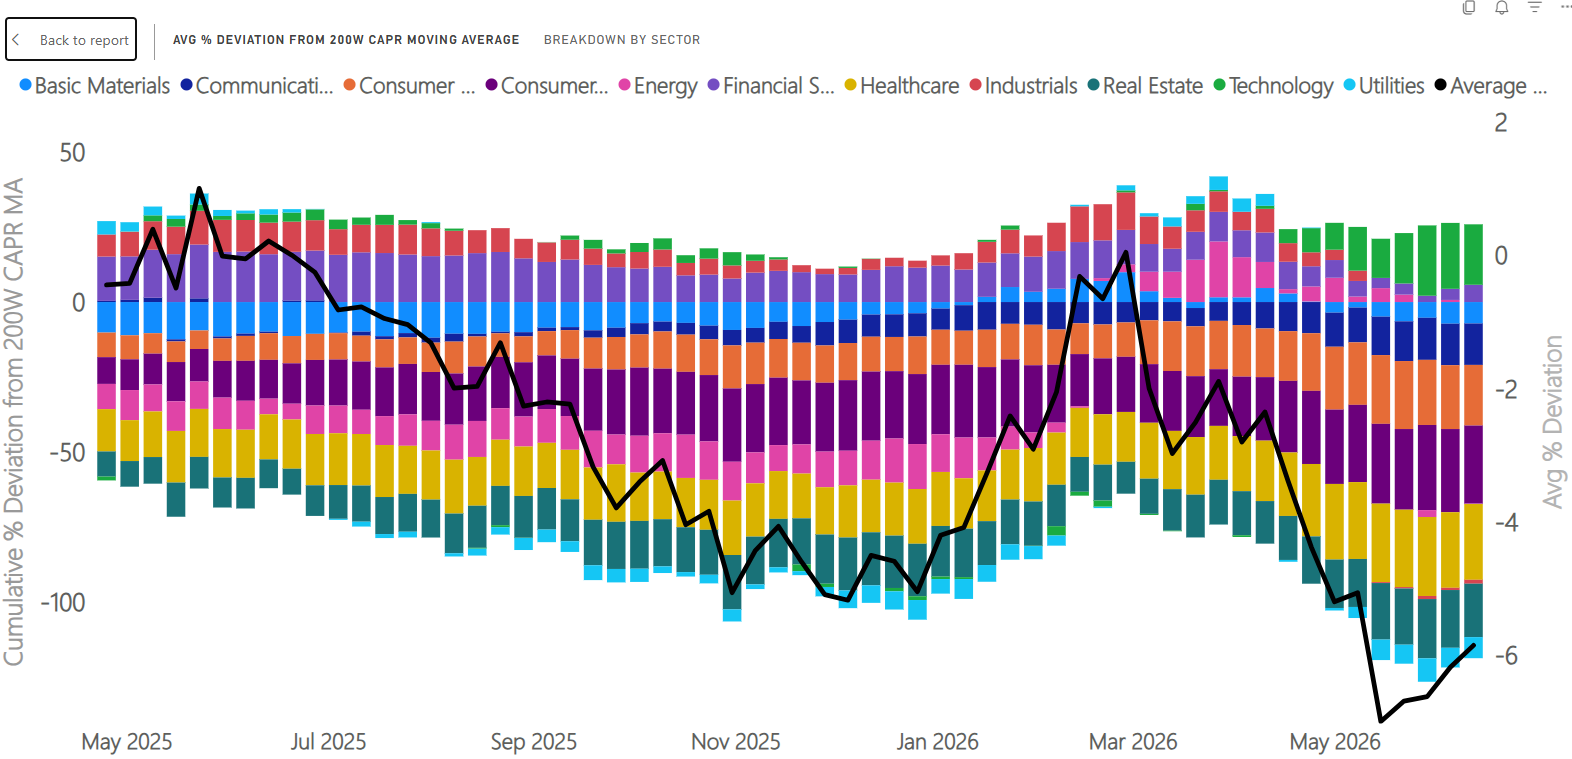
Market Rotation – CAPR
The charts shows the average stock’s deviation from its 200-week moving average in CAPR i.e. a winner is above trend, and positive, and a loser below trend. The stocks are averaged by sector, giving an interesting perspective of global markets. Firstly, few sectors are above zero, mainly tech. Secondly, the black line is an overall average for our universe. The black line is now rising, implying that a major rotation is underway in favour of previously underperforming stocks.
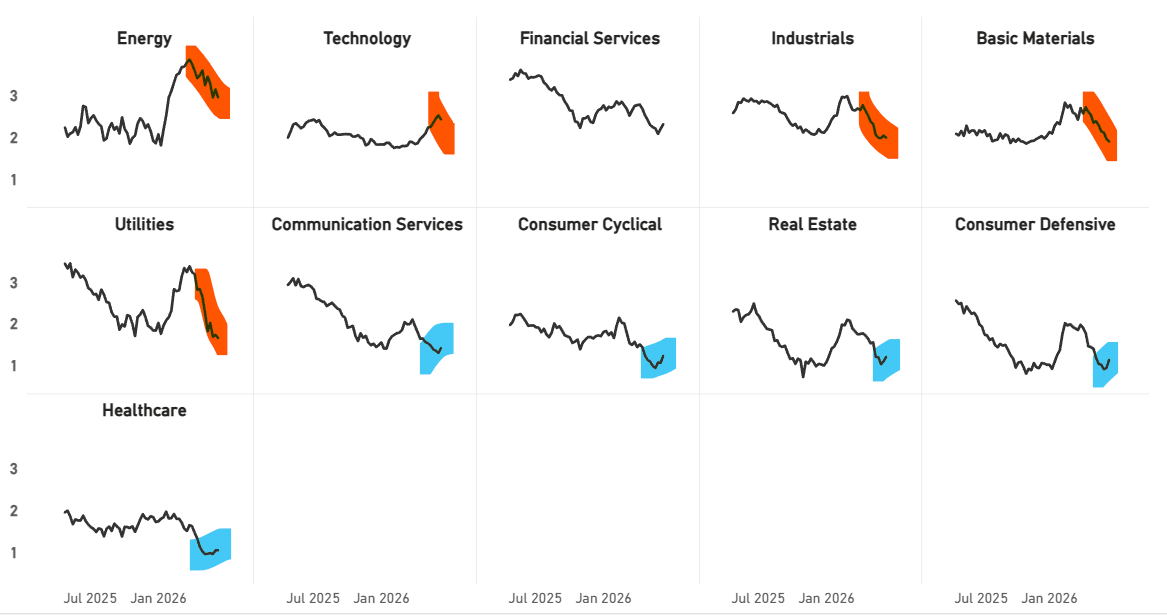
Sector Trend Changes in CAPR
That can be seen in the sector charts. The strongest have given back some ground, while the weakest are bouncing for the first time in several weeks.
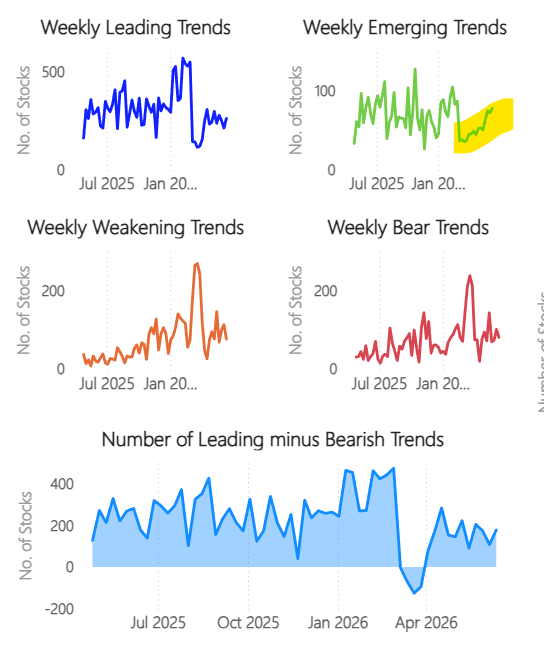
Global Trend Classification – Local Currency
The leaders are stable while the number of new weak and bear trends is softening. The emerging trends are accelerating, implying that previously weak stocks are recovering. It takes time for a 200-week moving average to turn positive, so this shows up much earlier in emerging trends than leading trends.
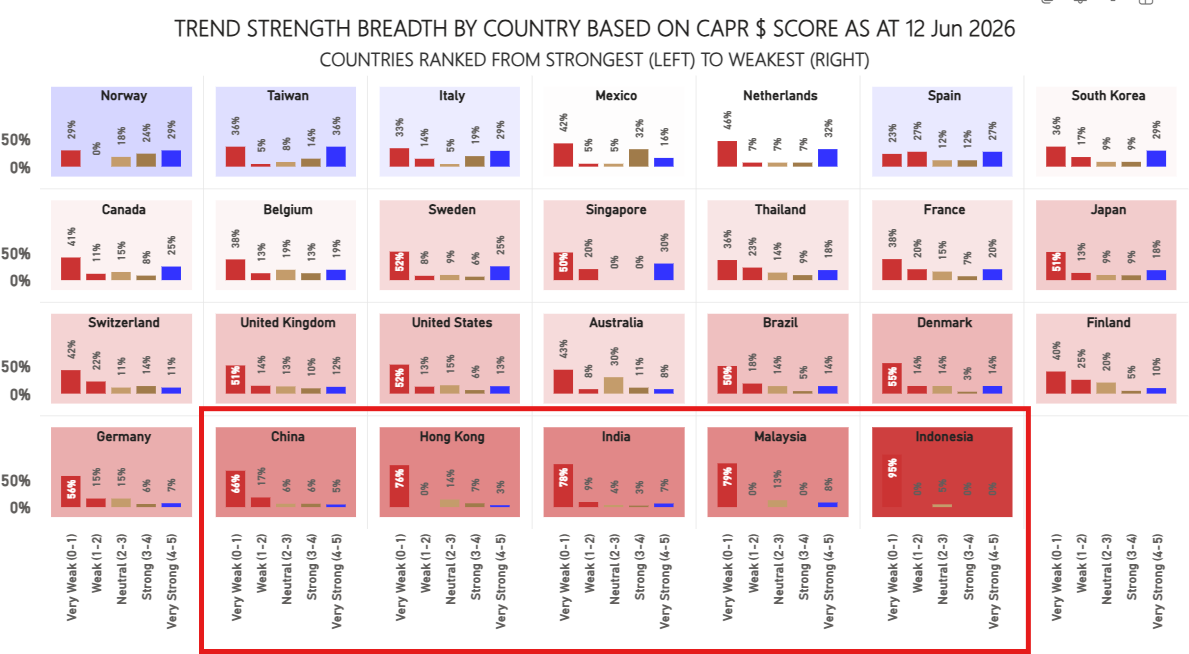
Trend Strength by Country – Asia is weak
By country, Europe fares well. Most Asian countries are weak, Korea and Taiwan excepted.
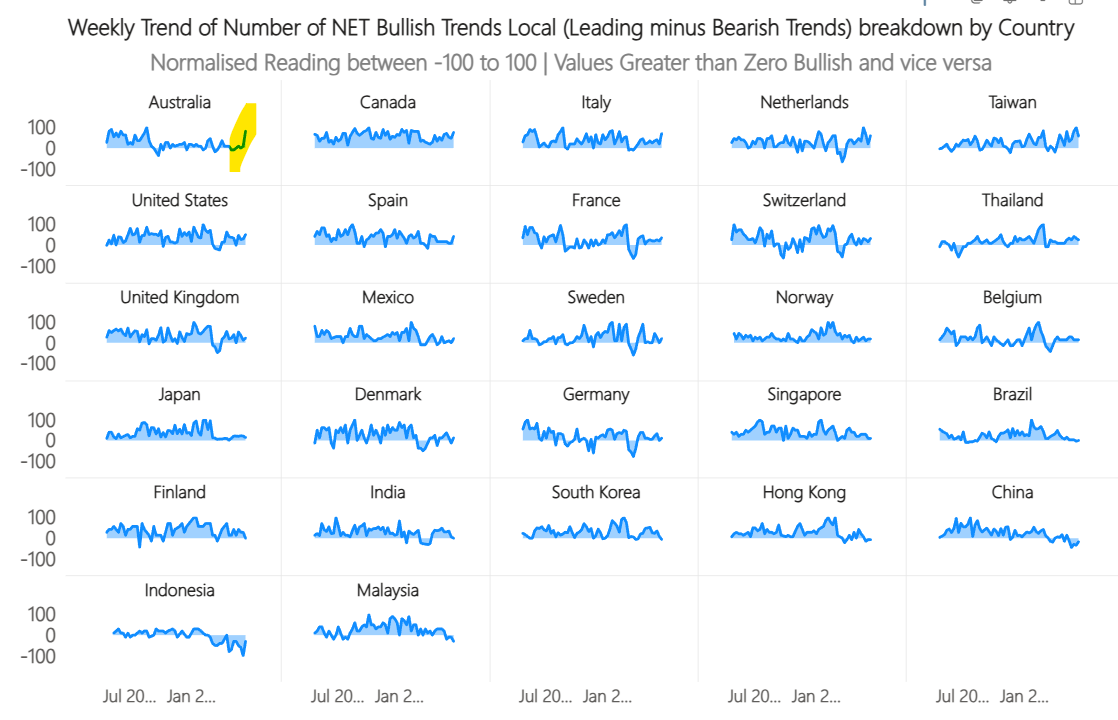
Weekly Trend net Bullish – Bearish - Australia
Australia is a notable standout this week, with a bullish move across most stocks. The RBA is thought to be easing their stance on rate hikes. A gold bounce would also help.
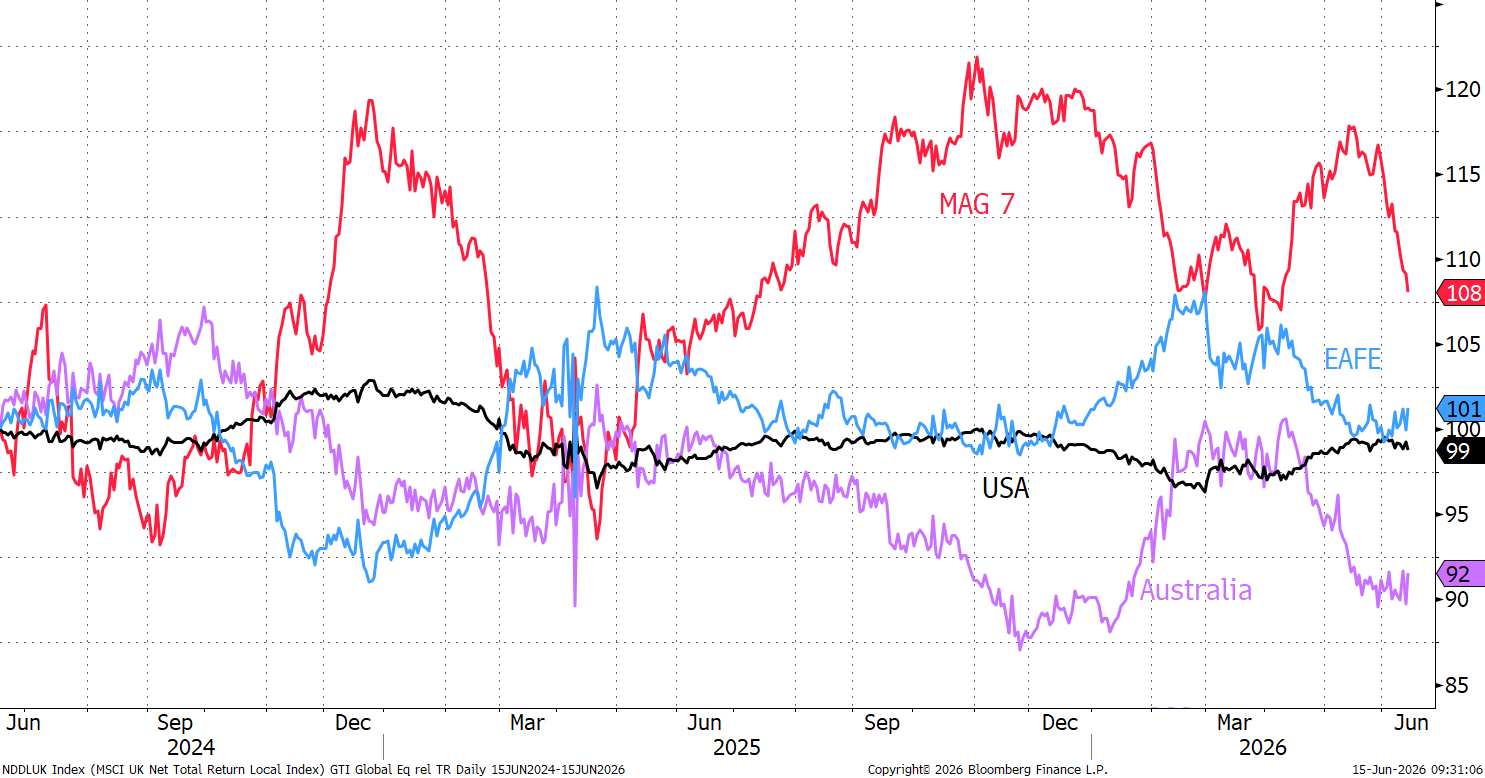
Global Stock Markets
Australia has been weak for the past two years and looks to be rebounding. EAFE (the developed world ex-USA) is stable. The USA is weakening slightly, while the MAG 7 has given back significant ground since April.
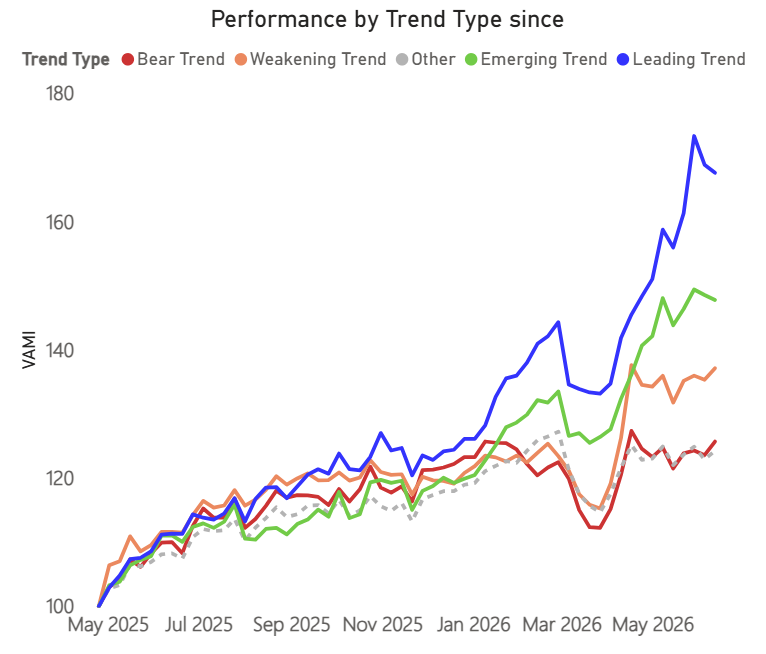
Trend Type Performance
Globally, the leaders have done their best for the time being, and the rotation into the laggards has begun
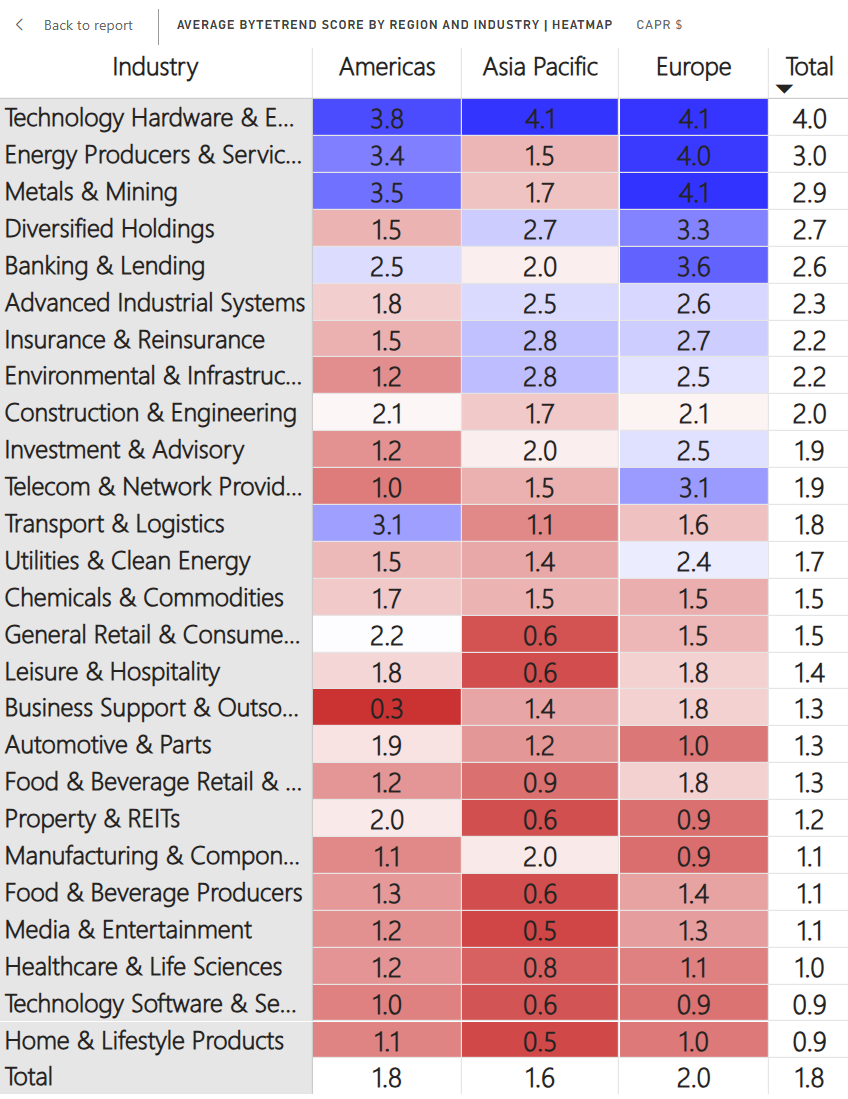
Regions and Industries Average Relative Score
This table (below) shows the average CAPR score for each global industry, by region and in total.
At the top of the table, Tech Hardware remains king, but softened in relative terms, while Banking & Lending picked up again. Materials and Industrials continued to weaken from their previously strong trends. European Telecoms are a standout, showing a much stronger trend than the rest of the world.
In the middle of the table, Insurance, Telecoms, Retail, and Transport stocks are all showing promise. In Asia, Construction and Engineering is weakening sharply, along with Chemicals and Commodities, which together signal some economic concerns there. Their Energy and Materials sectors are also notably weaker than in Europe/Americas.
At the bottom of the table, Home & Lifestyle (luxury) products picked up sharply after a weak period, while software slipped again after a rebound. Food & Beverage stocks continued their rebound, however. In Europe, REITs are the second weakest sector, as the central bank returned to rate hikes last week, while its Auto sector shows no signs that it can resist the competitive threat from Asia.
User Guide
Refer to our GTI: User Guide for an overview of the key concepts and terminology used in this report. These concepts may take a little bit of getting used to, but they are very powerful once you do.
Leading Trends with New Highs
These stocks are trading at the 30-week CAPR highs with a ByteTrend Score of 5. All charts shown are CAPR rebased to 100.
| Name | Annual Vol 30w | Mkt Cap $Bn | Industry |
| Samsung Electronics Co., Ltd. | 51 | 1417 | Technology Hardware |
| Micron Technology, Inc. | 83 | 1107 | Technology Hardware |
| Advanced Micro Devices, Inc. | 73 | 834 | Technology Hardware |
| ASML Holding N.V. | 37 | 727 | Technology Hardware |
| Lam Research Corporation | 58 | 459 | Technology Hardware |
| Applied Materials, Inc. | 53 | 450 | Technology Hardware |
| Caterpillar Inc. | 29 | 419 | Environmental |
| Morgan Stanley | 26 | 338 | Investment & Advisory |
| KLA Corporation | 58 | 333 | Technology Hardware |
| The Goldman Sachs Group, Inc. | 24 | 314 | Investment & Advisory |
| Royal Bank of Canada | 15 | 279 | Banking & Lending |
| Marvell Technology, Inc. | 65 | 245 | Technology Hardware |
| Citigroup Inc. | 31 | 238 | Banking & Lending |
| BHP Group Limited | 31 | 225 | Construction & Engineering |
| Seagate Technology Holdings plc | 59 | 209 | Technology Hardware |
| Western Digital Corporation | 52 | 194 | Technology Hardware |
| Tokyo Electron Limited | 45 | 194 | Technology Hardware |
| The Toronto-Dominion Bank | 15 | 194 | Banking & Lending |
| Palo Alto Networks, Inc. | 53 | 191 | Software & Services |
| Interactive Brokers Group, Inc. | 37 | 156 | Banking & Lending |
| Delta Electronics | 52 | 138 | Advanced Industrial |
| Bank of Montreal | 17 | 118 | Banking & Lending |
| Fortinet, Inc. | 53 | 107 | Software & Services |
| Cadence Design Systems, Inc. | 38 | 106 | Software & Services |
| Marriott International, Inc. | 25 | 106 | Leisure & Hospitality |
| CaixaBank, S.A. | 27 | 96 | Banking & Lending |
| Recruit Holdings Co., Ltd. | 52 | 94 | Business Support |
| Monster Beverage Corporation | 27 | 91 | Food & Beverage Producers |
| FedEx Corporation | 29 | 81 | Transport & Logistics |
| Assicurazioni Generali S.p.A. | 24 | 71 | Insurance & Reinsurance |
| Simon Property Group, Inc. | 19 | 71 | Property & REITs |
| STMicroelectronics N.V. | 45 | 70 | Technology Hardware |
| United Rentals, Inc. | 51 | 67 | Transport & Logistics |
| Manulife Financial Corporation | 20 | 67 | Insurance & Reinsurance |
| BOC Hong Kong (Holdings) Limited | 21 | 65 | Banking & Lending |
| W.W. Grainger, Inc. | 26 | 62 | Construction & Engineering |
| Nucor Corporation | 30 | 61 | Metals & Mining |
| ASM International N.V. | 43 | 57 | Technology Hardware |
| Yageo Corporation | 79 | 56 | Technology Hardware |
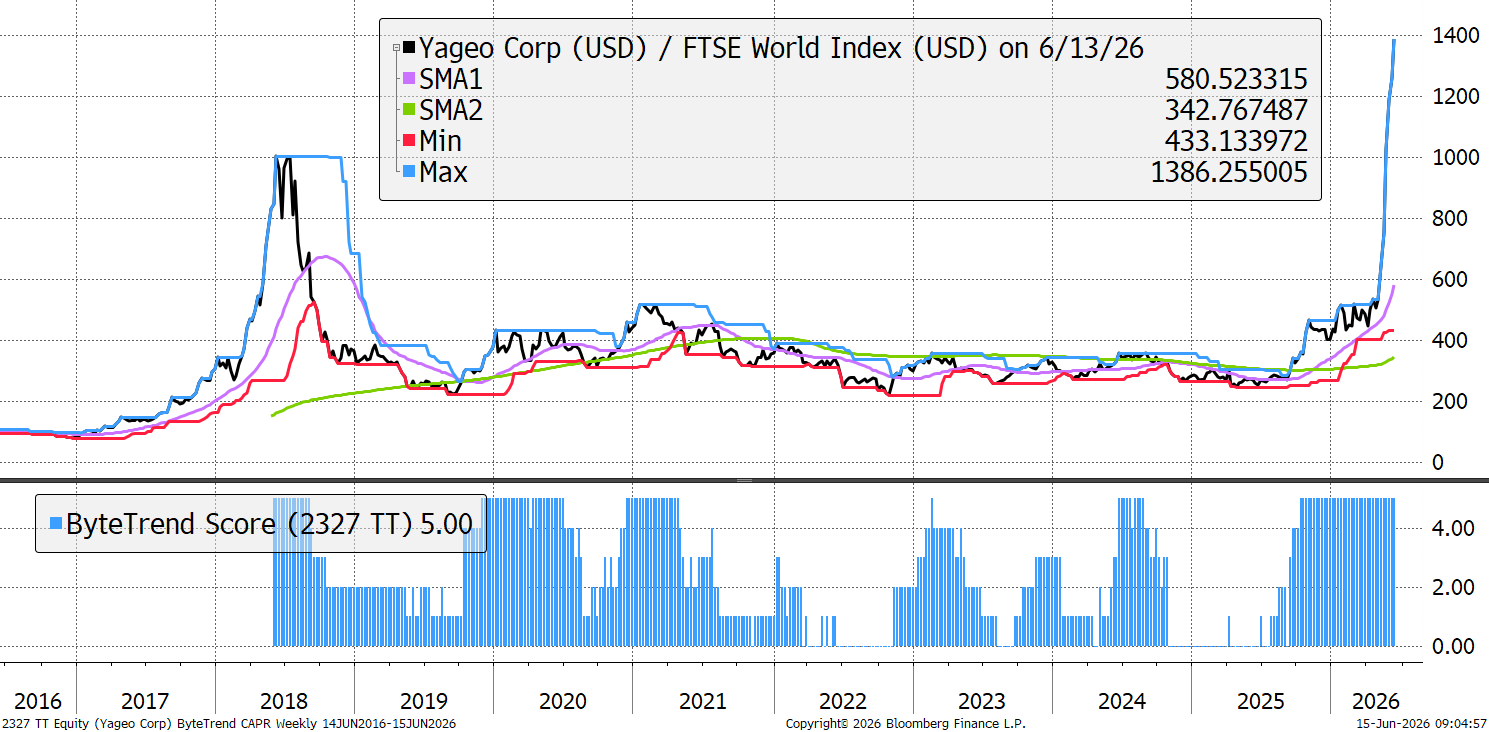
Yageo Corporation
Taiwanese electronics company Yageo is arguably the strongest trend in our universe, as the Leading Trend that is furthest above its 30-week lows (294% above). It makes “passive” components like resistors and capacitors, was founded in 1977, and serves an elite global client base. In price terms, it is up 625% over the last year, as sales and profits have soared.
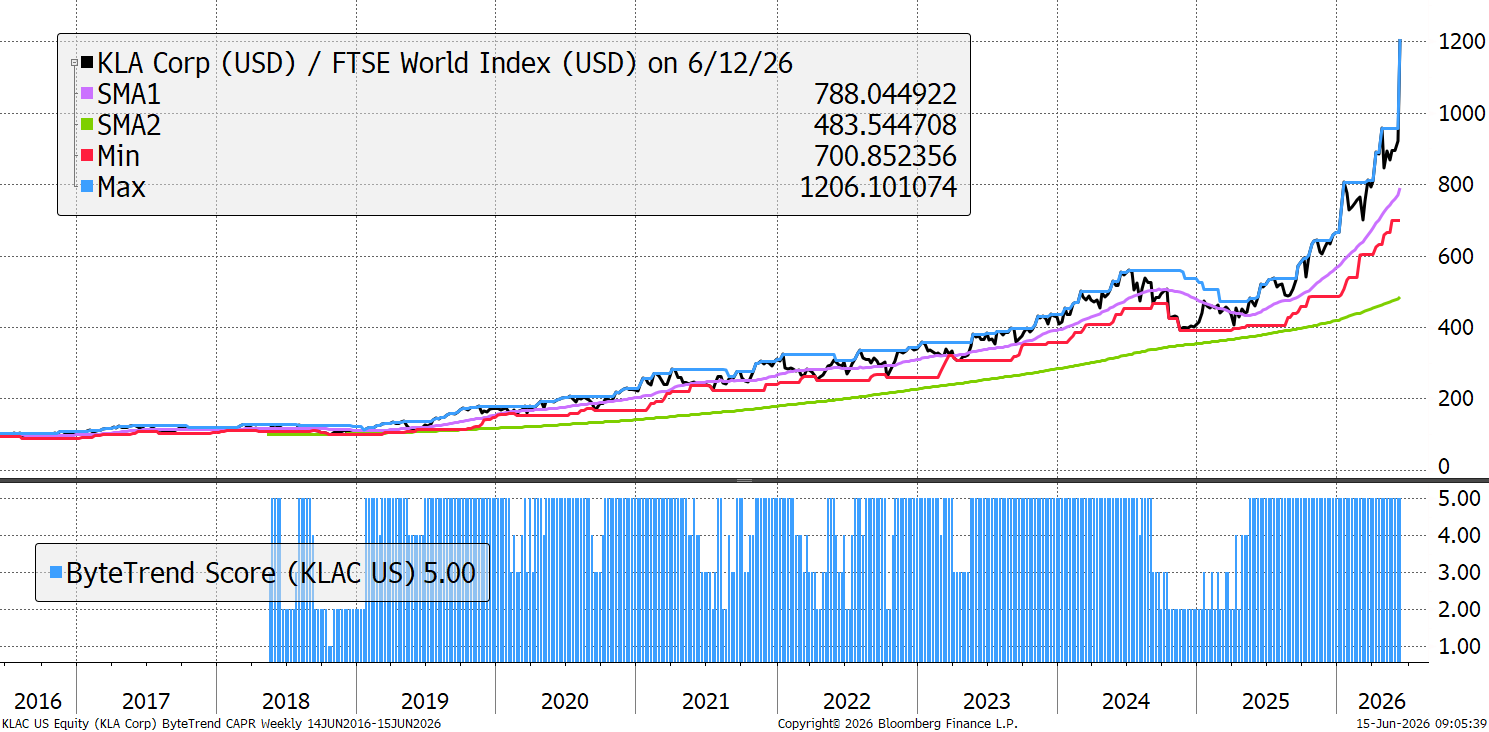
KLA Corporation
KLA Corp makes wafer fab equipment focused on inspecting wafers for defects and measuring patterns during integrated circuit manufacturing. Its clients are top global chipmakers including TSMC and Samsung, and while it undoubtedly plays a key role in the AI boom, revenue growth has actually slowed from 30% to 11.5% over the last year, while the Price/Sales multiple has reached 25x, a higher level than its record of 16x in 2000.
New Leading Trends
These stocks are trading at the 30-week CAPR highs with a ByteTrend Score of 5, except they are new trends this week, having previously had a score below 5. All charts shown are CAPR rebased to 100.
| Name | Annual Vol 30w | Mkt Cap $Bn | Industry |
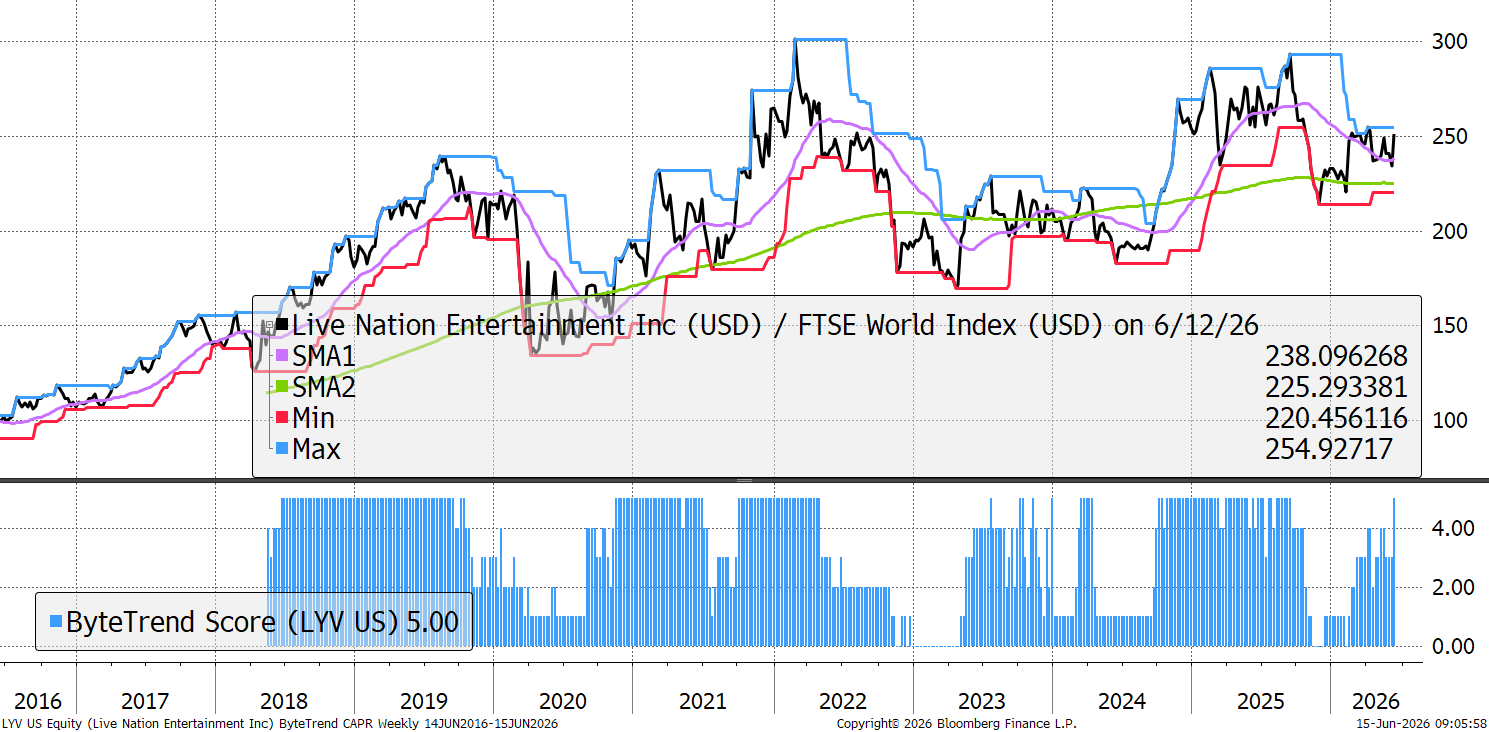
| Live Nation Entertainment, Inc. | 28 | 40 | Media & Entertainment |
| BPER Banca S.p.A. | 35 | 31 | Banking & Lending |
| Banco BPM S.p.A. | 32 | 25 | Banking & Lending |
Live Nation
The concept of the authenticity premium says that the more authentic something is, the more valuable it is. After they first discovered how to grow emeralds in a lab, the price of the real stones crashed, but the best/rarest ones recovered soon after to greater heights. An argument follows that as AI-generated content proliferates, real-life experiences become more valuable, not less, hence the strength in live entertainment provider Live Nation. The owner of Ticketmaster’s revenue growth is re-accelerating, and it is investing heavily in its venue base in anticipation of strong growth.
Emerging Trends
These stocks are trading at the 30-week CAPR highs with a ByteTrend Score of less than 5. They don’t have to be in an uptrend, just emerging. All charts shown are CAPR rebased to 100.
| Name | Annual Vol 30w | Mkt Cap $Bn | Industry |
| UnitedHealth Group Incorporated | 41 | 371 | Healthcare & Life |
| Prologis, Inc. | 19 | 139 | Property & REITs |
| CVS Health Corporation | 34 | 130 | Healthcare & Life |
| The Bank of Nova Scotia | 17 | 103 | Banking & Lending |
| CSX Corporation | 21 | 88 | Transport & Logistics |
| Carrier Global Corporation | 35 | 58 | Construction |
| Anglo American plc | 35 | 57 | Construction |
| MetLife, Inc. | 25 | 57 | Insurance & Reinsurance |
| Fomento Económico Mexicano | 19 | 53 | Food & Beverage |
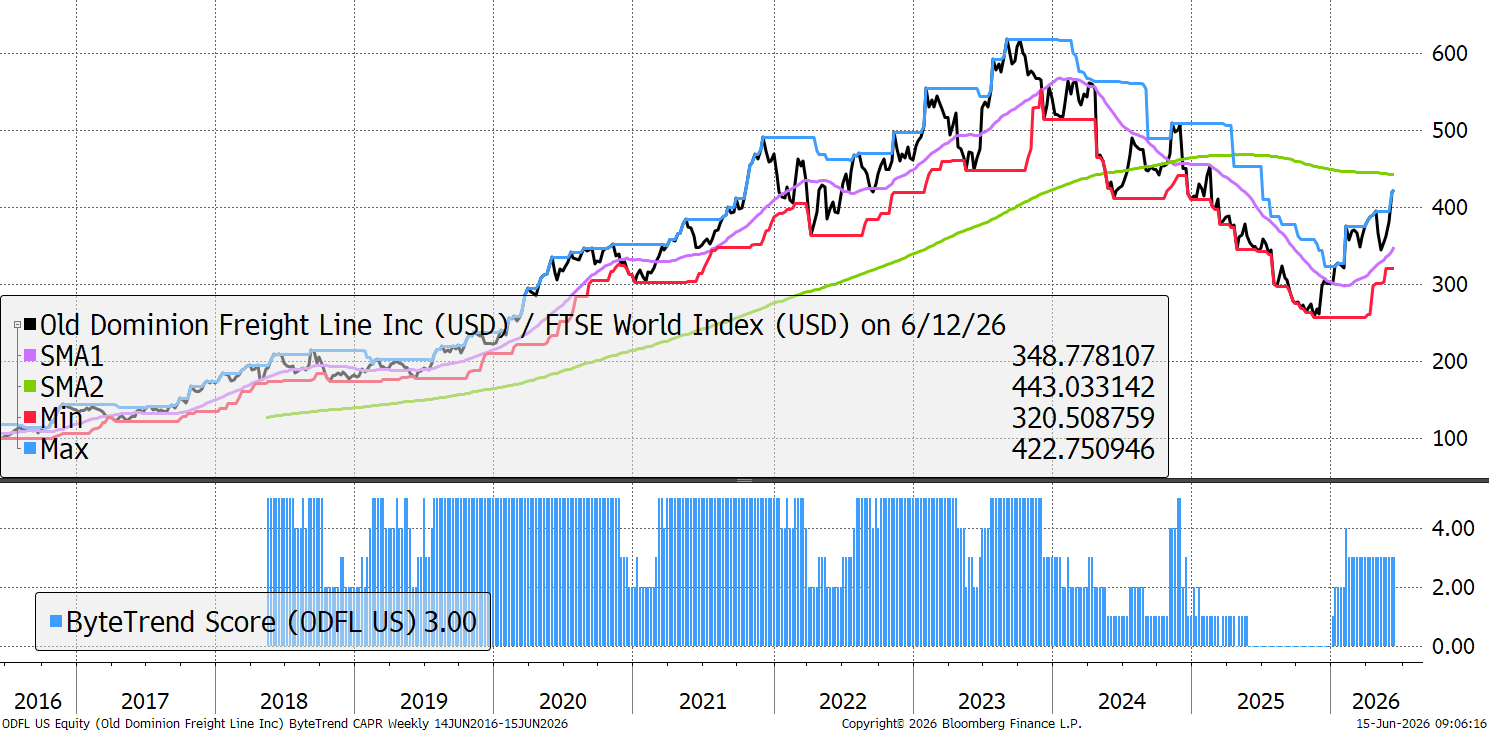
| Old Dominion Freight Line, Inc. | 39 | 51 | Transport & Logistics |
Old Dominion Freight
AI can’t transport grain across America. Buffett bought a railroad company (BNSF) in the early 2010s, and the sector has done well since then. A few are now breaking out, but from high valuations into record territory. The quality of earnings is high (high-margin and predictable), but there are valid questions about how much investors are now willing to pay for this.
Weakening
These stocks are trading at the 30-week CAPR lows with a ByteTrend Score above 0. They are weakening trends but not yet downtrends. All charts shown are CAPR rebased to 100.
| Name | Annual Vol 30w | Mkt Cap $Bn | Industry |
| Meta Platforms, Inc. | 41 | 1439 | Software & Services |
| Netflix, Inc. | 40 | 338 | Media & Entertainment |
| Roche Holding AG | 22 | 322 | Healthcare & Life |
| Palantir Technologies Inc. | 57 | 294 | Software & Services |
| SAP SE | 39 | 190 | Software & Services |
| Gilead Sciences, Inc. | 25 | 156 | Healthcare & Life |
| Intuitive Surgical, Inc. | 26 | 146 | Healthcare & Life |
| Uber Technologies, Inc. | 31 | 140 | Software & Services |
| Hitachi, Ltd. | 33 | 131 | Diversified Holdings |
| Zijin Mining Group Company Limited | 40 | 107 | Metals & Mining |
| Constellation Energy Corporation | 47 | 92 | Utilities & Clean Energy |
| Xiaomi Corporation | 32 | 86 | Technology Hardware |
| Westpac Banking Corporation | 21 | 84 | Banking & Lending |
| ITOCHU Corporation | 27 | 82 | Diversified Holdings |
| Agnico Eagle Mines Limited | 54 | 81 | Metals & Mining |
| Chugai Pharmaceutical Co., Ltd. | 30 | 77 | Healthcare & Life |
| Mitsubishi Heavy Industries, Ltd. | 38 | 74 | Construction & Engineering |
| ANZ Group Holdings Limited | 24 | 73 | Banking & Lending |
| DoorDash, Inc. | 50 | 66 | Software & Services |
| Singapore Telecommunications | 19 | 55 | Telecom & Network |


