


Hardware or Nowhere


Issue 66;
- Tech hardware widens its lead.
- Asia is weak when you strip out tech hardware.
- Toyota shows how tariffs are starting to bite.
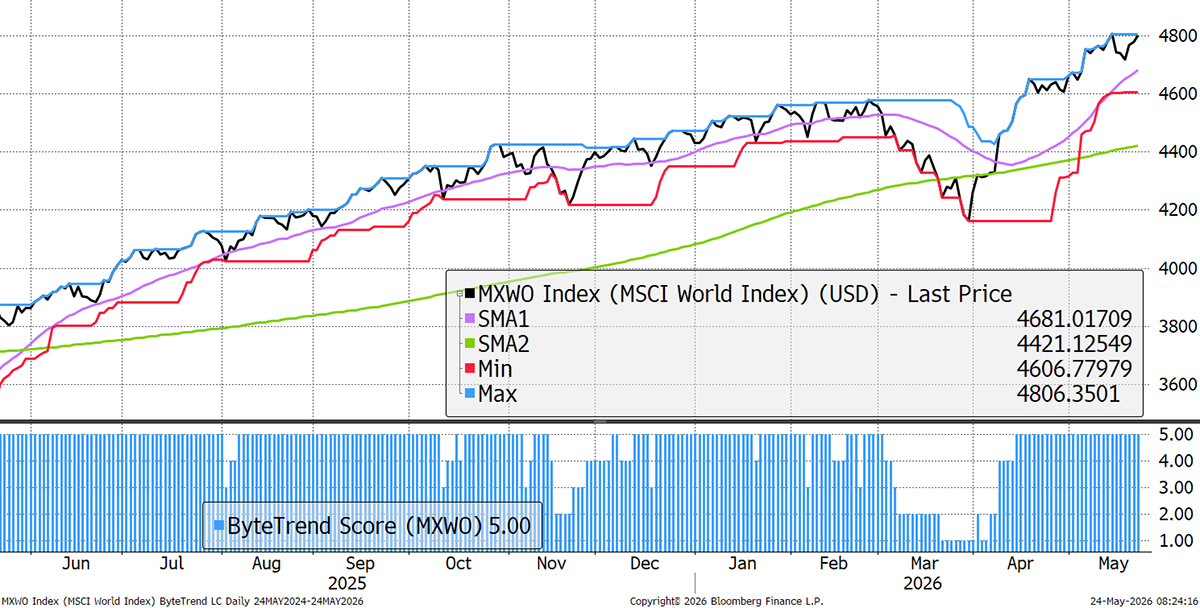
The World Index maintains a bullish ByteTrend Score of 5 in USD. It retested the all-time high despite bearish signals last week.
World Index – Developed Markets – Daily
Global Equity Breadth – CAPR
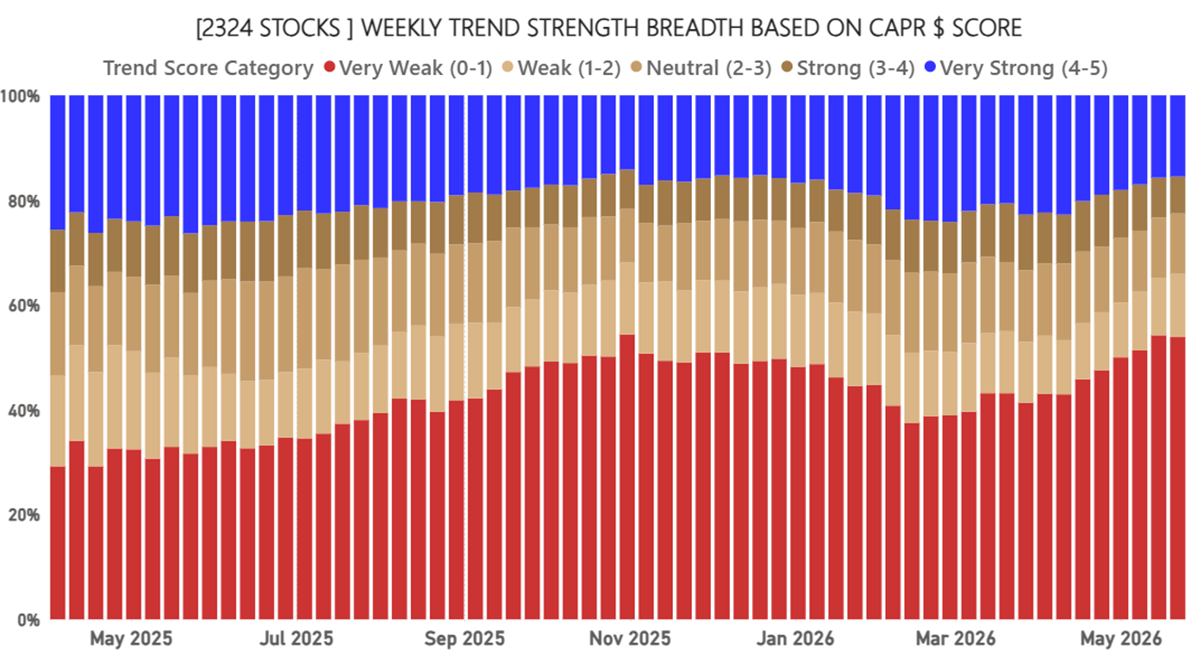
The number of stocks beating this market continues to decline. Outside of Technology Hardware, little is happening.
Industry Trend Score Categories in CAPR
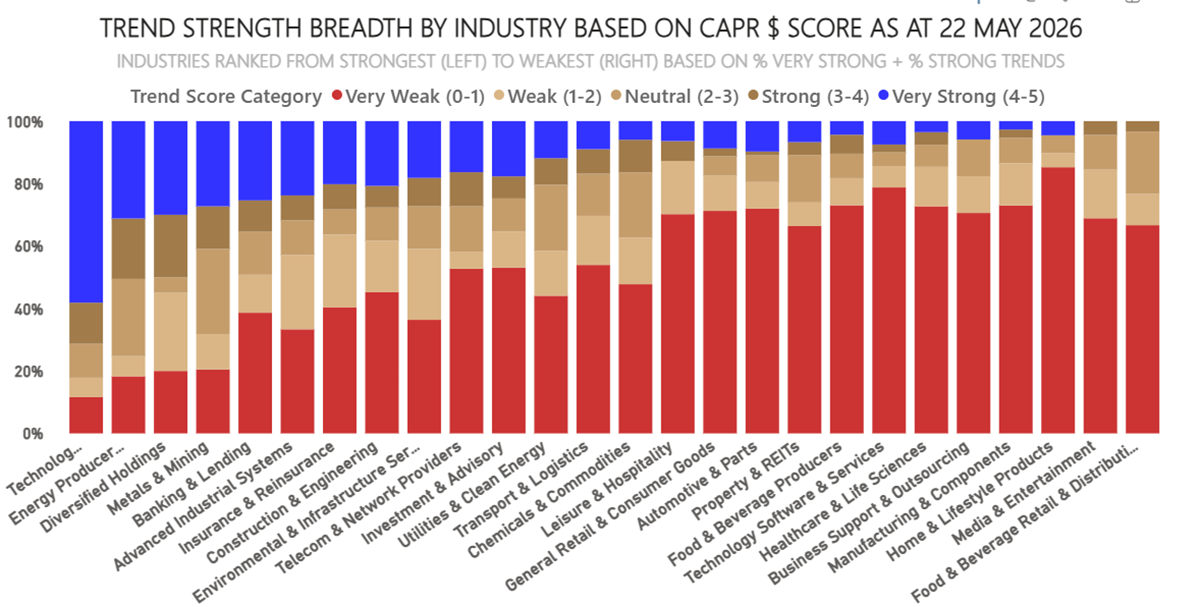
Tech hardware dominates, with over 50% of stocks beating the market. Energy comes second, alongside other commodity themes. The consumer-facing sectors remain weak.
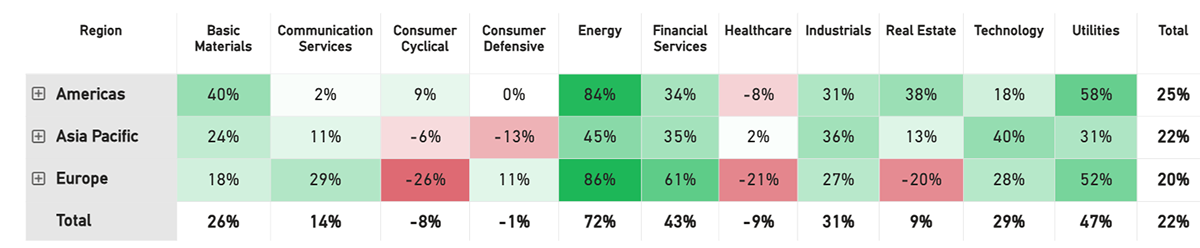
Net Winners - Stay Long Energy, Materials, Financials
The winners-less-losers metric guides asset allocators. Technology is mixed here because at the sector level, rather than the tech hardware industry level, software drags it down. Energy, Financials and Utilities remain strong.
Trend Type Performance
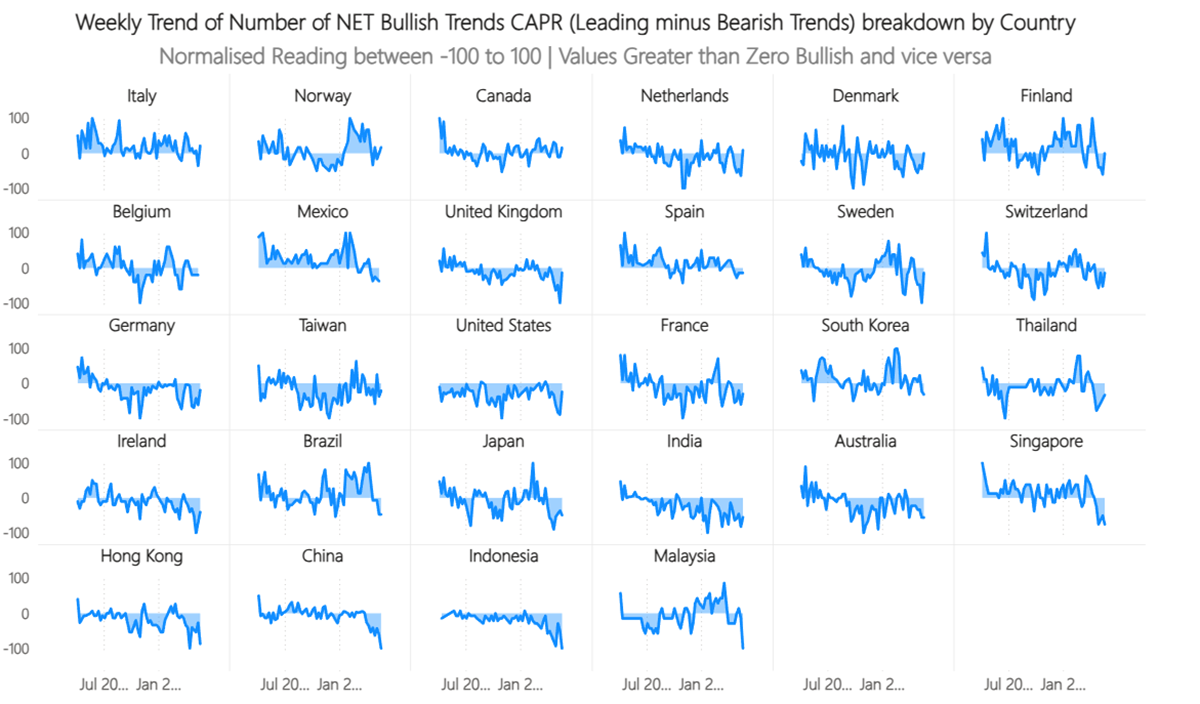
At the regional level, Europe is coming out quite well, in contrast to Asia, which is seeing weakness. Something is wrong in the East.
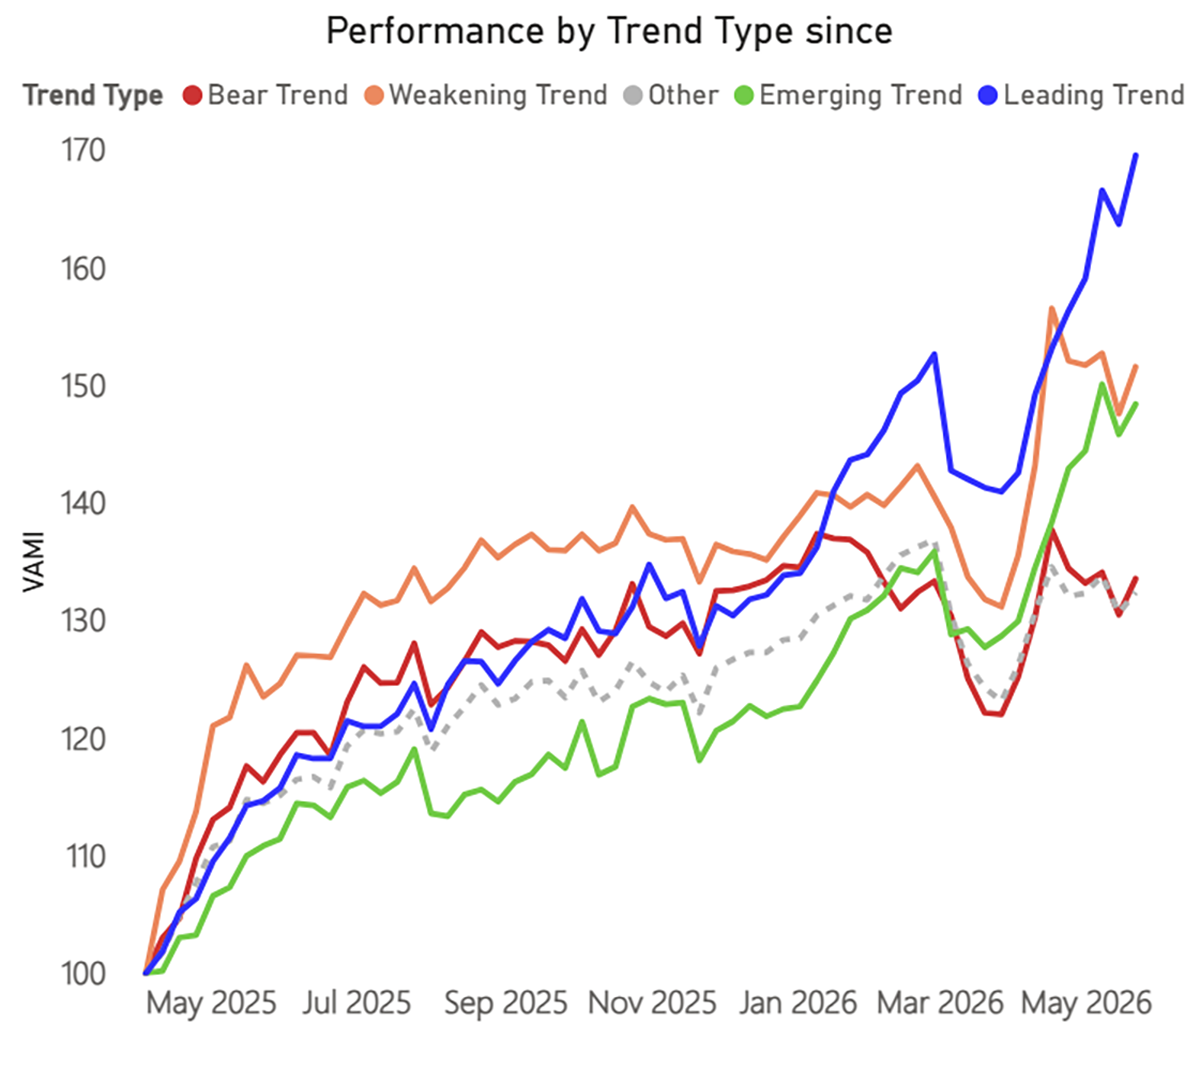
Trend Type Performance
The leading trends are firmly ahead. Emerging trends are also strong but lack breadth, as they have become a small group. Weakening trends can do well too, as they are oversold stocks. The bears are now being left behind, but crucially, they are not falling. When they do, that will signal an increased risk of a bear market.
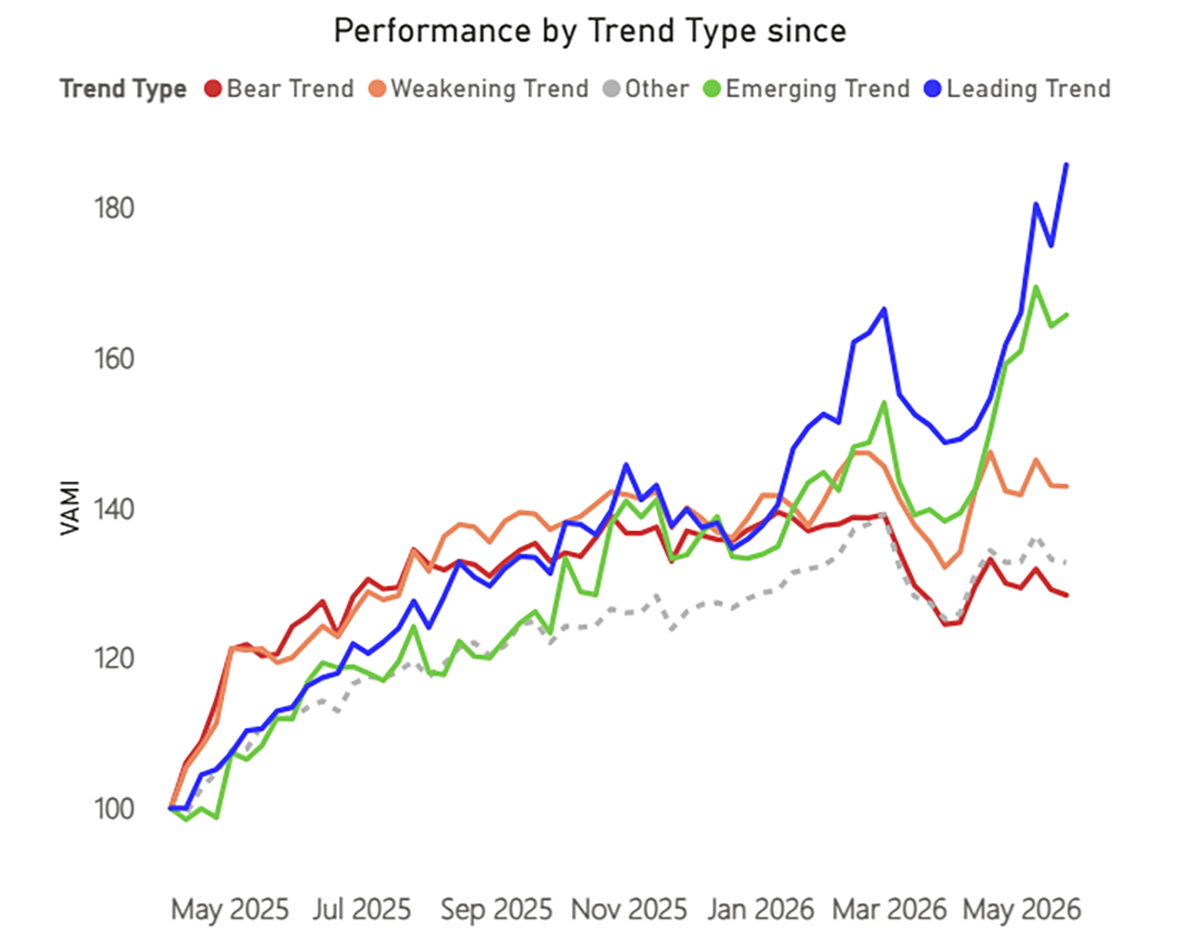
Trend Type Performance - Asia
In Asia, the leading trends are flying, while the bear stocks are looking uncomfortable. This level of divergence is extreme.
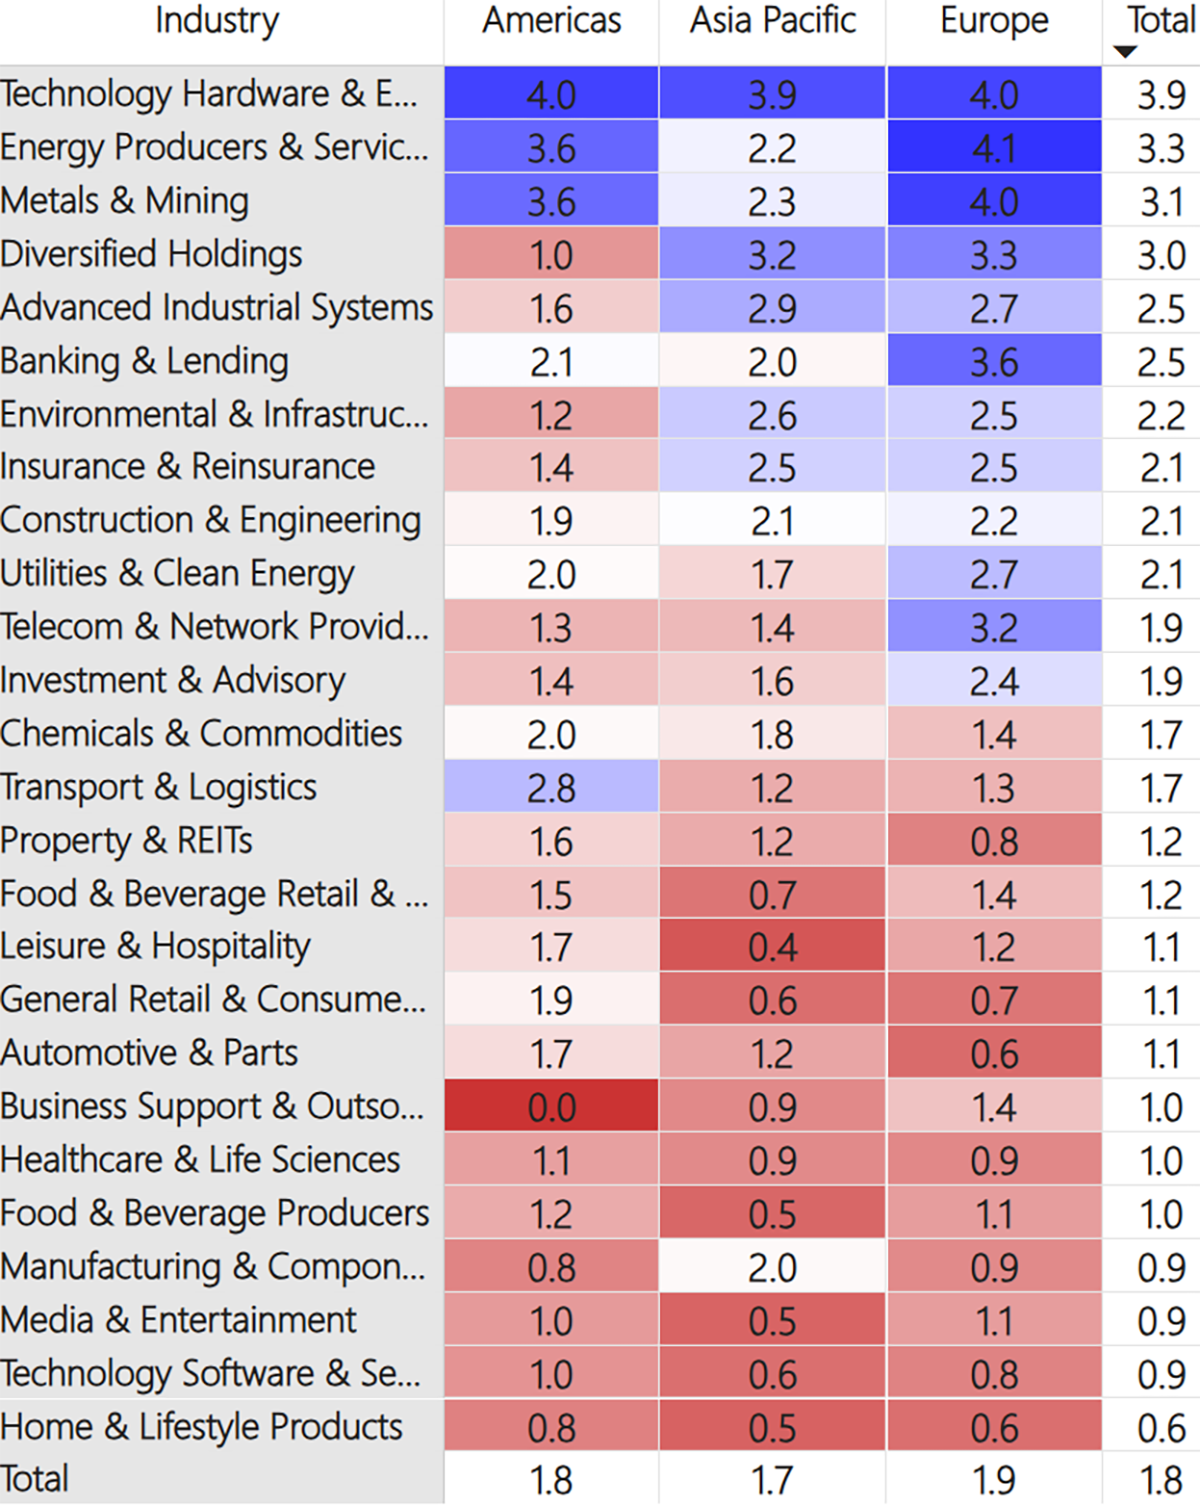
Regions and Industries Average Relative Score
This table (below) shows the average CAPR score for each global industry, by region and in total.
At the top of the table, Tech Hardware rose again, and it is now the strongest sector by a wide margin. Energy producers fell again and haven’t risen in relative terms since the end of March. Metals & Mining stocks began their relative decline in late February, and their fall has accelerated further, going from a 3.4 to a 3.1 in just the last week. Diversified Holdings and Banking stocks also weakened slightly against the index last week.
In the middle of the table, Environmental and Infrastructure stocks fell sharply, from 2.5 to 2.2. However, most other sectors remained stable, including Insurance, Investment, Transport, Property, Leisure, and Food & Beverage. Utilities rebounded slightly after a tough month.
At the bottom of the table, Auto stocks weakened further. They started the year with a score of 2.5 but now register only 1.1, making them the 8th-weakest industry. Business Support and Outsourcing stocks fell too, as did Media. Home and Lifestyle (Luxury) stocks are now firmly the weakest, scoring only 0.6, while Software stocks’ comeback continues. Since the panic in February, they have risen in relative terms for three months straight.
User Guide
Refer to our GTI: User Guide for an overview of the key concepts and terminology used in this report. These concepts may take a little bit of getting used to, but they are very powerful once you do.
Leading Trends with New Highs
These stocks are trading at the 30-week CAPR highs with a ByteTrend Score of 5. All charts shown are CAPR rebased to 100.
| Name | Annual Vol 30w | Mkt Cap $Bn | Industry |
| Apple Inc. | 22 | 4536 | Technology Hardware |
| Samsung Electronics Co., Ltd. | 54 | 1283 | Technology Hardware |
| SK hynix Inc. | 66 | 904 | Technology Hardware |
| Micron Technology, Inc. | 72 | 847 | Technology Hardware |
| Advanced Micro Devices, Inc. | 72 | 762 | Technology Hardware |
| ASML Holding N.V. | 35 | 630 | Technology Hardware |
| Cisco Systems, Inc. | 38 | 475 | Technology Hardware |
| Lam Research Corporation | 53 | 382 | Technology Hardware |
| Texas Instruments Incorporated | 41 | 281 | Technology Hardware |
| Royal Bank of Canada | 14 | 265 | Banking & Lending |
| Dell Technologies Inc. | 63 | 199 | Technology Hardware |
| MediaTek Inc. | 82 | 196 | Technology Hardware |
| ABB Ltd | 28 | 194 | Advanced Industrial |
| The Toronto-Dominion Bank | 15 | 187 | Banking & Lending |
| Seagate Technology Holdings plc | 61 | 182 | Technology Hardware |
| Palo Alto Networks, Inc. | 52 | 178 | Technology Software |
| Marvell Technology, Inc. | 58 | 172 | Technology Hardware |
| CrowdStrike Holdings, Inc. | 54 | 169 | Technology Software |
| Corning Incorporated | 58 | 167 | Technology Hardware |
| Bank of Montreal | 17 | 114 | Banking & Lending |
| Infineon Technologies AG | 48 | 111 | Technology Hardware |
| Canadian Imperial Bank of Commerce | 18 | 107 | Banking & Lending |
| Fortinet, Inc. | 54 | 98 | Technology Software |
| The Bank of New York Mellon | 20 | 96 | Investment & Advisory |
| Nokia Oyj | 43 | 86 | Technology Hardware |
| Ciena Corporation | 51 | 83 | Technology Hardware |
| Murata Manufacturing Co., Ltd. | 47 | 82 | Technology Hardware |
| NXP Semiconductors N.V. | 50 | 80 | Technology Hardware |
| Datadog, Inc. | 83 | 79 | Technology Software |
| ASE Technology Holding Co., Ltd. | 56 | 78 | Technology Hardware |
| Assicurazioni Generali S.p.A. | 23 | 68 | Insurance & Reinsurance |
| BOC Hong Kong (Holdings) Limited | 20 | 65 | Banking & Lending |
| Samsung Electro-Mechanics Co., Ltd. | 76 | 64 | Technology Hardware |
| STMicroelectronics N.V. | 47 | 60 | Technology Hardware |
| Sumitomo Electric Industries, Ltd. | 55 | 58 | Automotive & Parts |
| Nucor Corporation | 31 | 53 | Metals & Mining |
| Great-West Lifeco Inc. | 18 | 52 | Insurance & Reinsurance |
| Panasonic Holdings Corporation | 49 | 51 | Technology Hardware |
| ASM International N.V. | 40 | 51 | Technology Hardware |
| Hewlett Packard Enterprise Company | 40 | 50 | Technology Hardware |
Apple Inc
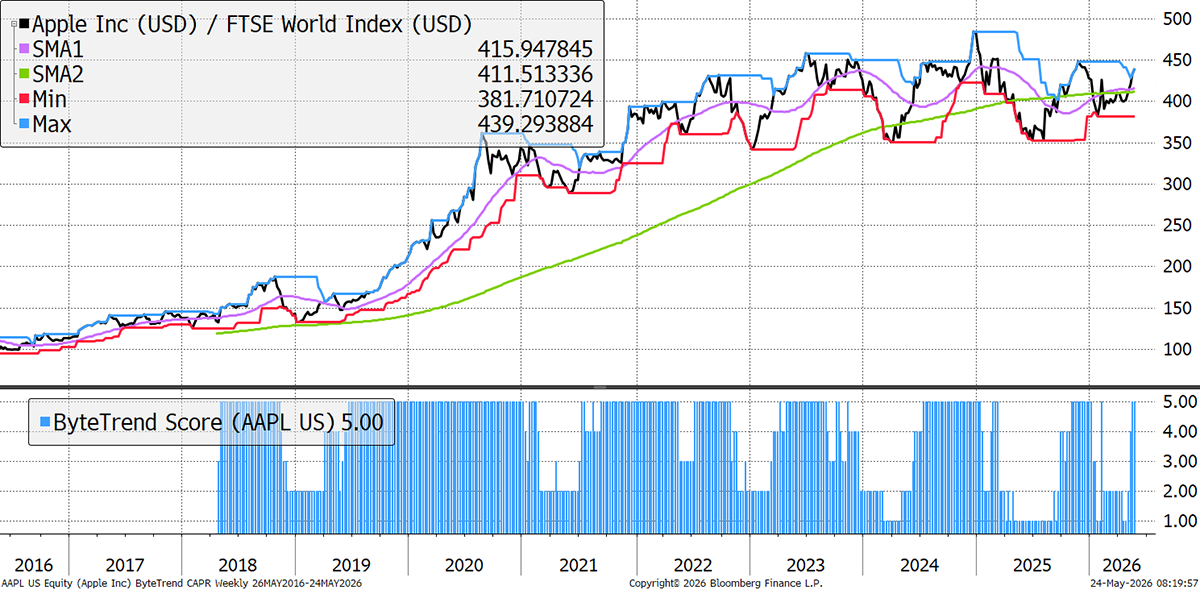
Apple has hit a new all-time high, with its ByteTrend score a firm 5 in both local and CAPR terms. The big catalyst is AI. In Q2 2026, revenue rose by 17% year-on-year, with iPhone sales up 22%, and investors are looking to their annual Worldwide Developer Conference (WWDC) for announcements on a next-generation Siri and AI-first hardware. The new CEO comes from the hardware side.
CrowdStrike
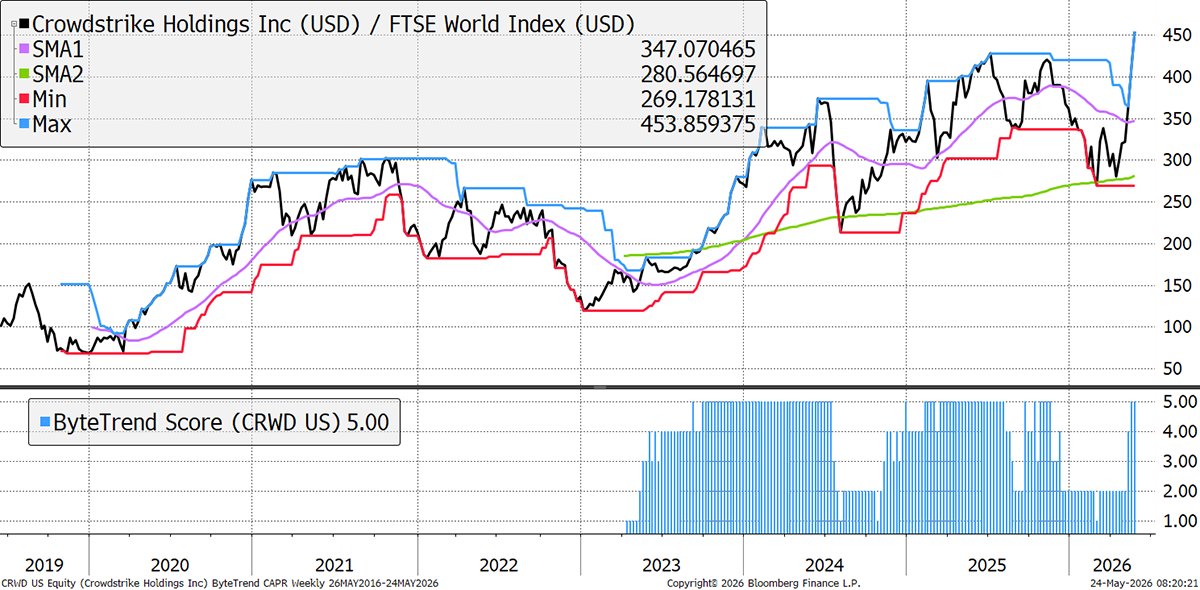
CrowdStrike has surged to new all-time highs, despite falling with the software crash. It is up over 40% YTD, as its role at the intersection of enterprise security and AI becomes ever clearer. The Falcon platform’s evolution into a one-stop solution is winning over enterprise IT buyers. Its Mythos AI security product is receiving strong reviews ahead of Q1 FY27 earnings on 3 June. With $5.25 billion in ARR and 23% revenue growth, the business is in good shape.
New Leading Trends
These stocks are trading at the 30-week CAPR highs with a ByteTrend Score of 5, except they are new trends this week, having previously had a score below 5. All charts shown are CAPR rebased to 100.
| Name | Annual Vol 30w | Mkt Cap $Bn | Industry |
| Morgan Stanley | 25 | 317 | Investment & Advisory |
| NetApp, Inc. | 34 | 28 | Technology Hardware |
| Inventec Corporation | 41 | 7 | Technology Hardware |
| AJ Bell plc | 43 | 3 | Investment & Advisory |
| Bodycote plc | 42 | 2 | Construction & Eng |
Morgan Stanley
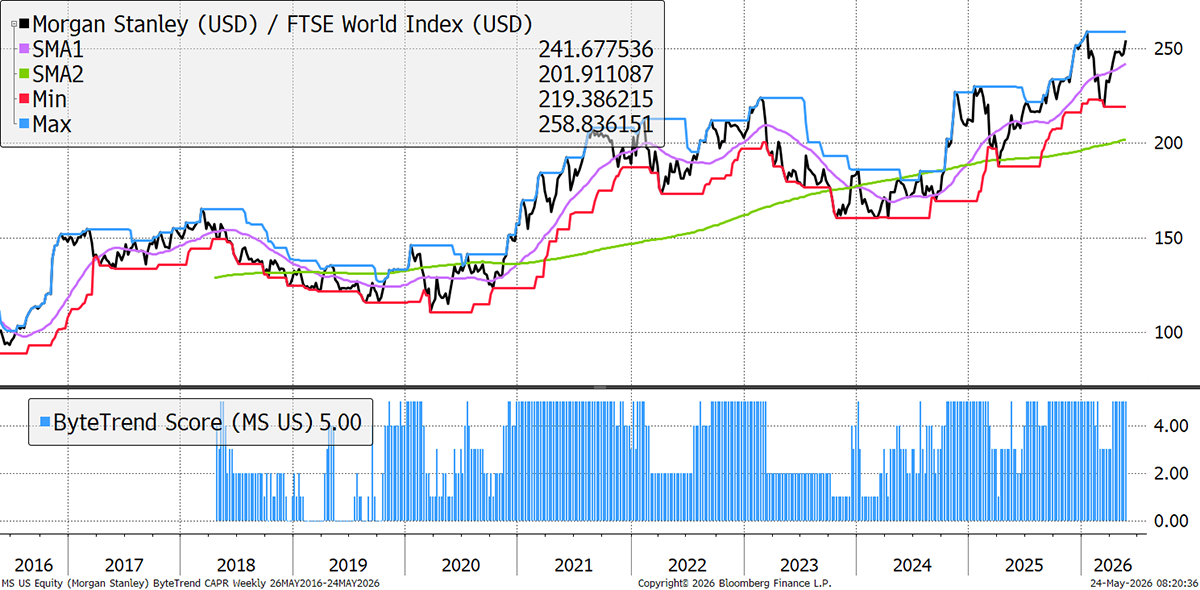
Morgan Stanley, up over 60% in the past 12 months, is being re-rated on the back of a maturing wealth management franchise and renewed strength in investment banking and trading as capital markets activity revives. The firm recently raised its year-end S&P 500 target to 8,000, reflecting its own constructive view on markets. At around 15x forward earnings, it commands a premium to the broader banking sector.
Emerging Trends
These stocks are trading at the 30-week CAPR highs with a ByteTrend Score of less than 5. They don’t have to be in an uptrend, just emerging. All charts shown are CAPR rebased to 100.
| Name | Annual Vol 30w | Mkt Cap $Bn | Industry |
| QUALCOMM Incorporated | 57 | 251 | Technology Hardware |
| Cadence Design Systems, Inc. | 38 | 103 | Technology Software |
| Ford Motor Company | 36 | 58 | Automotive & Parts |
| GLOBALFOUNDRIES Inc. | 51 | 48 | Technology Hardware |
| Humana Inc. | 57 | 37 | Healthcare & Life |
| Centene Corporation | 60 | 29 | Healthcare & Life |
| VeriSign, Inc. | 24 | 28 | Technology Software |
| Kyocera Corporation | 26 | 25 | Technology Hardware |
| Royalty Pharma plc | 17 | 23 | Healthcare & Life |
Qualcomm
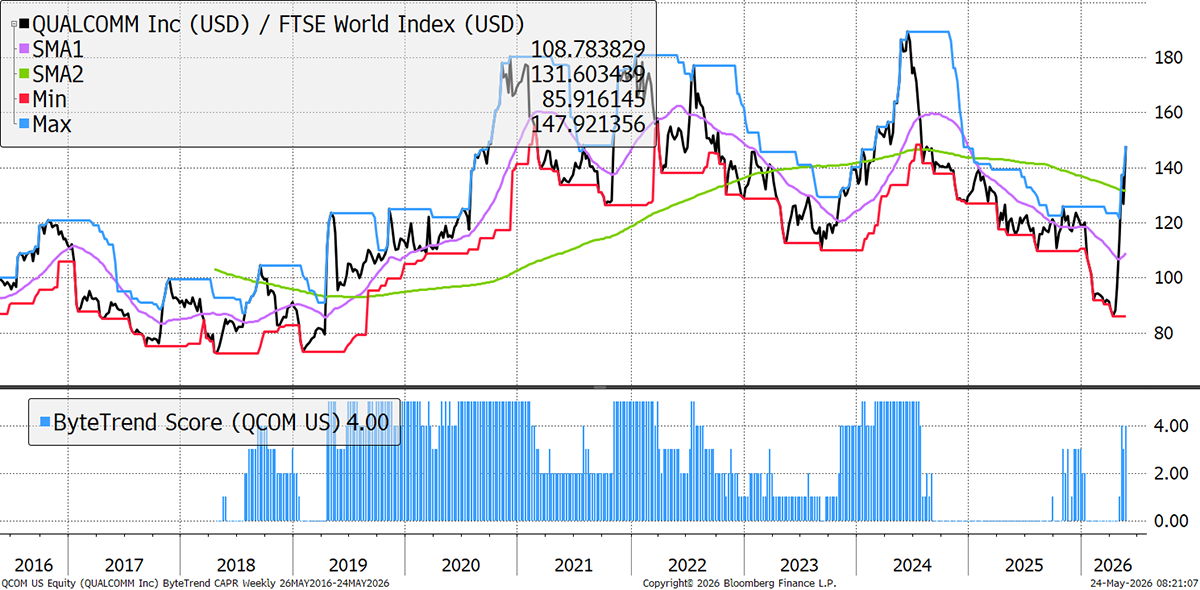
Qualcomm is one of the most dramatic stories in markets right now, having surged nearly 80% in a single month as investors who wrote it off as a cyclical smartphone chipmaker are being forced to reconsider. The company has made rapid inroads into automotive AI, generating record revenues of $1.3 billion, including a new deal to supply Stellantis. Qualcomm is working on edge AI devices and now data centres, with a reported partnership with OpenAI to develop AI agent chips. The extraordinary pace of the move warrants some caution (in price terms, it doubled in a month).
Weakening
These stocks are trading at the 30-week CAPR lows with a ByteTrend Score above 0. They are weakening trends but not yet downtrends. All charts shown are CAPR rebased to 100.
| Name | Annual Vol 30w | Mkt Cap $Bn | Industry |
| American Express Company | 24 | 213 | Banking & Lending |
| Airbus SE | 26 | 155 | Advanced Industrial |
| Uber Technologies, Inc. | 31 | 146 | Technology Software |
| Bharti Airtel Limited | 19 | 119 | Telecom & Network |
| Capital One Financial Corporation | 29 | 117 | Banking & Lending |
| Westpac Banking Corporation | 21 | 89 | Banking & Lending |
| Agnico Eagle Mines Limited | 52 | 88 | Metals & Mining |
| HCA Healthcare, Inc. | 28 | 87 | Healthcare & Life |
| ITOCHU Corporation | 28 | 86 | Diversified Holdings |
| Mitsubishi Heavy Industries, Ltd. | 38 | 84 | Construction & Eng |
| Vinci S.A. | 25 | 79 | Construction & Eng |
| DoorDash, Inc. | 56 | 70 | Technology Software |
| Münchener Re | 21 | 70 | Insurance & Reinsurance |
| Royal Caribbean Cruises Ltd. | 45 | 69 | Leisure & Hospitality |
| CRH plc | 35 | 67 | Construction & Eng |
| Robinhood Markets, Inc. | 67 | 66 | Investment & Advisory |
| Regeneron Pharmaceuticals, Inc. | 34 | 66 | Healthcare & Life |
| Discover Financial Services | 0 | 50 | Banking & Lending |
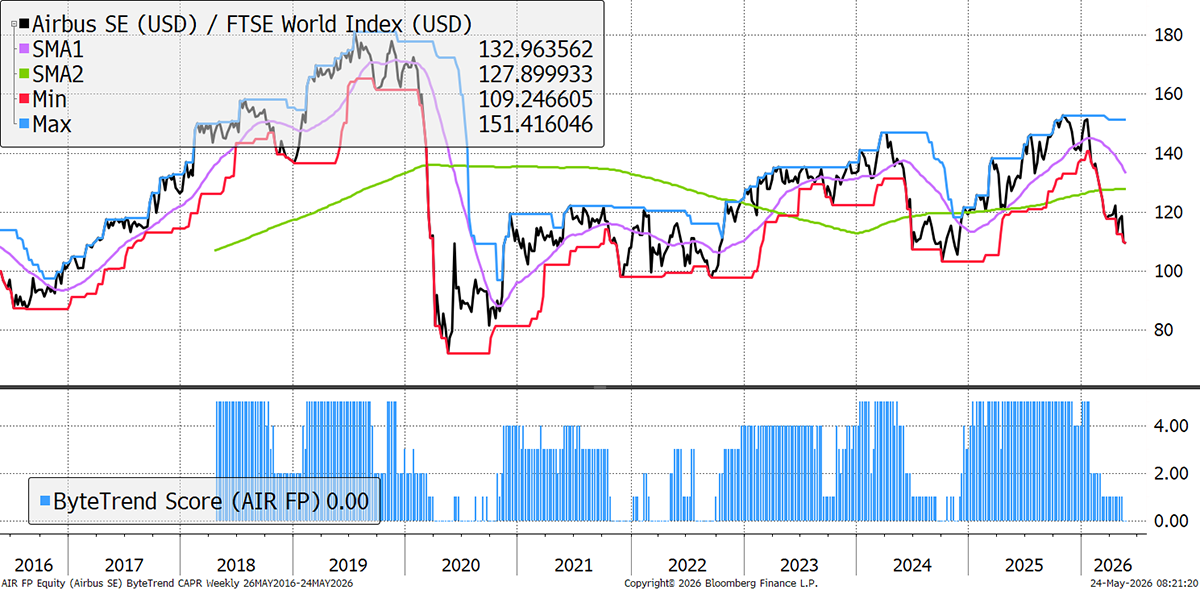
Airbus
Airbus, once one of Europe’s great momentum stories, is struggling. The CAPR trend score has fallen to 1, well off the highs, as the company battles delivery bottlenecks stemming from Pratt & Whitney engine delays and ongoing panel inspection issues. In Q1 2026, revenue fell by 7% YoY to €12.7bn despite a strong order book (408 gross aircraft orders versus 280 a year ago). Down around 17% year-to-date, it is one of the weaker large European industrials. Order momentum remains encouraging, and the long-term demand picture is intact. But, until deliveries catch up, the earnings machine is stuck in first gear.
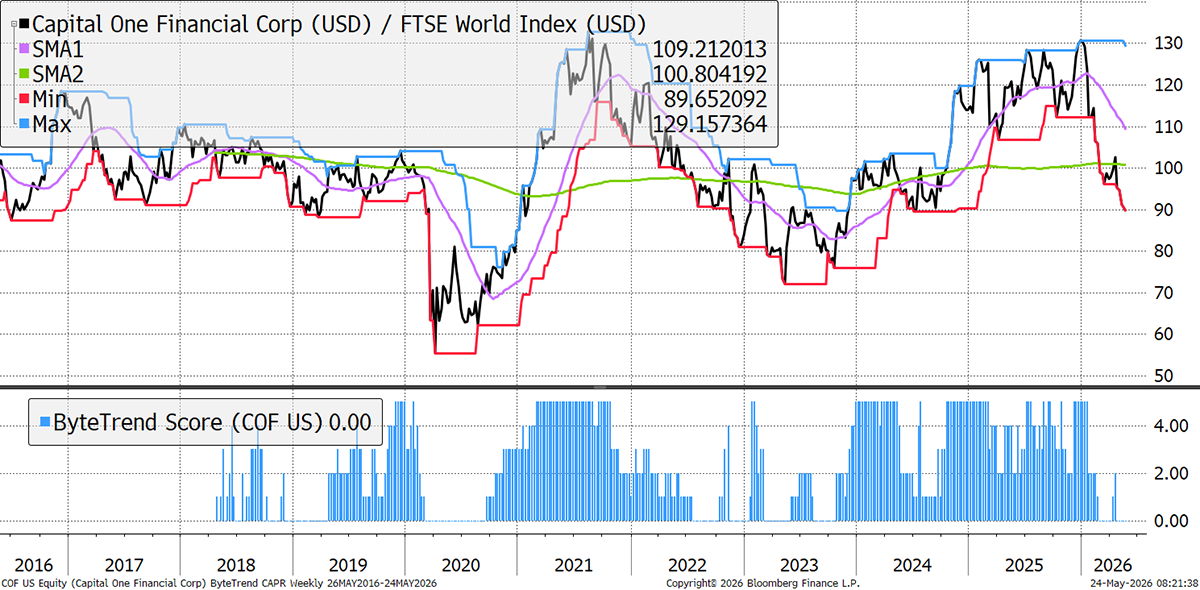
Capital One
Capital One is now in a clear relative downtrend, having fallen around 27% from its 30-week CAPR highs and roughly 23% YTD. The completion of the $35.3 billion Discover acquisition created a vertically integrated payments giant with an estimated $2.7 billion in annual synergies, but the near-term reality is challenging. Integration costs are weighing on margins, and credit card charge-off rates are rising.
Bear Trends
These stocks are trading at the 30-week CAPR lows with a ByteTrend Score of 0. They are in a downtrend. All charts shown are CAPR rebased to 100.
| Name | Annual Vol 30w | Mkt Cap $Bn | Industry |
| Tencent Holdings Limited | 23 | 509 | Technology Software |
| Mastercard Incorporated | 20 | 441 | Banking & Lending |
| Alibaba Group Holding Limited | 38 | 311 | General Retail |
| Toyota Motor Corporation | 31 | 245 | Automotive & Parts |
| L'Oréal S.A. | 22 | 224 | Home & Lifestyle Products |
| Hermès | 27 | 195 | Home & Lifestyle Products |
| Reliance Industries Limited | 22 | 192 | Energy Producers |
| The Walt Disney Company | 24 | 179 | Media & Entertainment |
| China Merchants Bank Co., Ltd. | 19 | 149 | Banking & Lending |
| Ping An Insurance | 27 | 141 | Insurance & Reinsurance |
| PDD Holdings Inc. | 33 | 135 | General Retail |
| HDFC Bank Limited | 19 | 123 | Banking & Lending |
| Lowe's Companies, Inc. | 27 | 120 | Home & Lifestyle Products |
| Vertex Pharmaceuticals Incorporated | 24 | 110 | Healthcare & Life |
| Al Rajhi Banking and Investment | 16 | 106 | Banking & Lending |
| BYD Company Limited | 31 | 106 | Automotive & Parts |
| Prosus N.V. | 35 | 99 | Technology Software |
| China Petroleum & Chemical | 22 | 94 | Energy Producers |
| EssilorLuxottica S.A. | 30 | 93 | Healthcare & Life |
| State Bank of India | 27 | 92 | Banking & Lending |
| Marsh & McLennan Companies, Inc. | 14 | 90 | Insurance & Reinsurance |
| Intuit Inc. | 59 | 88 | Technology Software |
| Intercontinental Exchange, Inc. | 26 | 87 | Investment & Advisory |
| NTT, Inc. | 11 | 78 | Telecom & Network |
| Postal Savings Bank of China Co., Ltd. | 16 | 77 | Banking & Lending |
| Hong Kong Exchanges and Clearing | 15 | 66 | Investment & Advisory |
| Deutsche Post AG | 0 | 65 | Transport & Logistics |
| Saudi Arabian Mining Company | 31 | 64 | Construction & Eng |
| Meituan | 32 | 64 | General Retail |
| Deutsche Post AG | 0 | 62 | Transport & Logistics |
| LG Energy Solution, Ltd. | 46 | 61 | Construction & Eng |
| Nongfu Spring Co., Ltd. | 26 | 61 | Food & Beverage s |
| Bajaj Finance Limited | 28 | 60 | Banking & Lending |
| TE Connectivity Ltd. | 37 | 59 | Technology Hardware |
| Mercedes-Benz Group AG | 24 | 56 | Automotive & Parts |
| Wal-Mart de México, S.A.B. de C.V. | 19 | 55 | Food & Beverage |
| Hindustan Unilever Limited | 19 | 54 | Home & Lifestyle Products |
| Sea Limited | 40 | 53 | General Retail |
| Volkswagen AG | 26 | 53 | Automotive & Parts |
| Bayerische Motoren Werke AG | 31 | 52 | Automotive & Parts |
| Nintendo Co., Ltd. | 43 | 52 | Media & Entertainment |
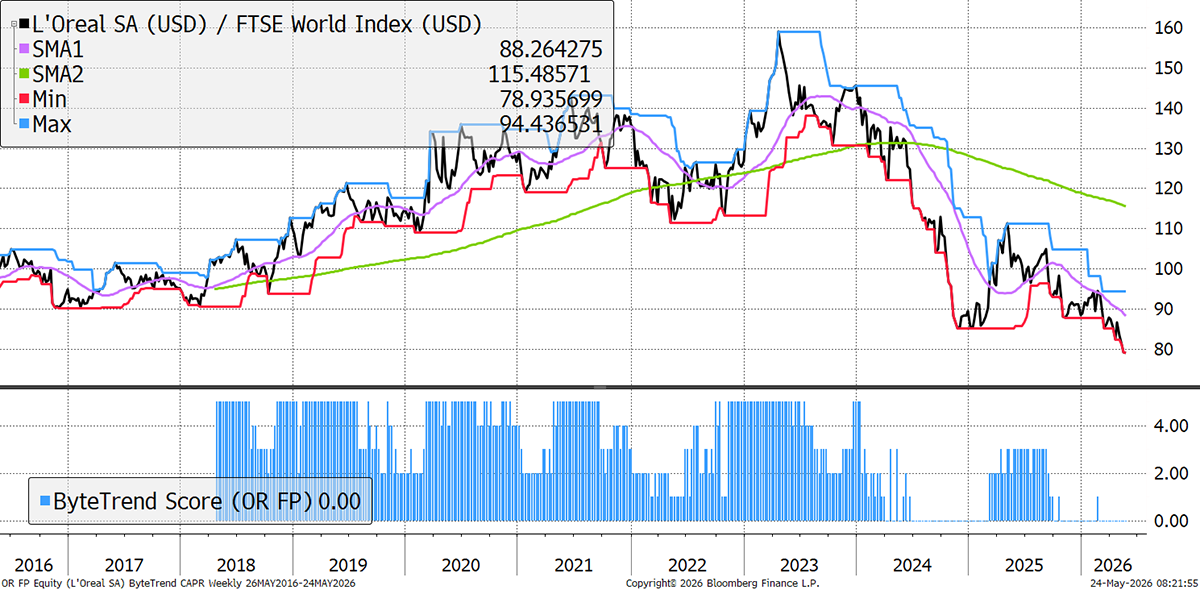
L’Oréal
L’Oréal delivered an impressive Q1 2026 earnings beat, with like-for-like sales growth of 7.6% against a beauty market growing at just 3.8%. The stock surged 9% on the day, its best single-day gain in 18 years. However, the CAPR trend remains at 0, staying in its downtrend relative to the World Index, which has been in place since 2023. The challenge is that while L’Oréal continues to gain market share, it has been caught in the same de-rating as other European consumer staples names, after its valuation multiples reached record highs between late 2021 and early 2023. Its recent acquisition of Kering Beauté for €4 billion adds a growth lever, but for now, the trend signal remains bearish.
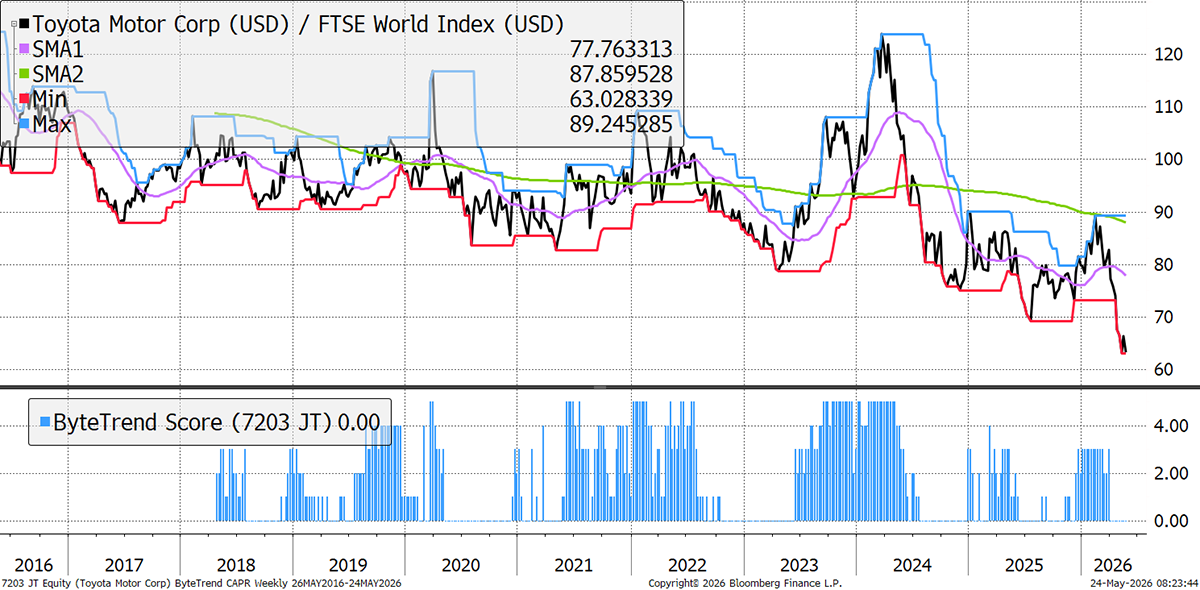
Toyota
Toyota’s FY2026 results told a sobering story. Record revenues of ¥50.7 trillion, but a 21.5% decline in 2027 forecast operating income, with US tariffs alone stripping ¥1.4 trillion from the bottom line and the Middle East having a large impact too. Net income fell by 19%, and guidance for the year ahead was cut. The CAPR trend score has been at 0 for 21 weeks, and the yen’s volatility adds a further layer of uncertainty for international investors. Toyota is accelerating its hybrid and EV pivot and expanding into robotics, but for now, momentum is elsewhere.
GTI 200 Spreadsheet
We are pleased to share the GTI 200 spreadsheet. Download the spreadsheet below to view the CAPR and local currency scores, and more, for the world’s largest 200 stocks. Have a look at the different groups and the main list “All stocks”. The Insights tab is interesting, and don’t forget to expand the columns by clicking on the “+” at the top of the page if you want to see more trend data.
Outlook
In a week with five new leading trends, there were 35 new bear trends. Much could go wrong from here.
Thanks for reading GTI.


