


Risk Unwind


Issue 89;
- AI and materials suffer in the unwind.
- The market holds as a major market rotation continues.
- A great market for contrarians.
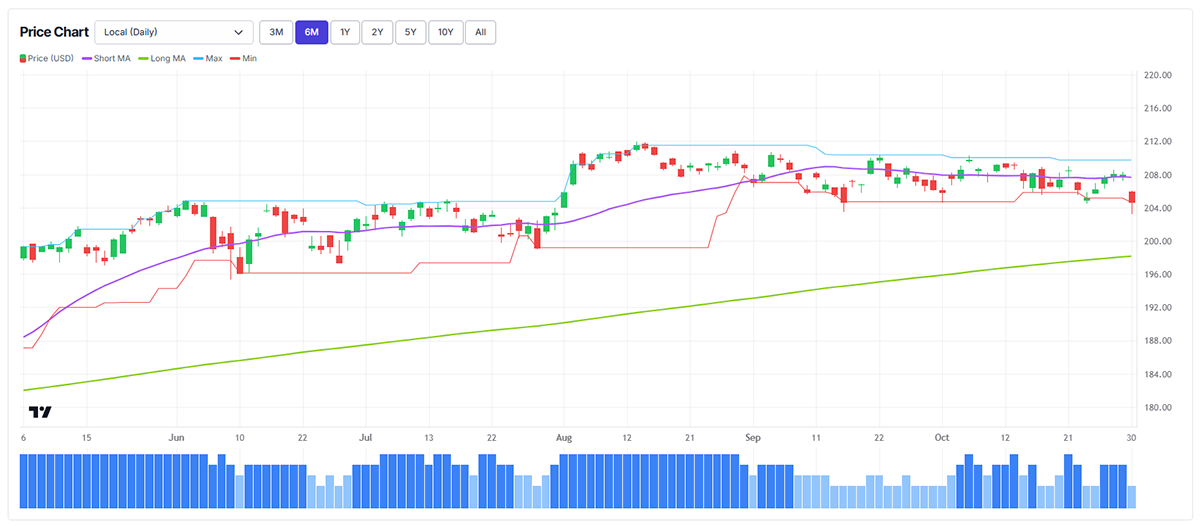
The World Index has a ByteTrend Score of 2 in USD. All short-term signals are bearish; the long-term remains bullish. The last touch on the max/min lines was a min on Friday.
iShares MSCI World ETF (URTH) - Developed Markets – Daily, Six Months
Breadth
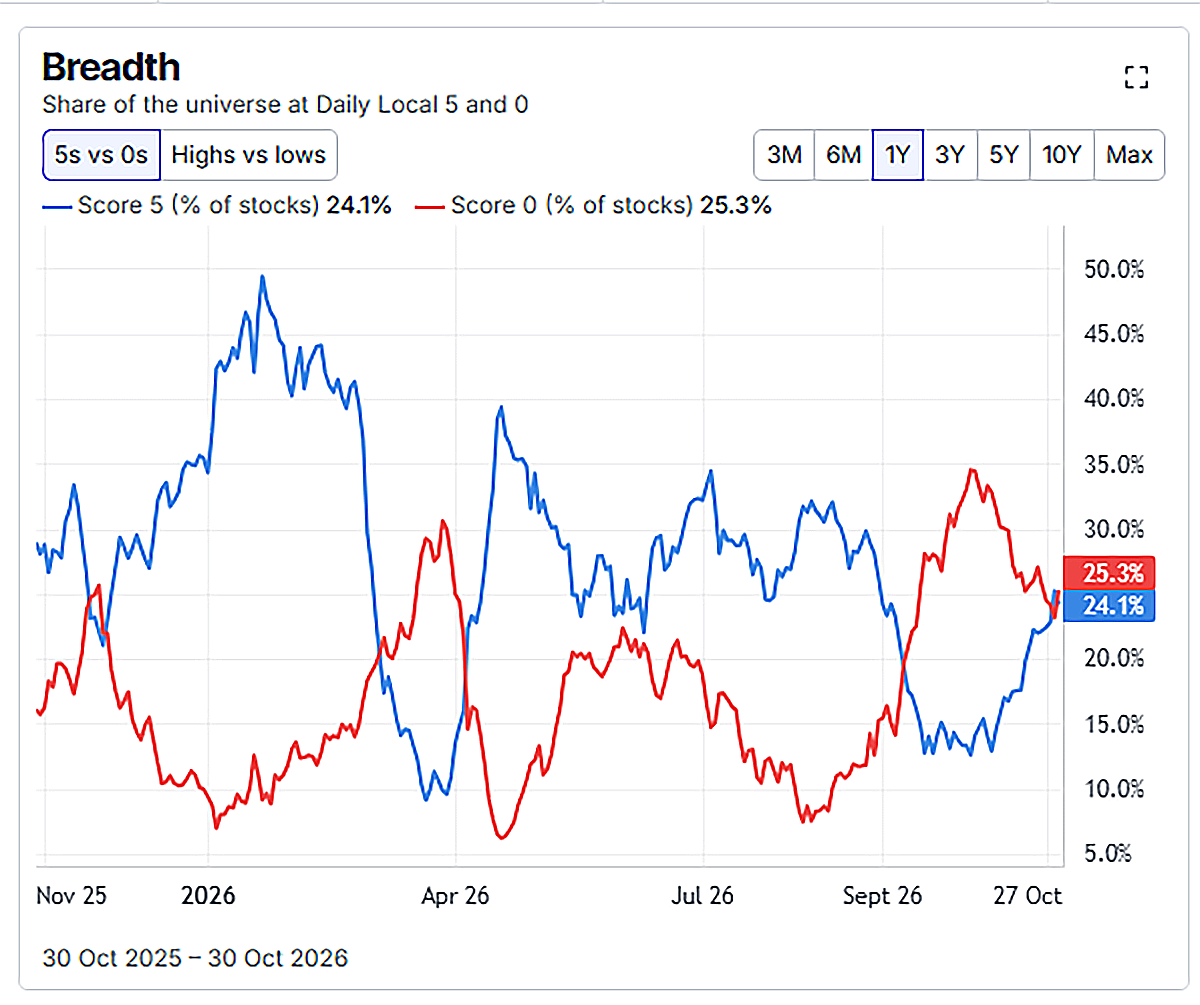
The rotation continues. The good news for the market is that while the tech sector is crashing, more stocks are recovering. The market is most at risk when breadth is deteriorating, but it is recovering.
World Market Beta Breadth (in price) – Daily, Past Year
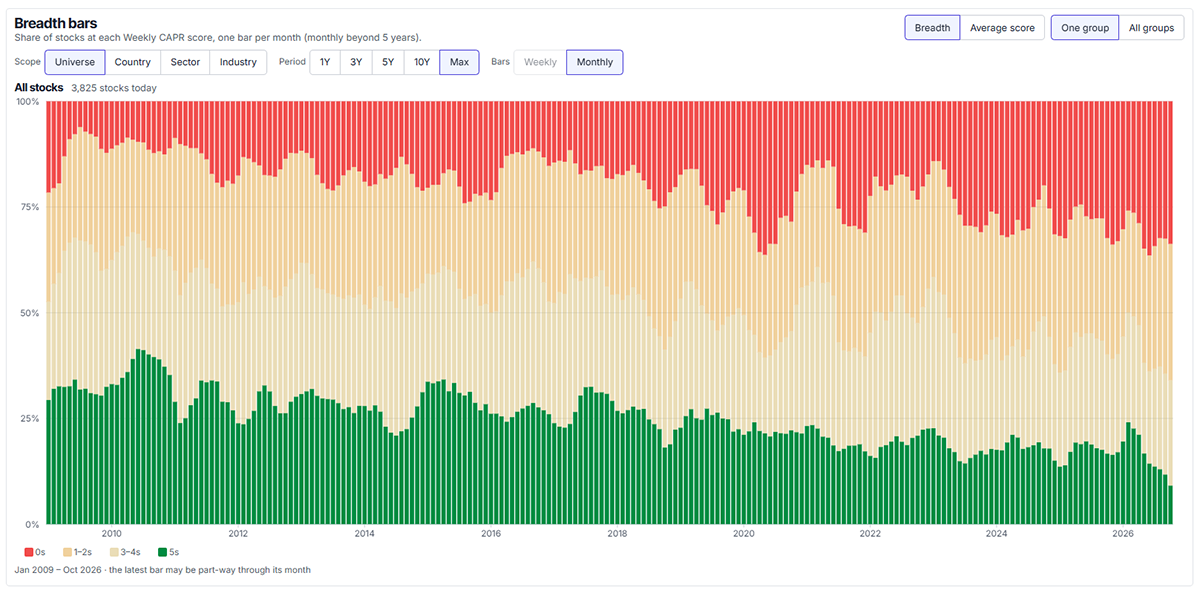
World Market Alpha Breadth (in CAPR) - Weekly Since 2006
Alpha breadth, i.e. the share of stocks beating the market, remains in a slump. I suspect this will recover if the price rotation continues, as it takes time for weekly trends to be established.
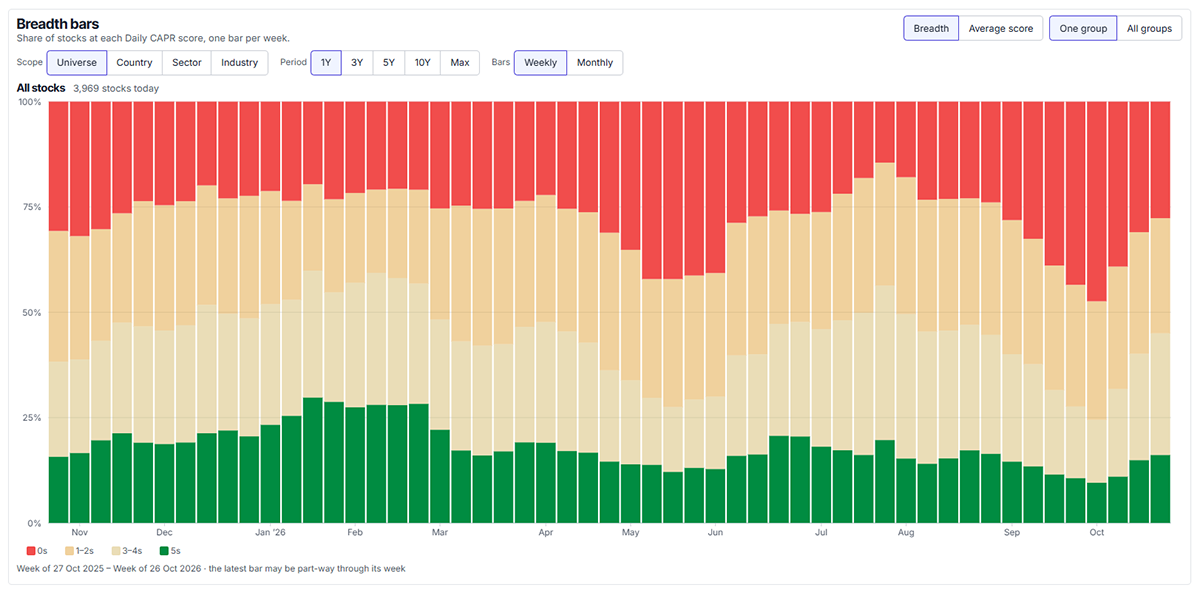
World Market Alpha Breadth (in CAPR) – Daily, Past Year
This shows up on the daily chart. Over the past month, bear trends have retreated, and bull trends have started to rise.
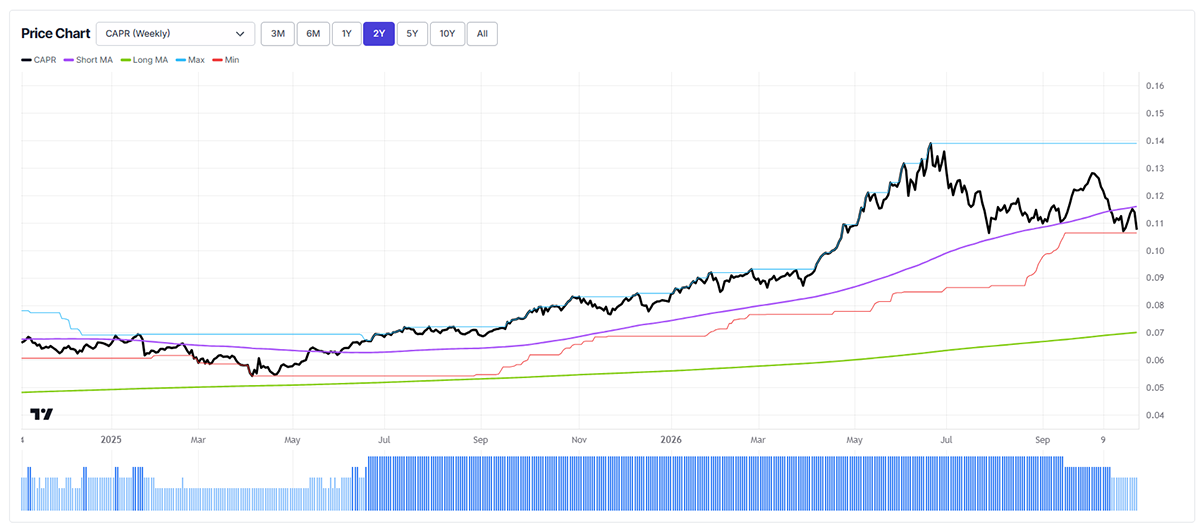
Semiconductor ETF (SMH in CAPR) – Weekly, Past Two Years
The big move last week came from AI. Semiconductor stocks are lagging the market, having failed to make a CAPR high during the summer rebound. The ByteTrend CAPR Score is now 3. The min-line has been breached, but the 30-week moving average is still rising. The omen is not good.
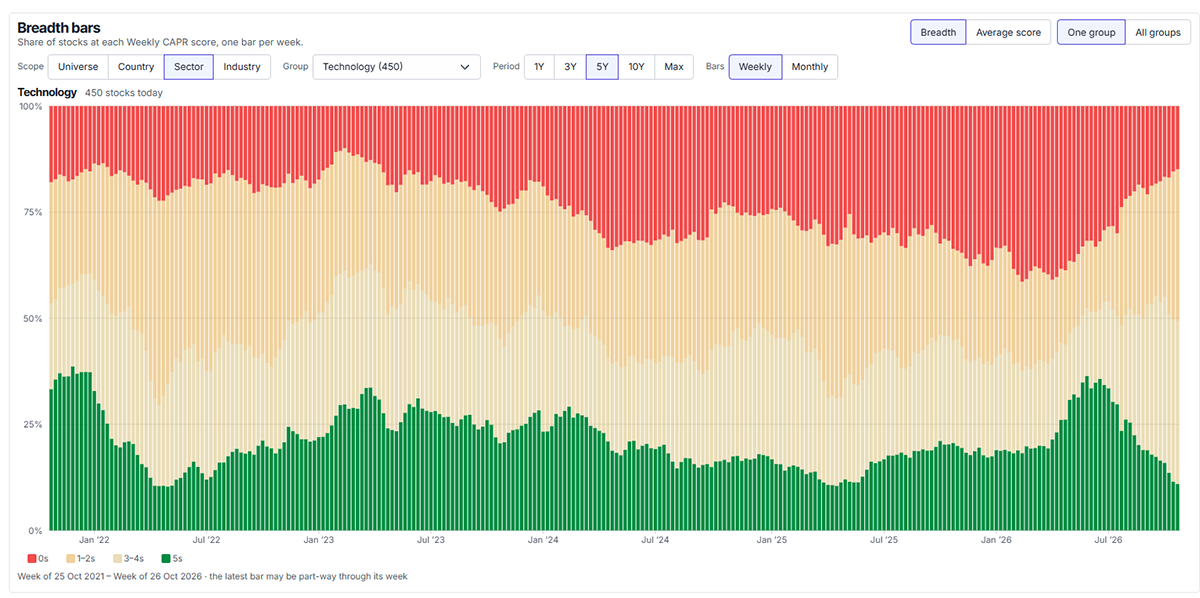
Technology Alpha Breadth (in CAPR) – Weekly, Five Years
Technology is seeing the greatest rotation. The bear stocks in software show declining downtrends while the uptrends in AI and hardware are also in decline. Tech is now a firmly neutral sector.
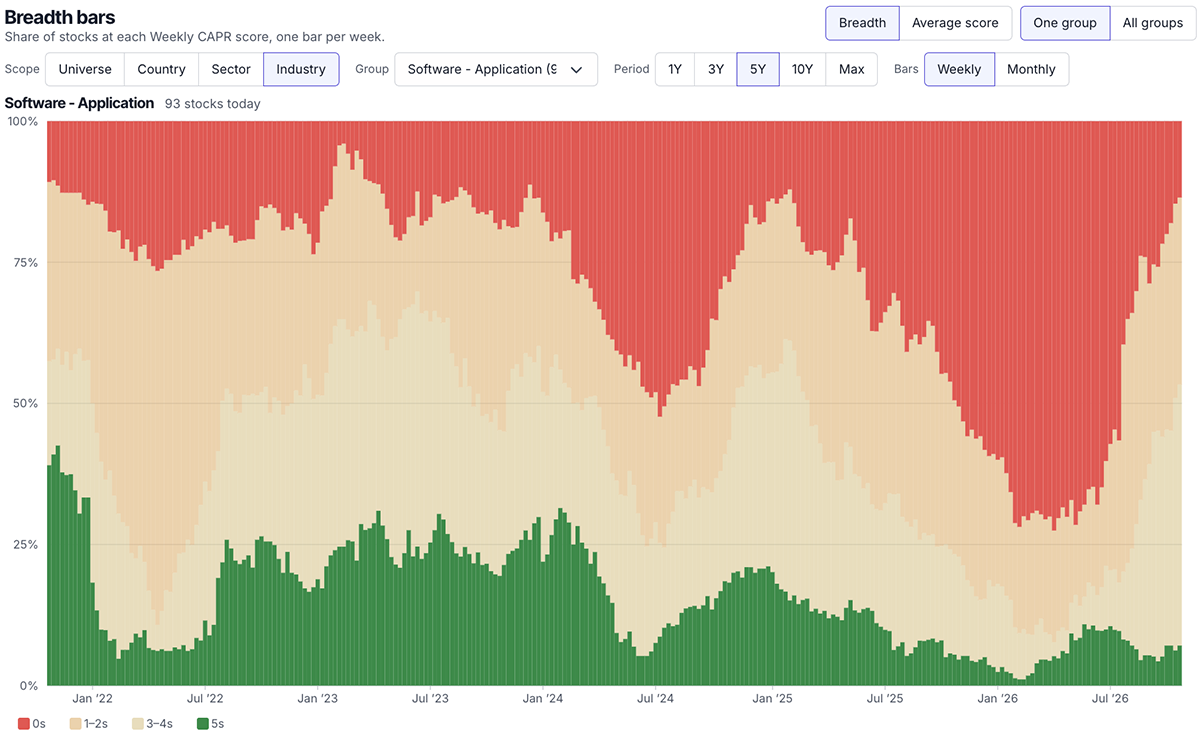
Software Alpha Breadth (in CAPR) – Weekly, Five Years
Breaking it down, software is on the mend, as the bear case evaporates.
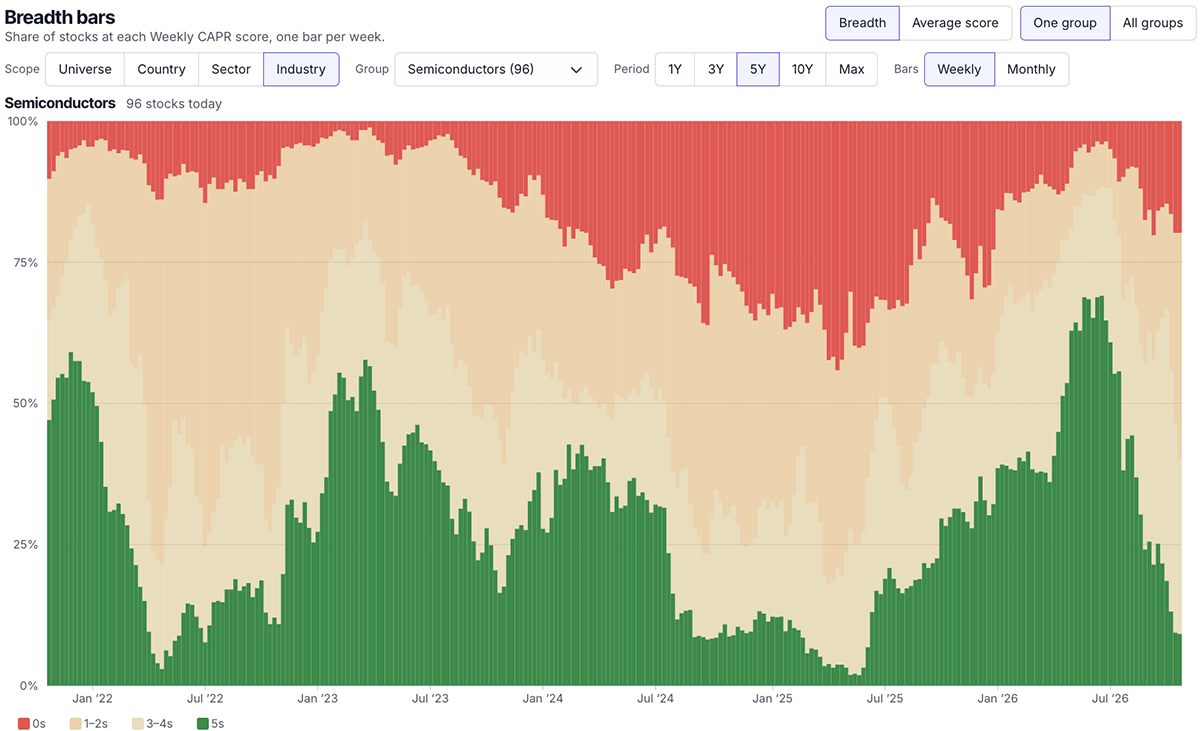
Semiconductors Alpha Breadth (in CAPR) – Weekly, Five Years
In contrast, semiconductors, the force behind AI, are deteriorating rapidly.
Sector Trends Shifting
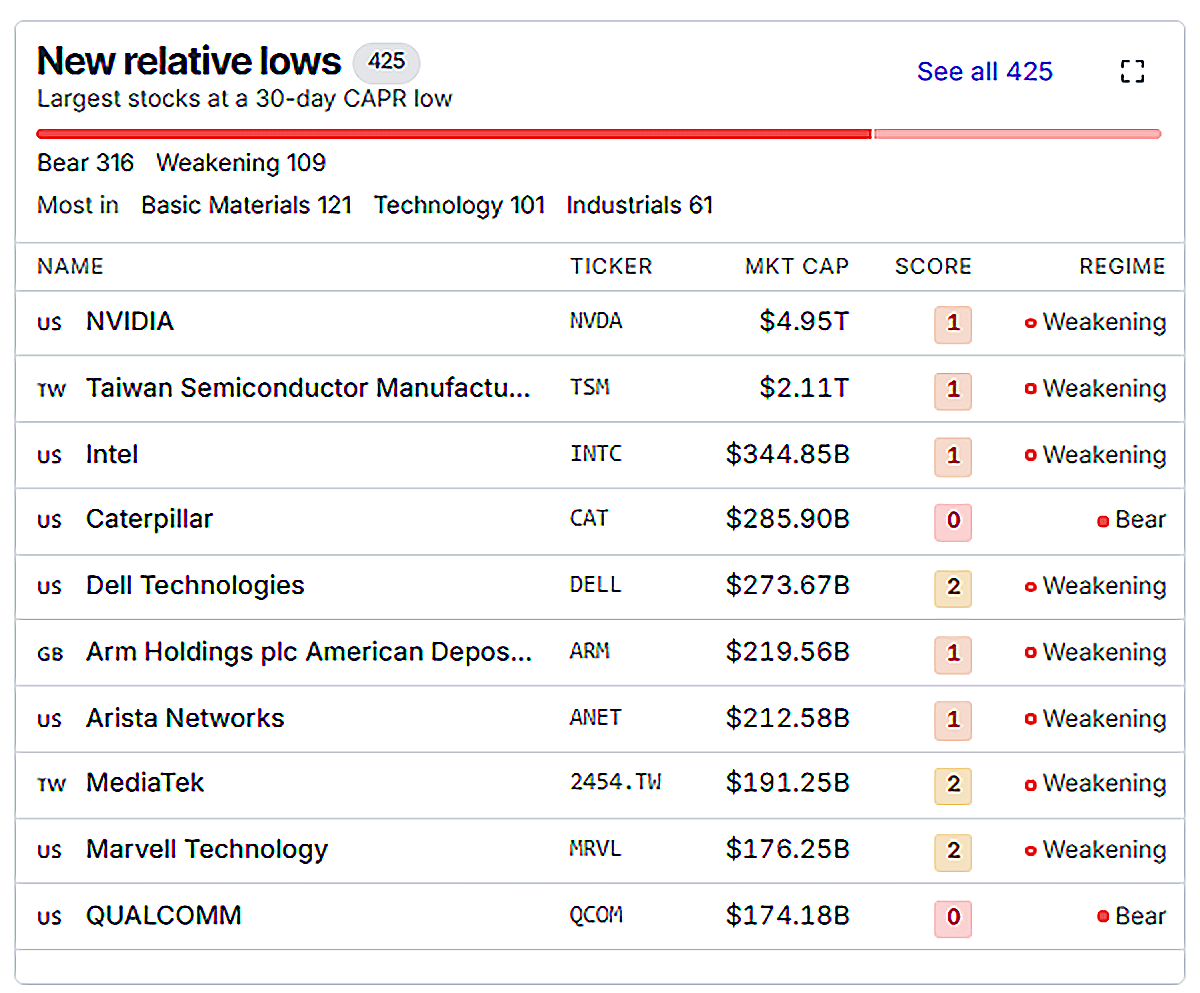
The aristocracy of the tech trade is making CAPR lows.
Short-Term CAPR Lows – Daily, 30-Day
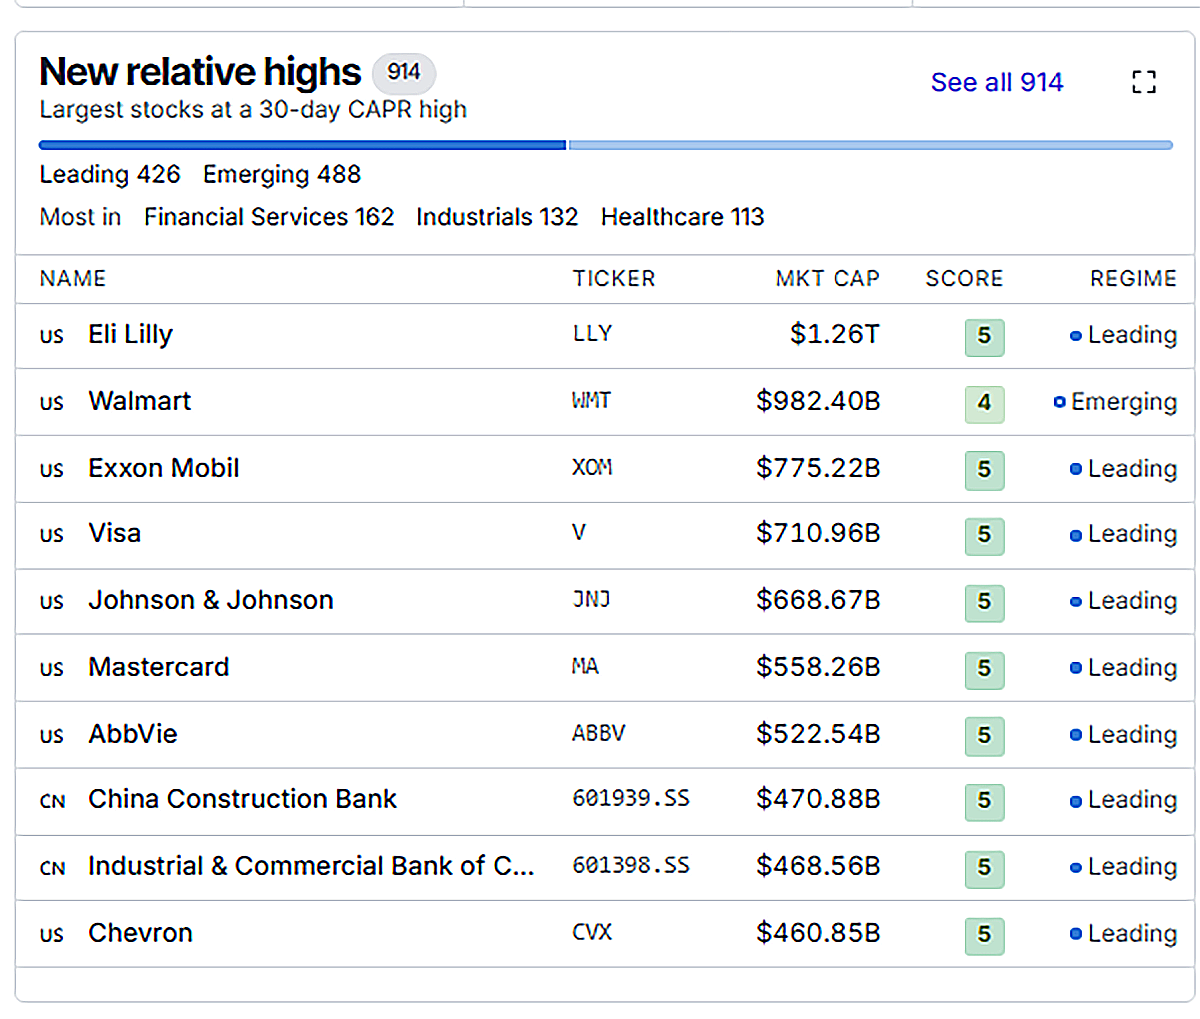
In contrast, pharma, energy and Chinese banks are beneficiaries of the selloff.
Short-Term CAPR Highs – Daily, 30-Day
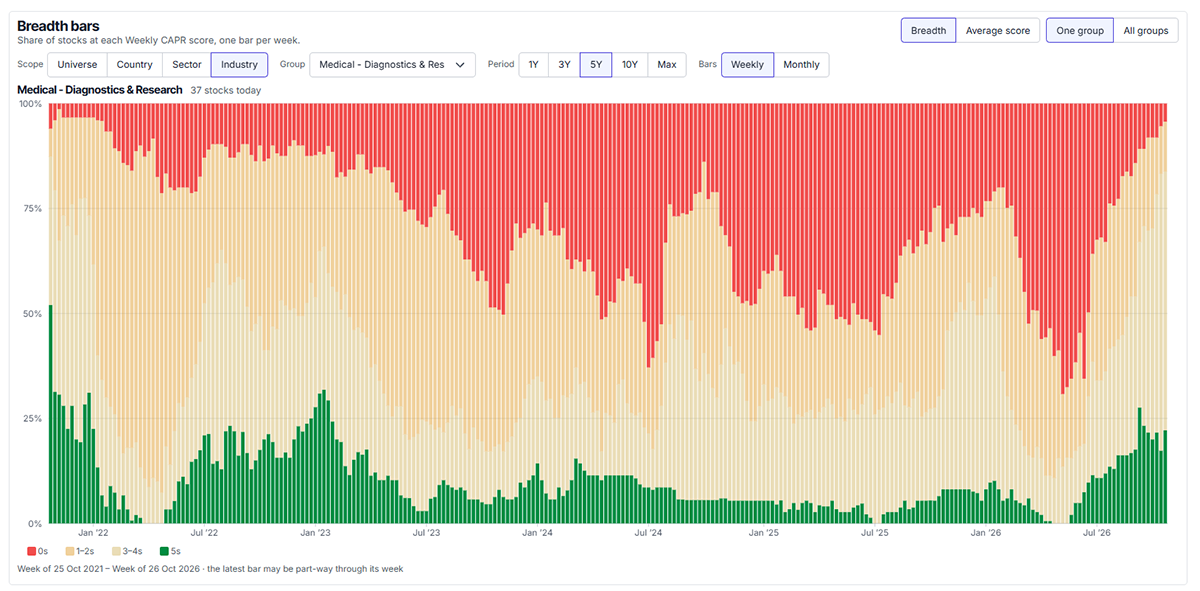
Medical Diagnostics Breadth (in CAPR) – Weekly, Five Years
Medical diagnostics stocks like Thermo Fisher Scientific (TMO) and Danaher (DHR) have turned the corner. A good hunting ground for value investors.
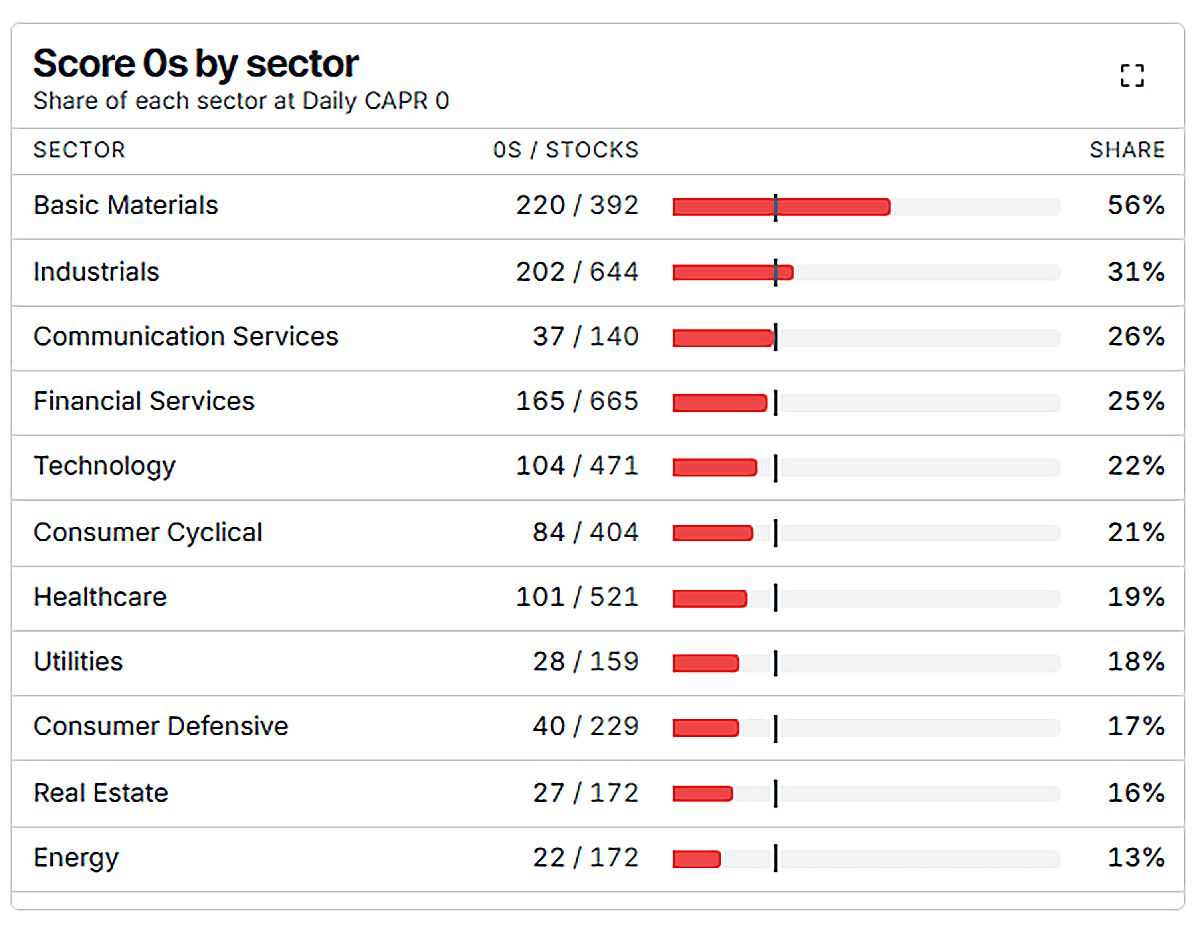
Weakest Sectors (in CAPR) – Highest Proportion of Losing Trends
Basic materials are notably weak, with 56% of stocks in a losing trend. Leaving out precious metals, there are 245 basic materials stocks, and 40% score 0, and 3% score 5. The peak came in January and February, just before the war.
- Diversified miners averaged 4.3 then and 1.8 now.
- Copper miners have gone from 5.0 to 3.0.
- Commodity chemicals rose to 2.7 in March and April on war-boosted margins, then fell to 0.6.
The 0s also cluster geographically. Nine of ten materials stocks in the Middle East score 0, 18 of 22 in India, and half of the 38 in China. That compares with only a quarter in America and Europe. These companies buy the energy and inputs that pass through Hormuz, but the prices of their commodities haven’t risen enough to offset the higher input costs.
Meanwhile, note how Real Estate is coming off the bottom, with just 16% of stocks showing bear trends.
Share % of Each Sector with a Daily CAPR Score of 0
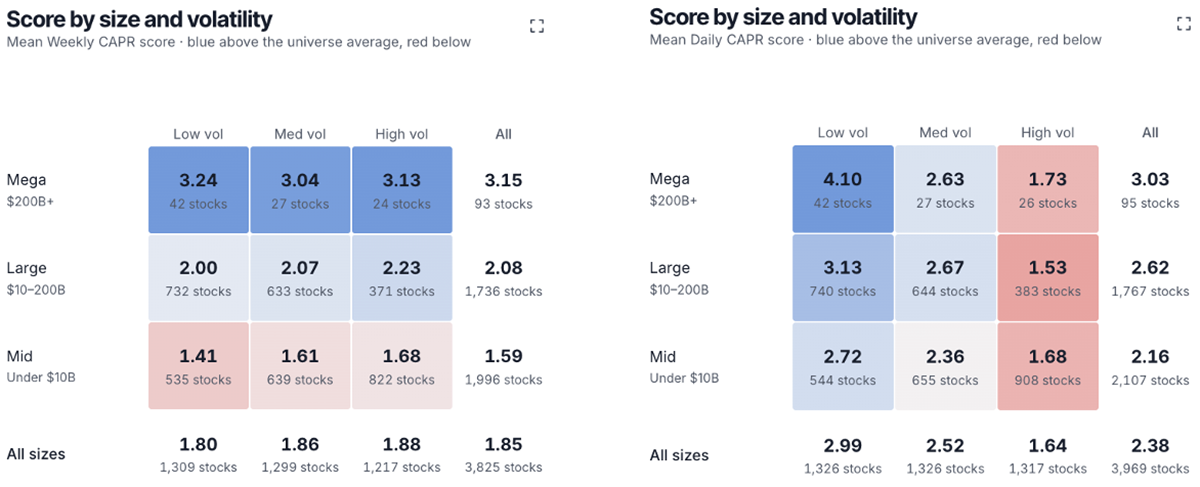
Weekly vs Daily Example: Size & Volatility
I show the average trend scores for the company-size and volatility baskets on a weekly (left) and daily (right) basis. High-volatility mega-caps are the top-right coloured box; low-volatility mid-caps are the bottom-left.
Using weekly data, the trend scores on the left still show mega-caps leading and high-vol stocks stronger. Meanwhile, daily data indicates that this is changing in the short term. Now, low-vol mega-caps are far stronger than high-vol ones. By switching between weekly and daily data, we can see trend strength on both a long- and medium-term basis.
Size and Volatility CAPR Trend Scores - Weekly (left) and Daily (right)
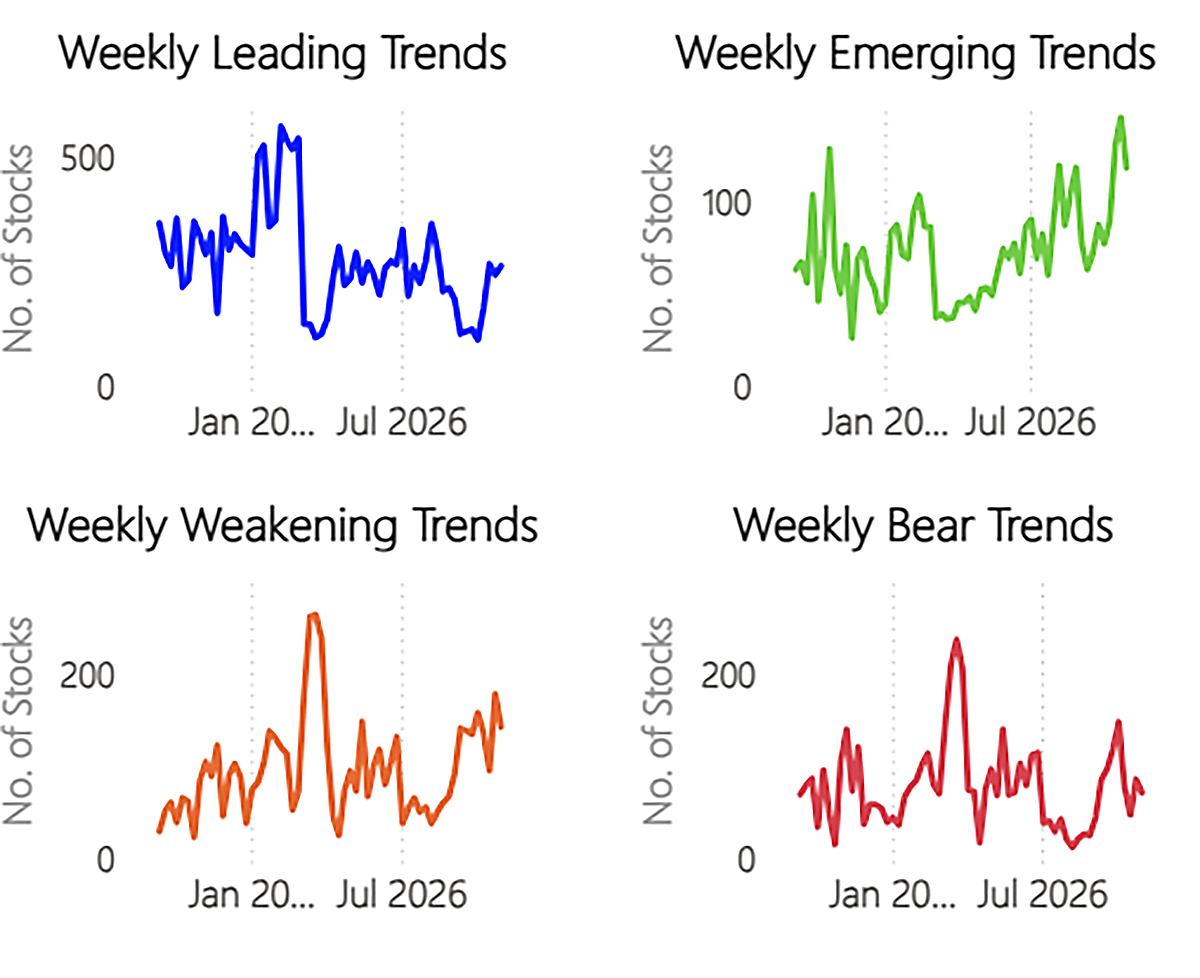
Trend Type Performance
Despite Friday’s tech crash, general market weakness seems unlikely given the explosion in emerging trends and a lack of bear trends in price terms. Yet weakening trends are growing, which could become bear trends soon. The leading trends remain light as the market seeks new leadership.
Number of Stocks in Each Trend Regime – Local Price
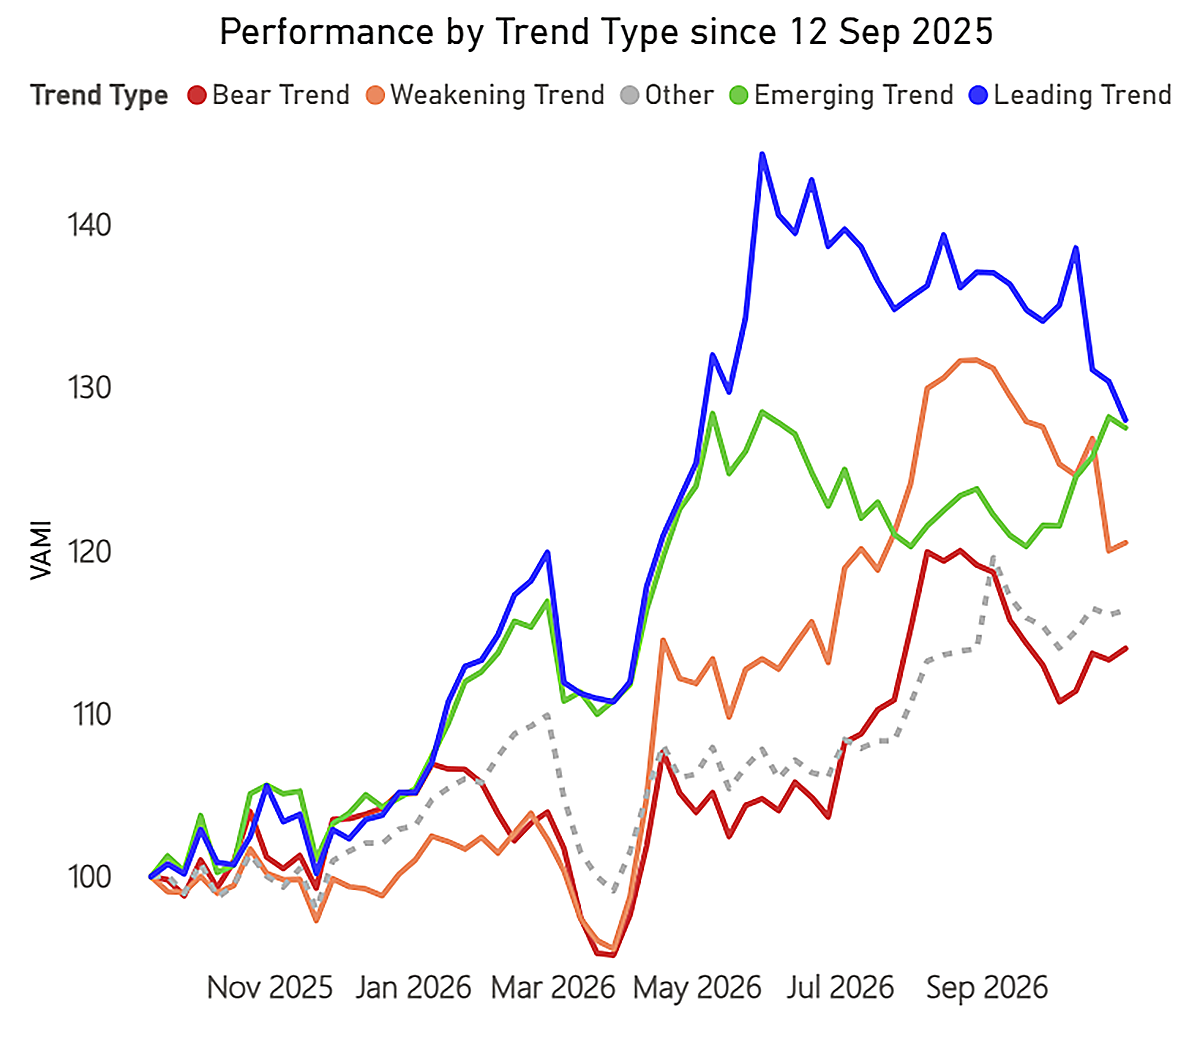
The emerging trends remain the best-performing group, but the leading trends are under pressure. The bear trends have stabilised, which is a positive sign for the overall market. The “Jaws” we saw in June have effectively closed.
Emerging Trends Outperform
Outlook
The key is that the market has absorbed the pain as previously weak stocks have stepped up. The AI trade is now very likely over, but we should expect surprises. Materials stocks are also weak, with gold and silver breaking down. That shows us that there was more speculative capital at work than expected.
Thanks for reading Global Trends.
Explore ByteTrend
This letter shows only a fraction of what’s available on the ByteTrend platform. For deep market intelligence, explore 4,000 stocks, 1,200 ETFs, 32 commodities, 35 currencies and 175 digital assets:


