
Rotation Continues


Issue 67;
- Rotation towards US rate-sensitive stocks
- Tech hardware wanes
- Time for REITs, insurance, defensives, healthcare
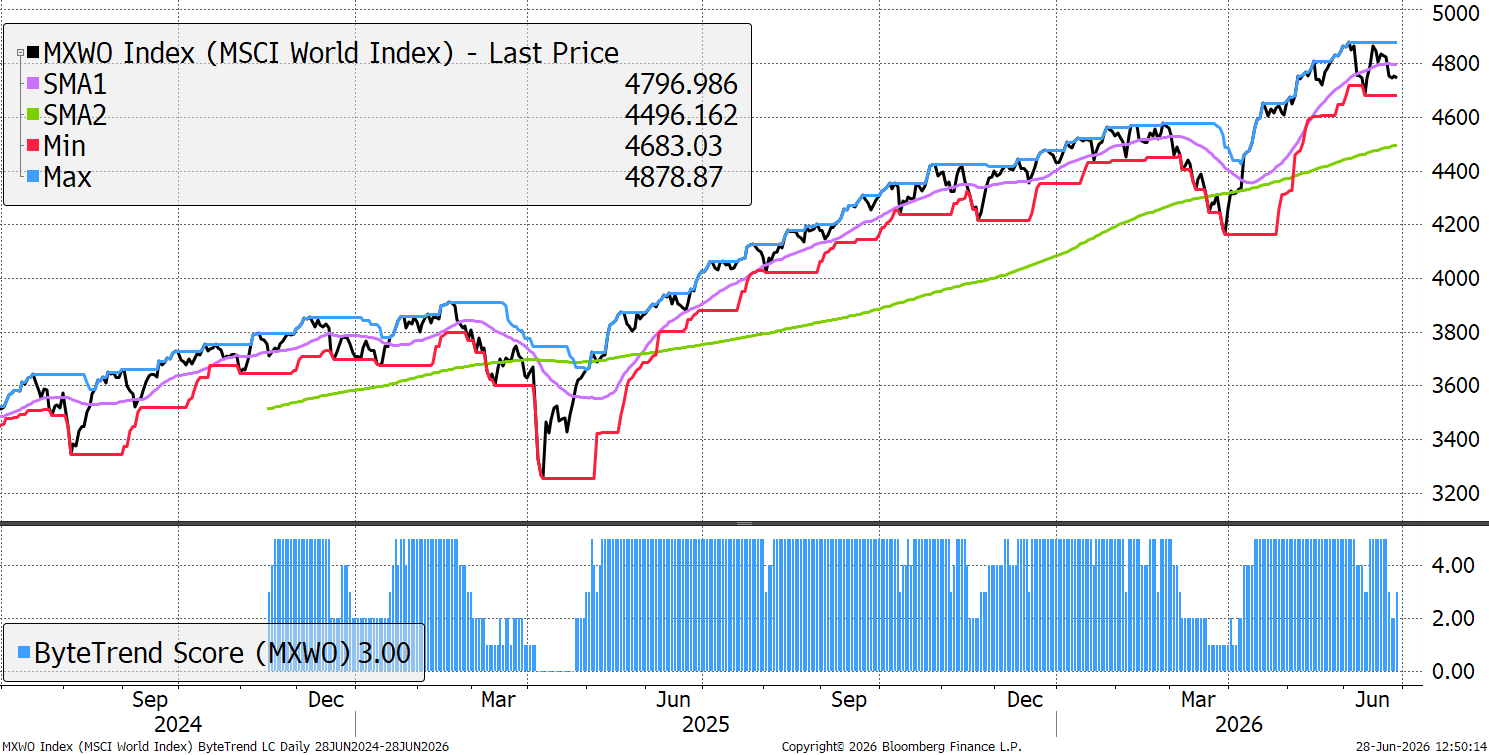
The World Index drops to a ByteTrend Score of 3 in USD. The price is below the 30-day moving average, which is now negatively sloping.
World Index – Developed Markets – Daily
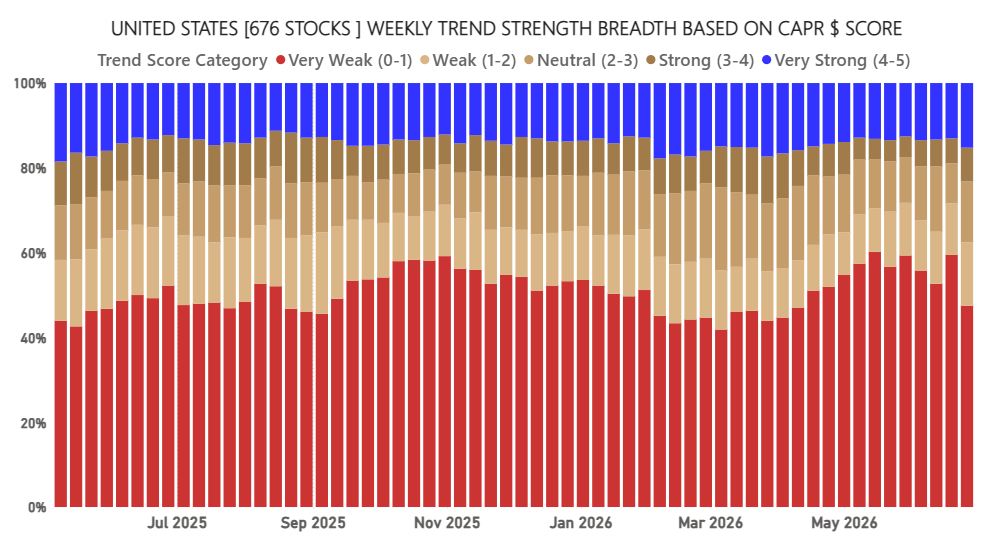
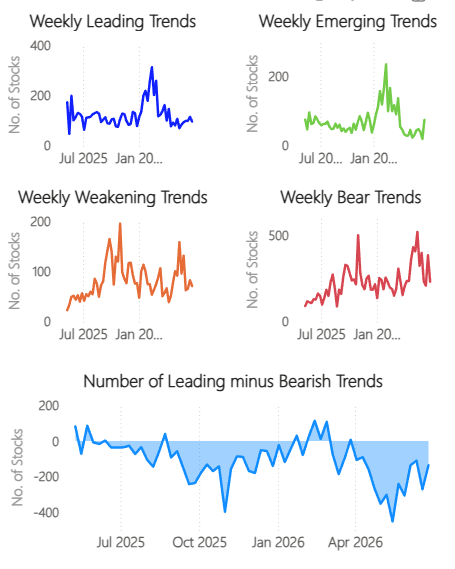
USA Breadth – CAPR
There have been continued signs of rotation in markets, with defensive and US domestic stocks showing strength, while the prevailing leadership in computer hardware is starting to wane. I show breadth data for the USA, which has shown notable improvement, especially with the drop in bear stocks (red).
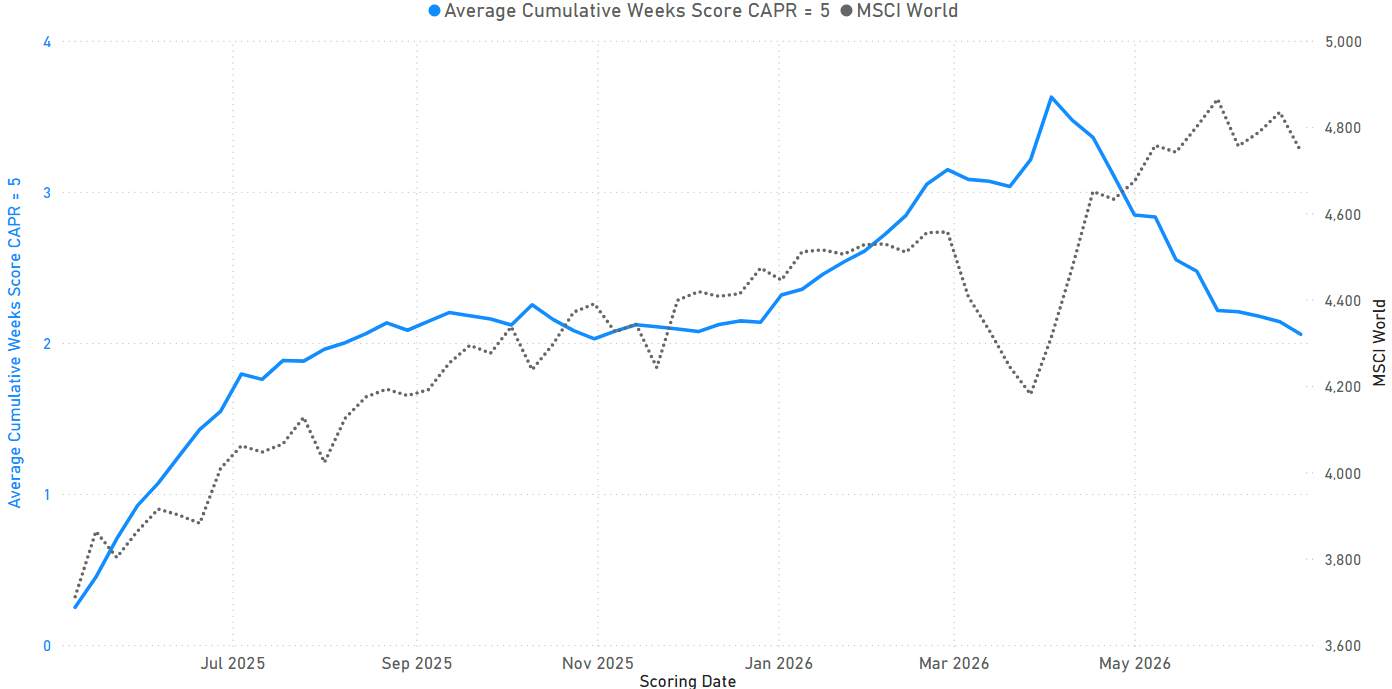
Rotation in Leadership - World
The average tenure of a global leading stock peaked in April. This is shown by the blue line. Please ignore the pre-September data, as the calculation takes time to register the full signal. This will be corrected soon, with data going back to 2006.
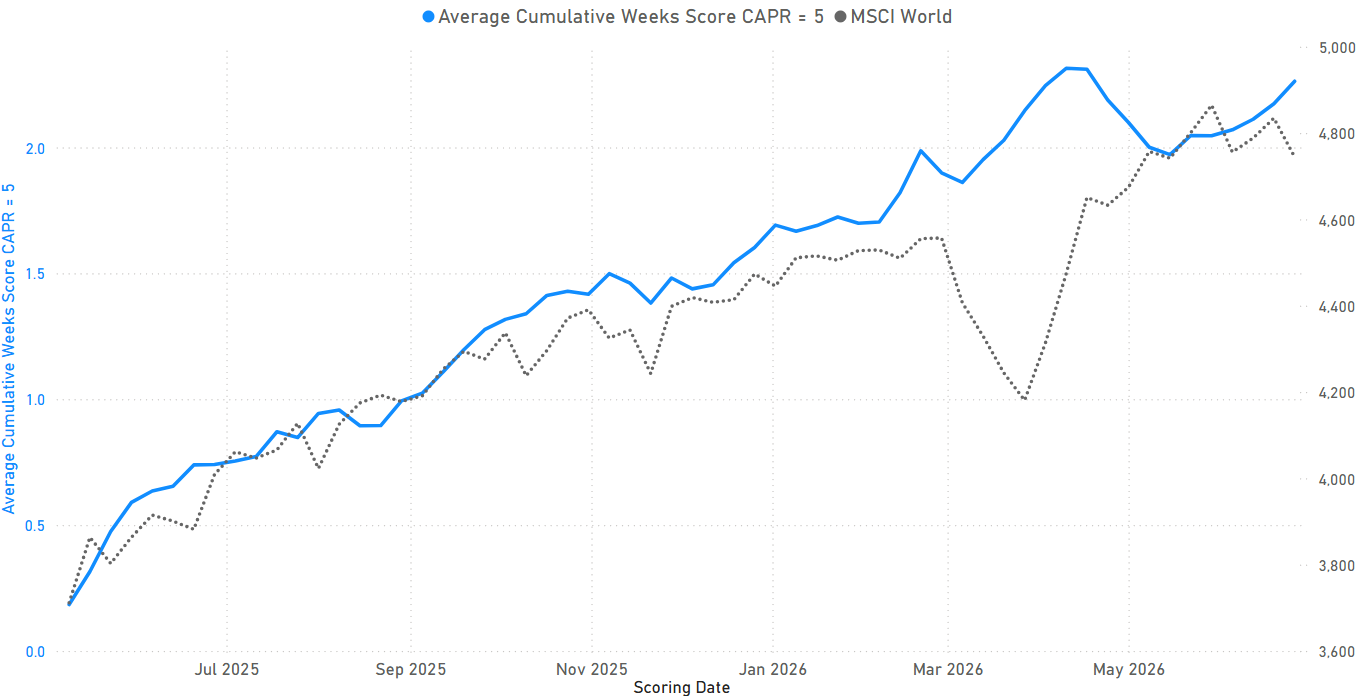
Rotation in Leadership - USA
Yet in the USA, it is improving. This is the only country currently displaying improving tenure of leadership.
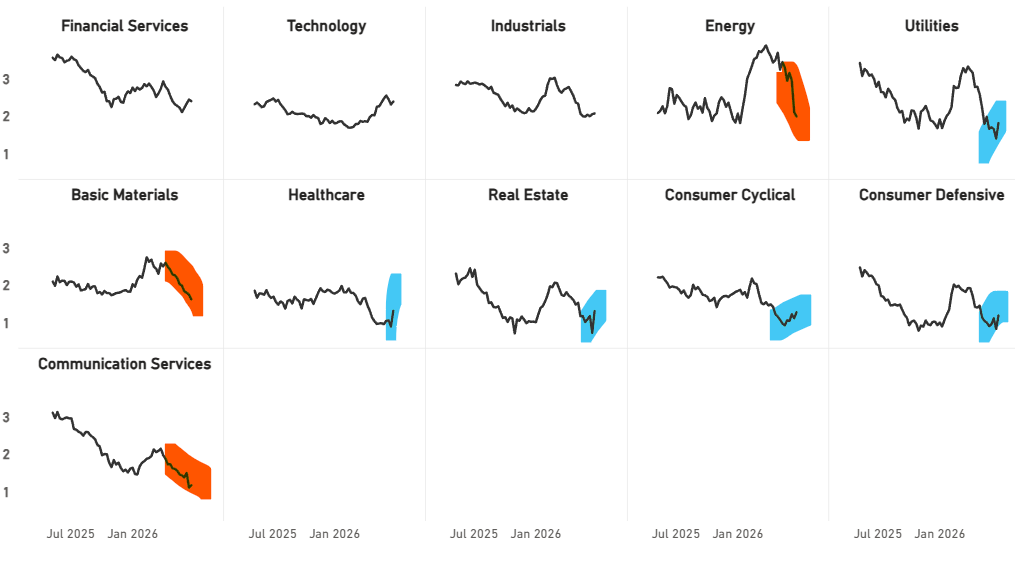
Sector Trend Changes in CAPR
The rally in bonds has encouraged rotation into weak sectors, which have improved markedly. Real estate in particular has finally caught a bid. Energy slides with the oil price taking basic materials with it. Communications includes some of the leading internet stocks, which appear to be slowing.
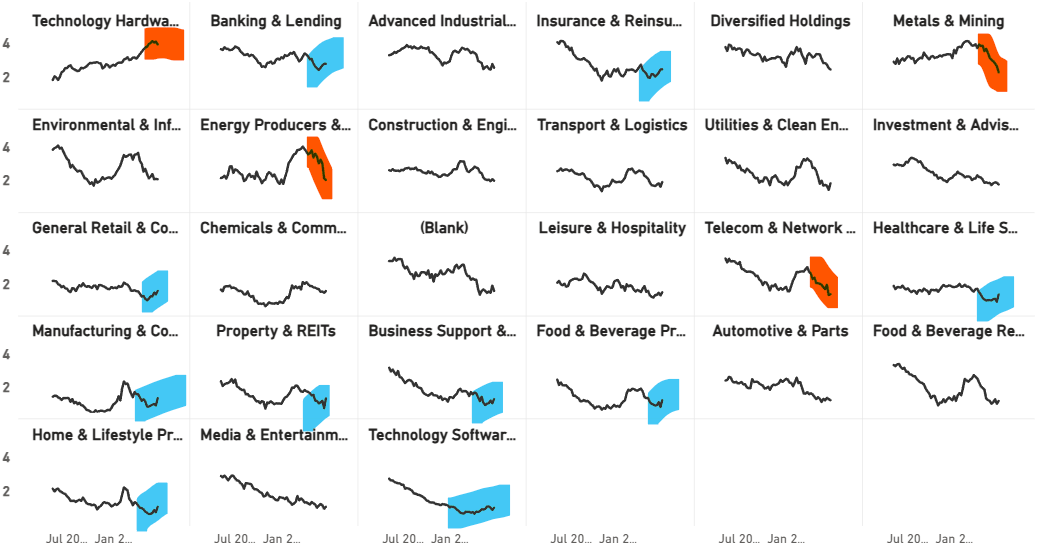
Industry Trend Changes in CAPR
Tech hardware drifts slightly, in a volatile environment. Software, healthcare, REITs, and retail all show signs of improvement.
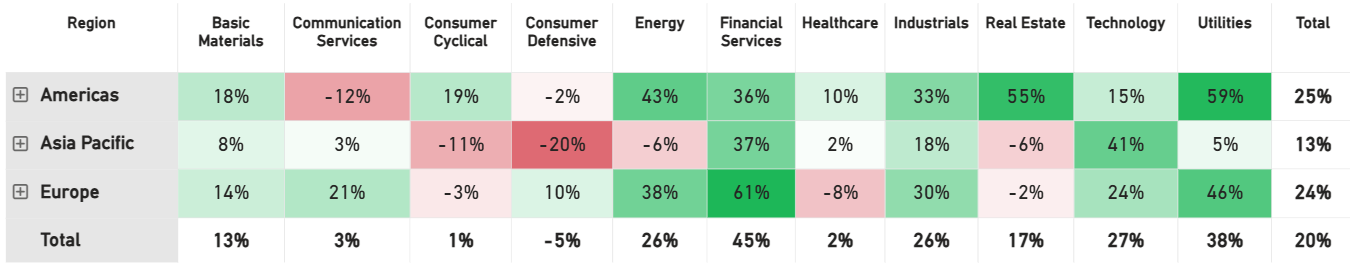
Net Winners Local Currency
The winners-less-losers metric guides asset allocators. Sector inclusion has broadened, with few notable underweights. Energy has weakened considerably but remains strong along with financials, industrials, technology and utilities. Note how Asia is now light compared with recent observations.
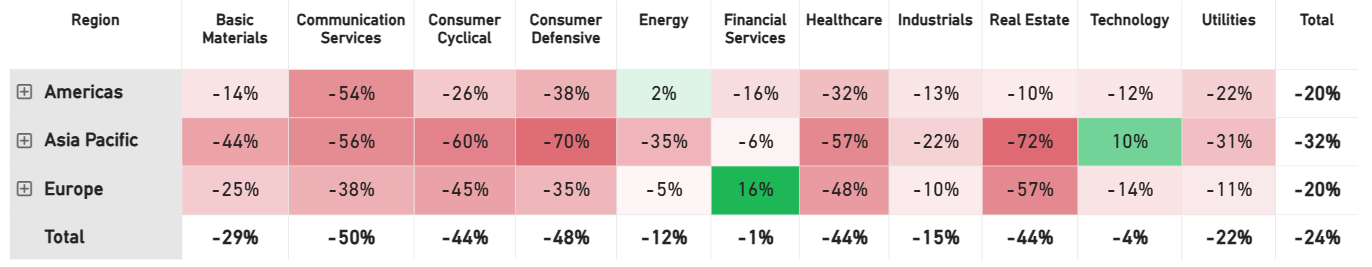
Net Winners CAPR
This version of the same data is harder to get your head around. It is telling you that the leadership is extremely narrow, and the thing to own is Asian tech (Taiwan, Korea), and European financials. It’s a narrow set.
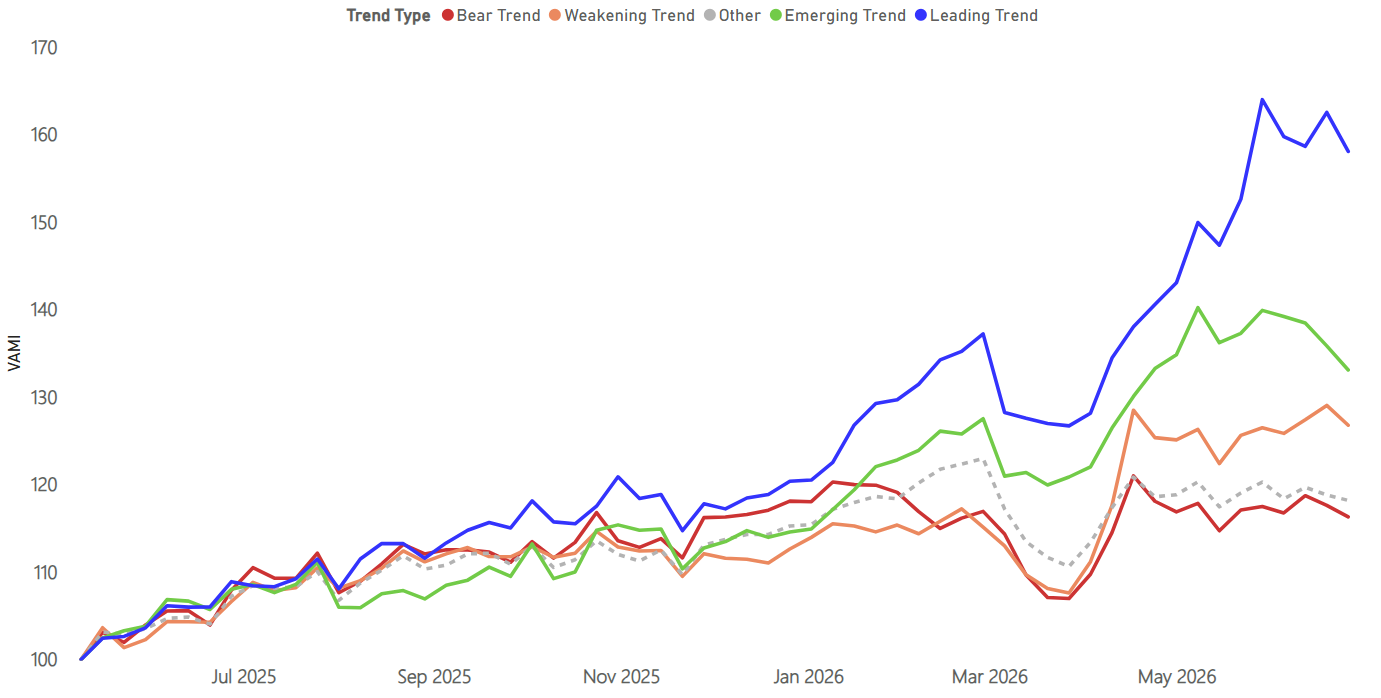
Trend Type Performance
The leaders have started to stall, yet the emerging trends are the weakest. The leadership has been historically strong and so cooling is inevitable. The bigger question is whether this becomes a major peak, which seems likely. The risk of a bear market increases when the bear stocks are falling which isn’t yet happening.
Global Trend Classifications
Not much change this week, but the rotation is starting to show up in the emerging trends.
Regions and Industries Average Relative Score
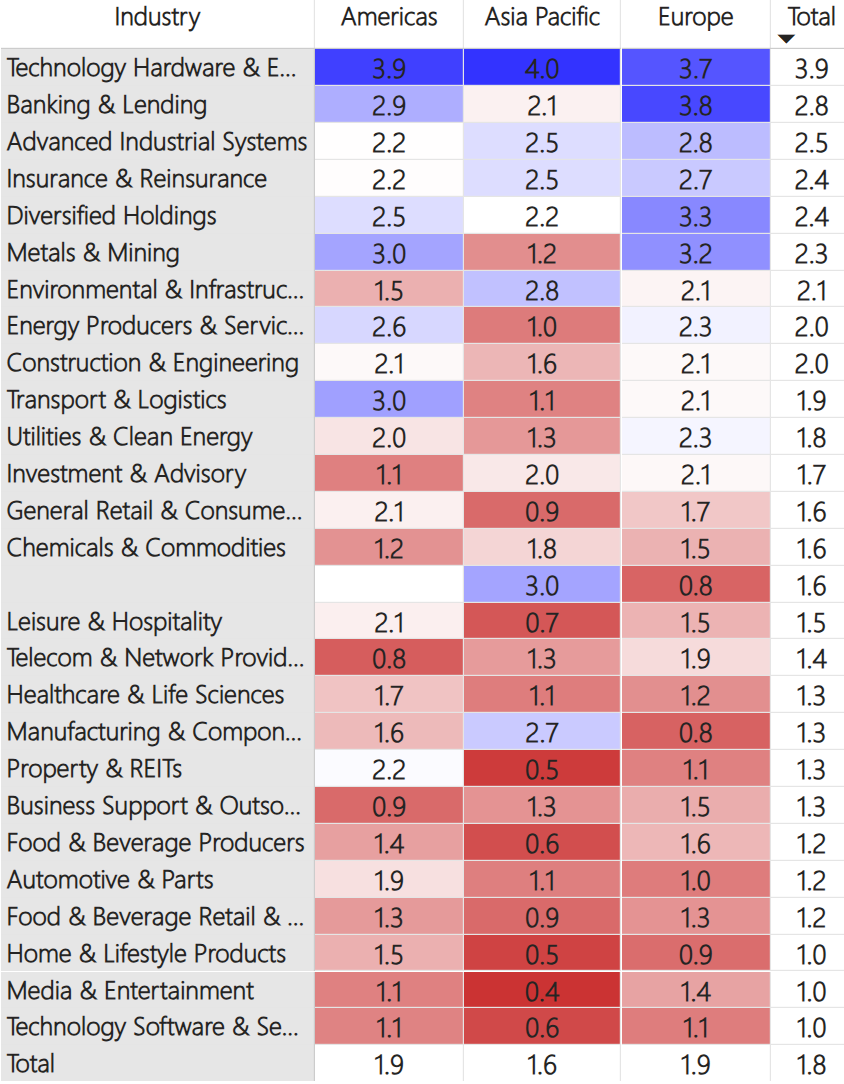
This table (below) shows the average CAPR score for each global industry, by region and in total.
Tech hardware remains at the top of the table, but weakened slightly last week as the first cracks appeared in the powerful AI rally. Metals and Mining and Energy Producers provide powerful examples of what can happen when the top trend breaks. Both are down sharply in recent months.
Meanwhile, as the old winners fade, new ones are emerging. Healthcare is rising up the table fastest, but REITs, Manufacturing, Food & Bev, General Retail, Home & Lifestyle (Luxury), and Software are all rallying too. Utilities also bounced following their recent poor run.
Drilling down by geography, US Insurance stocks are rising quickly. In Europe, Transport and Logistics stocks are strengthening, while Infrastructure is weakening. REITs remain strongest in the US.
User Guide
Refer to our GTI: User Guide for an overview of the key concepts and terminology used in this report. These concepts may take a little bit of getting used to, but they are very powerful once you do.
Leading Trends with New Highs
These stocks are trading at the 30-week CAPR highs with a ByteTrend Score of 5. All charts shown are CAPR rebased to 100.
| Name | Annual Vol 30w | Mkt Cap $Bn | Industry |
| Micron Technology, Inc. | 78 | 1277 | Technology Hardware |
| Applied Materials, Inc. | 52 | 498 | Technology Hardware |
| Caterpillar Inc. | 30 | 459 | Infrastructure |
| Royal Bank of Canada | 14 | 282 | Banking & Lending |
| Citigroup Inc. | 30 | 242 | Banking & Lending |
| Palo Alto Networks, Inc. | 50 | 207 | Software & Services |
| Amphenol | 45 | 201 | Technology Hardware |
| The Toronto-Dominion Bank | 16 | 198 | Banking & Lending |
| Banco Santander, S.A. | 30 | 198 | Banking & Lending |
| Corning Inc | 60 | 192 | Technology Hardware |
| Fast Retailing Co., Ltd. | 38 | 160 | General Retail |
| Advantest | 53 | 145 | Technology Hardware |
| DBS Group Holdings Ltd | 14 | 144 | Banks |
| BNP Paribas S.A. | 27 | 127 | Banking & Lending |
| Bank of Montreal | 17 | 123 | Banking & Lending |
| Fortinet, Inc. | 52 | 111 | Software & Services |
| The Bank of Nova Scotia | 18 | 106 | Banking & Lending |
| Canadian Imperial Bank | 20 | 105 | Banking & Lending |
| The Bank of New York Mellon | 19 | 97 | Banking & Lending |
| Recruit Holdings Co., Ltd. | 51 | 95 | Business Support |
| Monster Beverage | 27 | 94 | Food & Beverage Producers |
| ASE Technology Holding | 44 | 87 | Technology Hardware |
| Oversea-Chinese Banking | 15 | 86 | Banking & Lending |
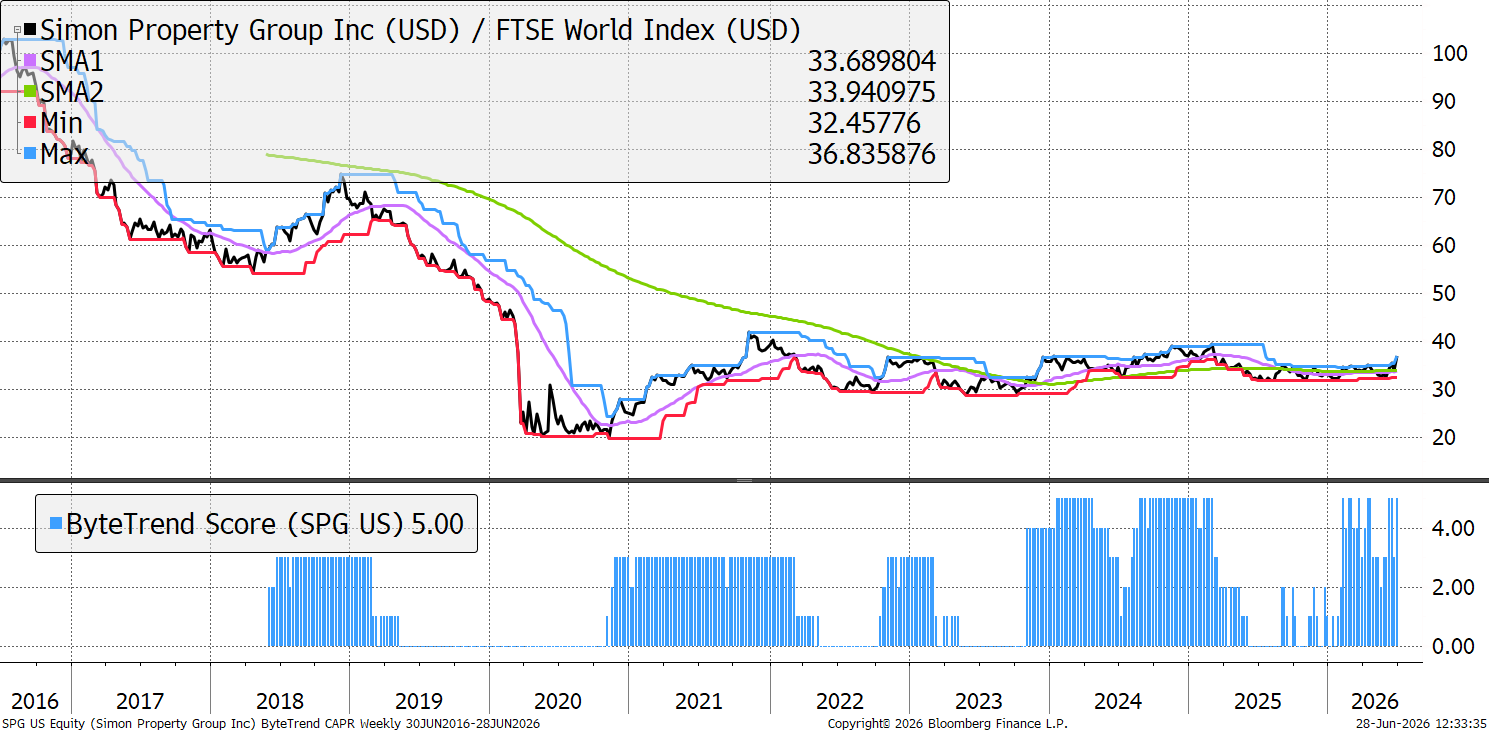
| Simon Property Group, Inc. | 21 | 74 | Property & REITs |
| Assicurazioni Generali S.p.A. | 23 | 72 | Insurance & Reinsurance |
| United Rentals, Inc. | 50 | 70 | Transport & Logistics |
| Teradyne, Inc. | 59 | 68 | Technology Hardware |
| Manulife Financial | 20 | 67 | Insurance & Reinsurance |
| Panasonic Holdings | 48 | 66 | Technology Hardware |
| United Microelectronics | 64 | 65 | Technology Hardware |
| W.W. Grainger, Inc. | 26 | 64 | Construction & Engineering |
| Delta Air Lines, Inc. | 40 | 61 | Transport & Logistics |
| National Bank of Canada | 21 | 60 | Banking & Lending |
| Standard Chartered PLC | 32 | 59 | Banking & Lending |
| Great-West Lifeco Inc. | 18 | 56 | Insurance & Reinsurance |
| Renesas Electronics | 52 | 54 | Technology Hardware |
| Rockwell Automation, Inc. | 27 | 53 | Construction & Engineering |
| Samsung C&T | 73 | 52 | Construction & Engineering |
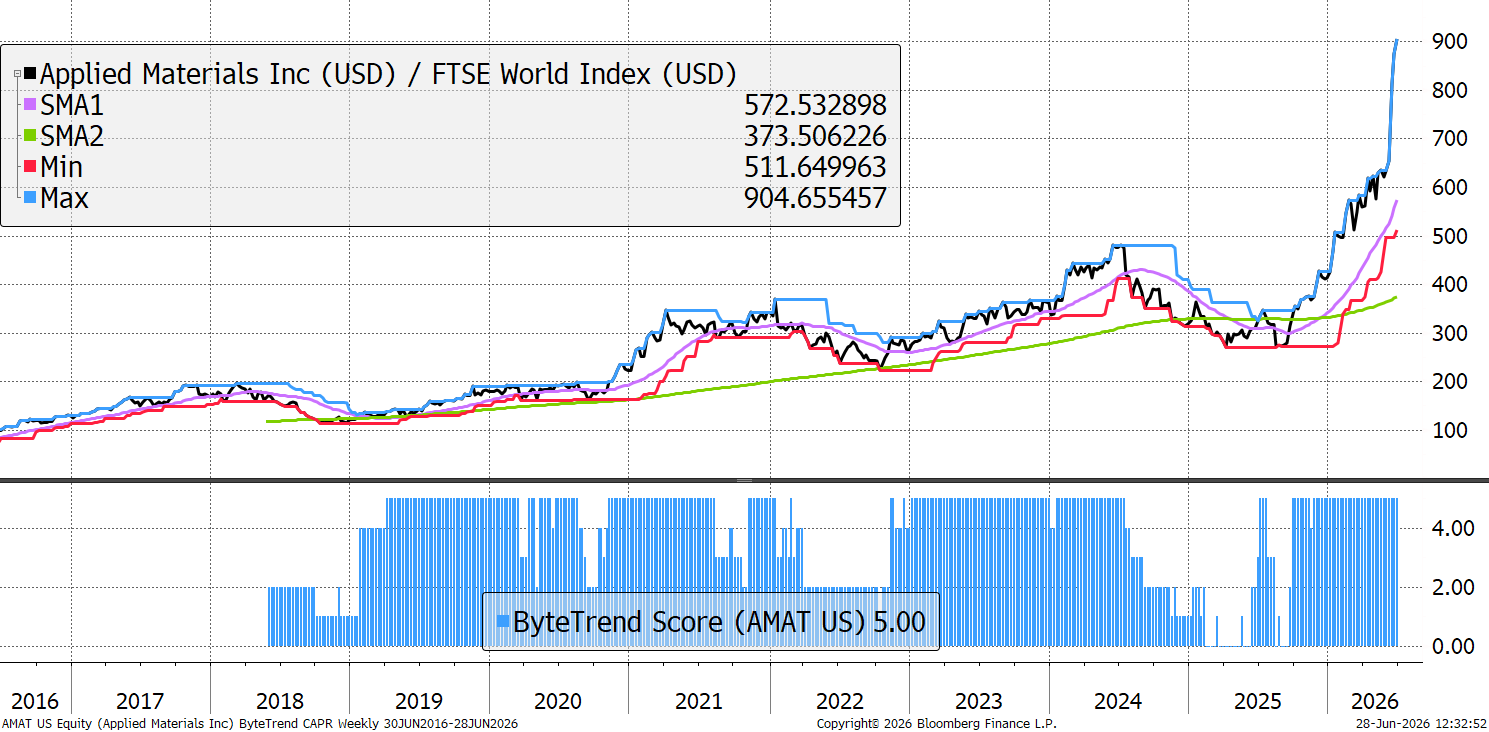
Applied Materials
Applied Materials is one of the core picks-and-shovels names for advanced semis, selling the machines and equipment needed to make semis. It has been on such a strong run because it sits at the centre of the AI-driven semiconductor capex cycle. The latest push higher was helped by Micron’s upbeat AI memory revenue outlook, which lifted wafer-fabrication equipment stocks.
Simon Property Group
REITs are picking up again as interest rates fall with the oil price. Simon Property’s premium mall and outlet portfolio, US-based, is benefiting from consumers still spending at destination retail assets that are difficult to replicate.
New Leading Trends
These stocks are trading at the 30-week CAPR highs with a ByteTrend Score of 5, except they are new trends this week, having previously had a score below 5. All charts shown are CAPR rebased to 100.
| Name | Annual Vol 30w | Mkt Cap $Bn | Industry |
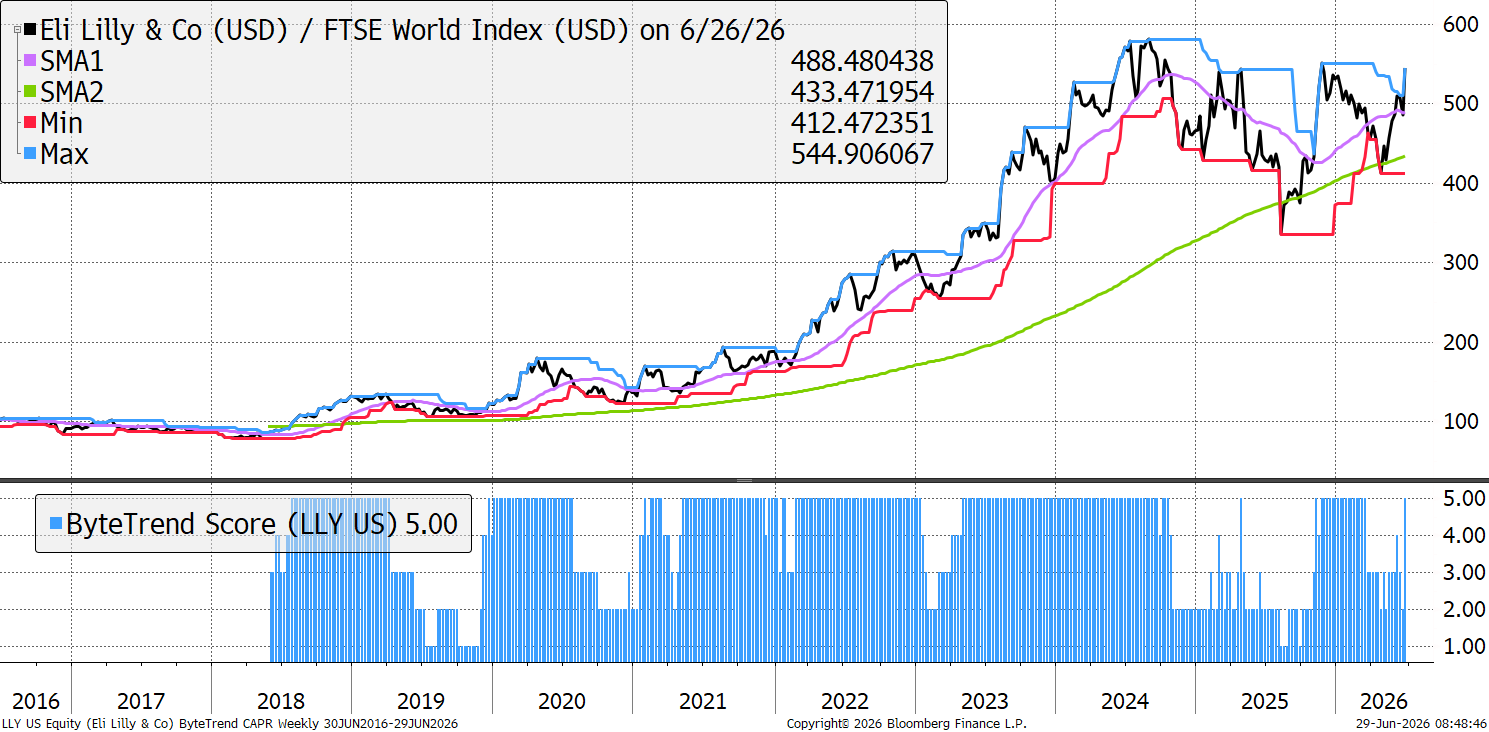
| Eli Lilly and Company | 32 | 1136 | Healthcare & Life Sciences |
| AbbVie Inc. | 30 | 444 | Healthcare & Life Sciences |
| GE Aerospace | 36 | 386 | Advanced Industrial |
| Anheuser-Busch InBev SA/NV | 28 | 165 | Food & Beverage Producers |
| Welltower Inc. | 27 | 160 | Property & REITs |
| Richemont | 34 | 136 | Home & Lifestyle Products |
| AXA S.A. | 25 | 102 | Insurance & Reinsurance |
| The Allstate | 26 | 62 | Insurance & Reinsurance |
| WuXi AppTec Co., Ltd. | 38 | 53 | Healthcare & Life Sciences |
| Galderma Group AG | 27 | 52 | Healthcare & Life Sciences |
Eli Lilly
Healthcare is back on the up, and Eli Lilly remains the leading company in the space, as it has beaten Novo Nordisk to dominate the large and fast-growing obesity care market. Its GLP-1 (weight-loss) drug sales are growing fastest, due to higher efficacy and speed to market. Novo was the first to produce a pill version, and the Trump administration’s policy moves have caused some doubt, but results haven’t shown signs of weakness yet.
Emerging Trends
These stocks are trading at the 30-week CAPR highs with a ByteTrend Score of less than 5. They don’t have to be in an uptrend, just emerging. All charts shown are CAPR rebased to 100.
| Name | Annual Vol 30w | Mkt Cap $Bn | Industry |
| UnitedHealth Group | 41 | 389 | Healthcare & Life Sciences |
| CVS Health Corp. | 35 | 133 | Healthcare & Life Sciences |
| CSX | 22 | 89 | Transport & Logistics |
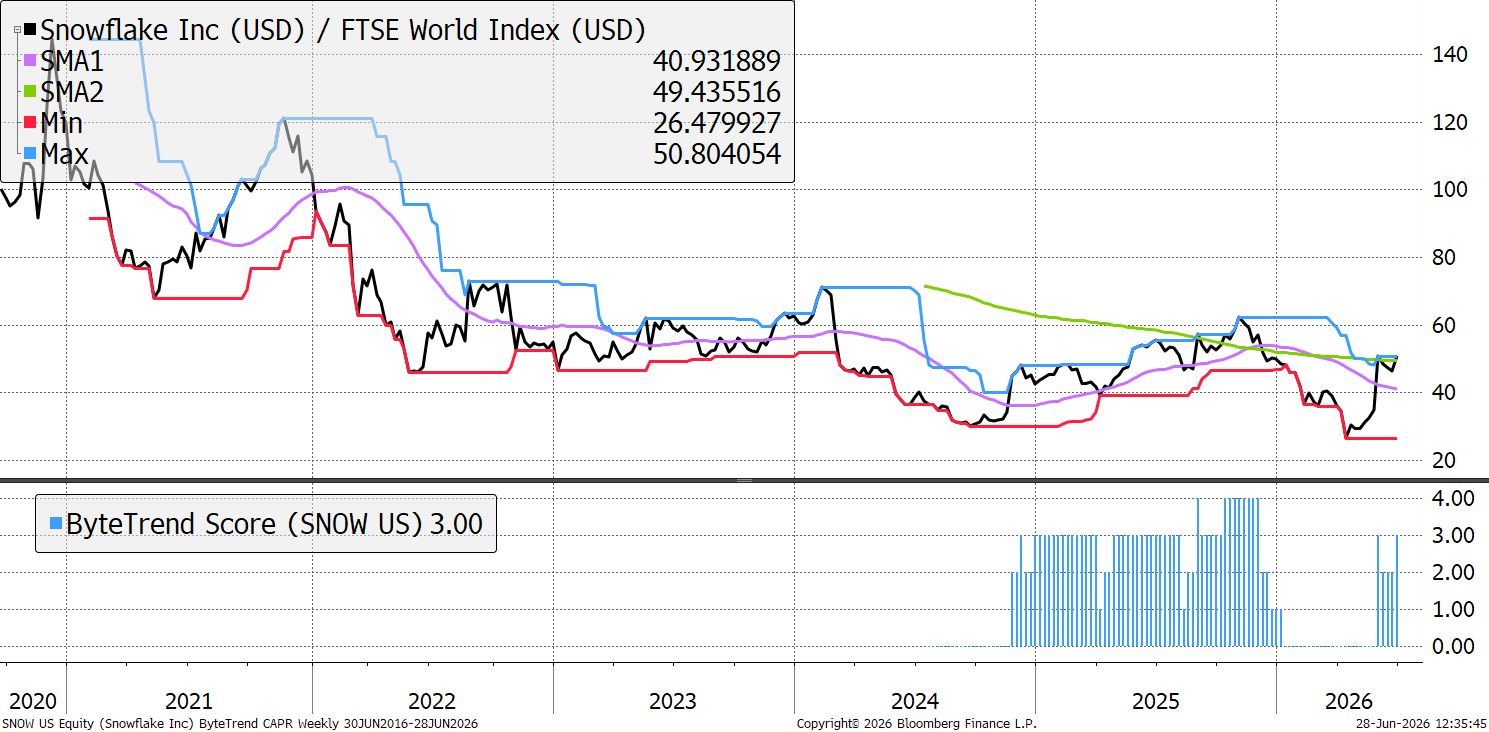
| Snowflake Inc. | 85 | 86 | Software & Services |
| Alimentation Couche-Tard Inc. | 33 | 86 | General Retail |
| Canadian National Railway | 24 | 73 | Transport & Logistics |
| Merck KGaA | 33 | 72 | Healthcare & Life Sciences |
| Target | 28 | 64 | Food & Beverage |
| Carrier Global | 34 | 61 | Construction & Engineering |
| Dominion Energy, Inc. | 24 | 61 | Utilities & Clean Energy |
| Public Storage | 29 | 57 | Property & REITs |
| Cardinal Health, Inc. | 30 | 56 | Healthcare & Life Sciences |
| Fomento Económico Mexicano | 19 | 53 | Food & Beverage Producers |
Snowflake
Snowflake is acting like a high-growth software platform again. In recent weeks, the stock has jumped sharply on stronger results, with revenue growth re-accelerating to the low-30% range and product demand improving, especially around AI and data workloads. Sentiment was also lifted by news of a deeper AWS relationship, and other usage signals that suggest customers are increasing platform adoption.
Weakening
These stocks are trading at the 30-week CAPR lows with a ByteTrend Score above 0. They are weakening trends but not yet downtrends. All charts shown are CAPR rebased to 100.
| Name | Annual Vol 30w | Mkt Cap $Bn | Industry |
| Meta Platforms, Inc. | 40 | 1397 | Software & Services |
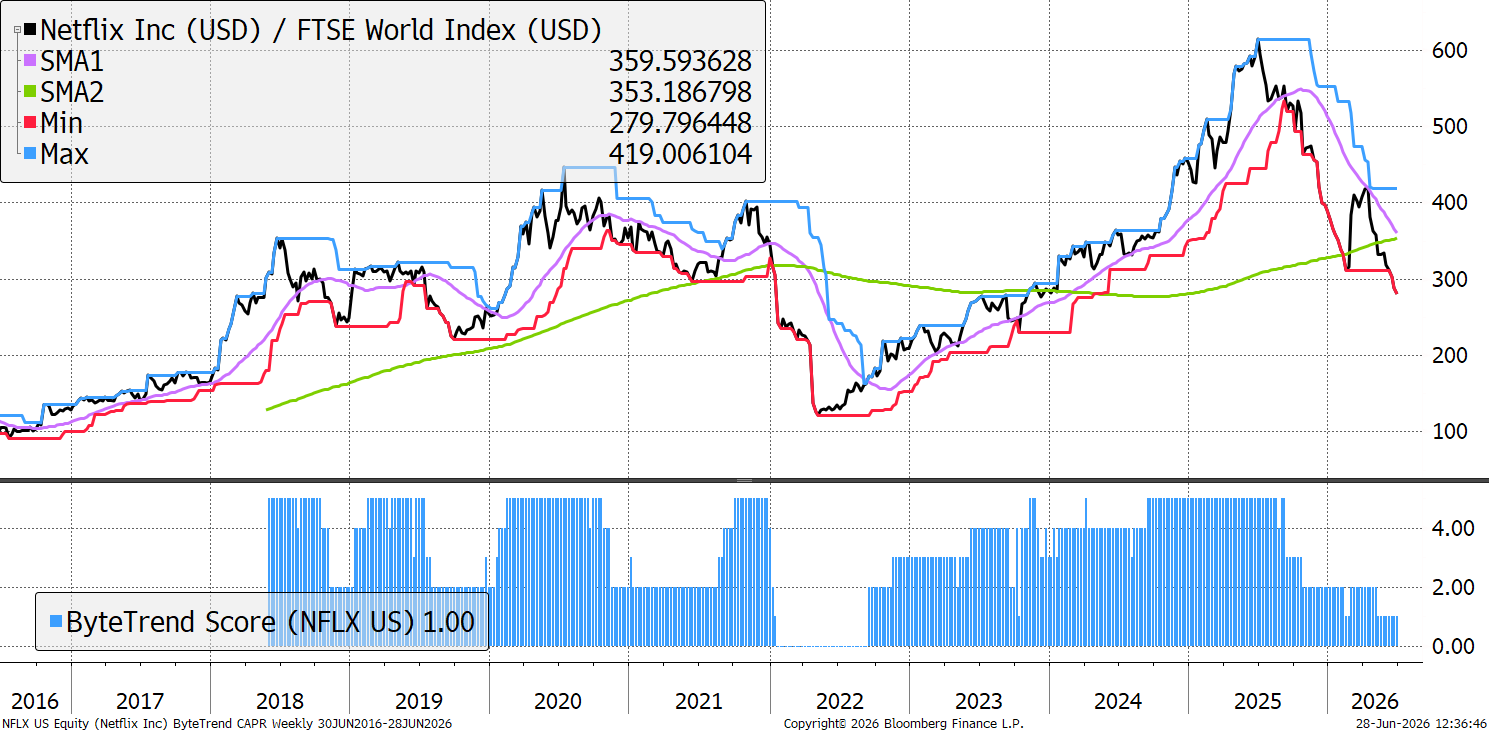
| Netflix, Inc. | 39 | 311 | Media & Entertainment |
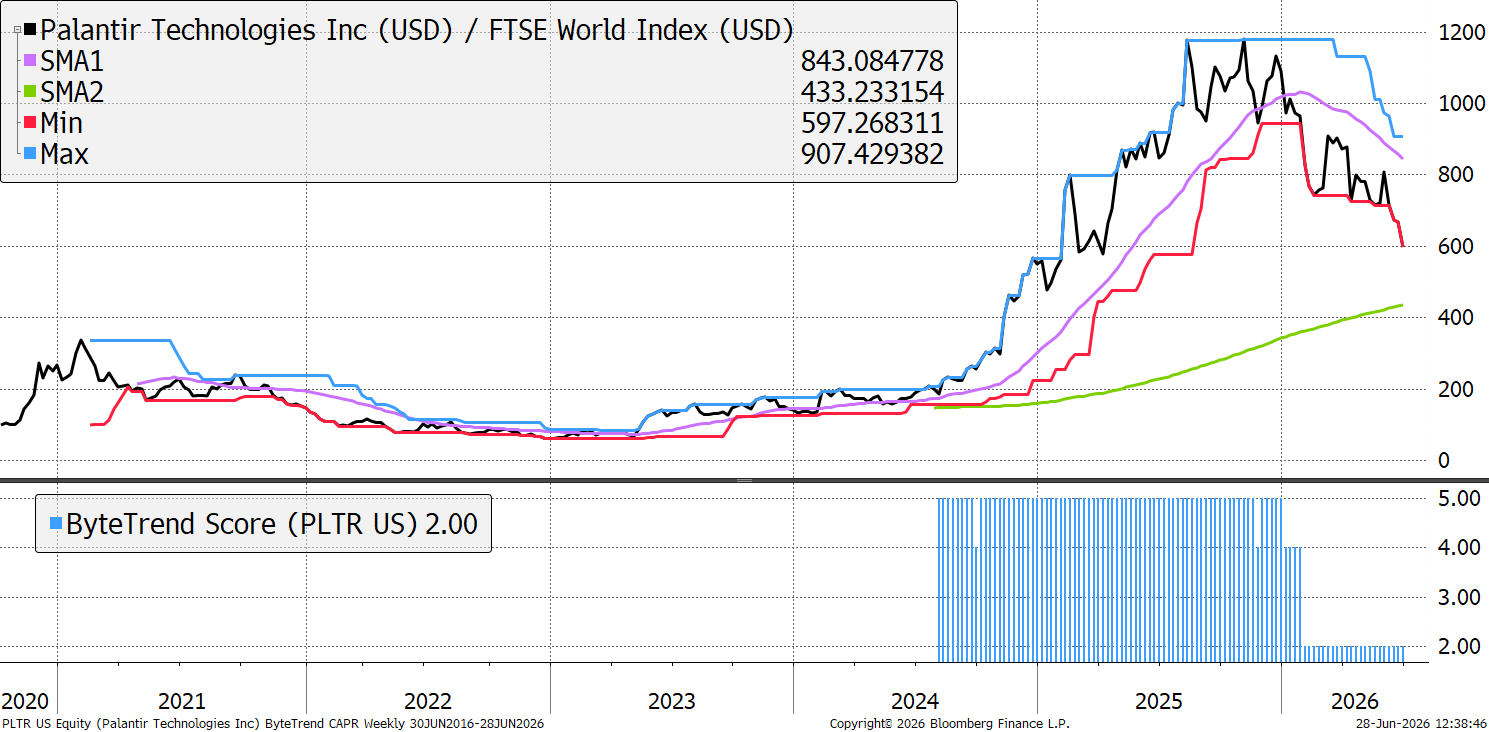
| Palantir Technologies Inc. | 56 | 259 | Software & Services |
| Agricultural Bank of China | 23 | 238 | Banking & Lending |
| China Life Insurance | 39 | 157 | Insurance & Reinsurance |
| Deutsche Telekom AG | 26 | 145 | Telecom & Network |
| Hitachi, Ltd. | 31 | 125 | Diversified Holdings |
| China Shenhua Energy | 24 | 103 | Energy Producers |
| Newmont | 50 | 103 | Metals & Mining |
| Zijin Mining Group Co., Ltd. | 43 | 93 | Metals & Mining |
| KKR & Co. Inc. | 39 | 81 | Investment & Advisory |
| Mitsui & Co., Ltd. | 36 | 79 | Diversified Holdings |
| Agnico Eagle Mines | 53 | 79 | Metals & Mining |
| Chugai Pharmaceutical | 30 | 76 | Healthcare & Life Sciences |
| Xiaomi | 31 | 71 | Technology Hardware |
| Carvana Co. | 60 | 68 | Automotive & Parts |
| Barrick Gold | 45 | 62 | Metals & Mining |
| Wheaton Precious Metals | 56 | 51 | Metals & Mining |
| Thales S.A. | 38 | 51 | Advanced Industrial |
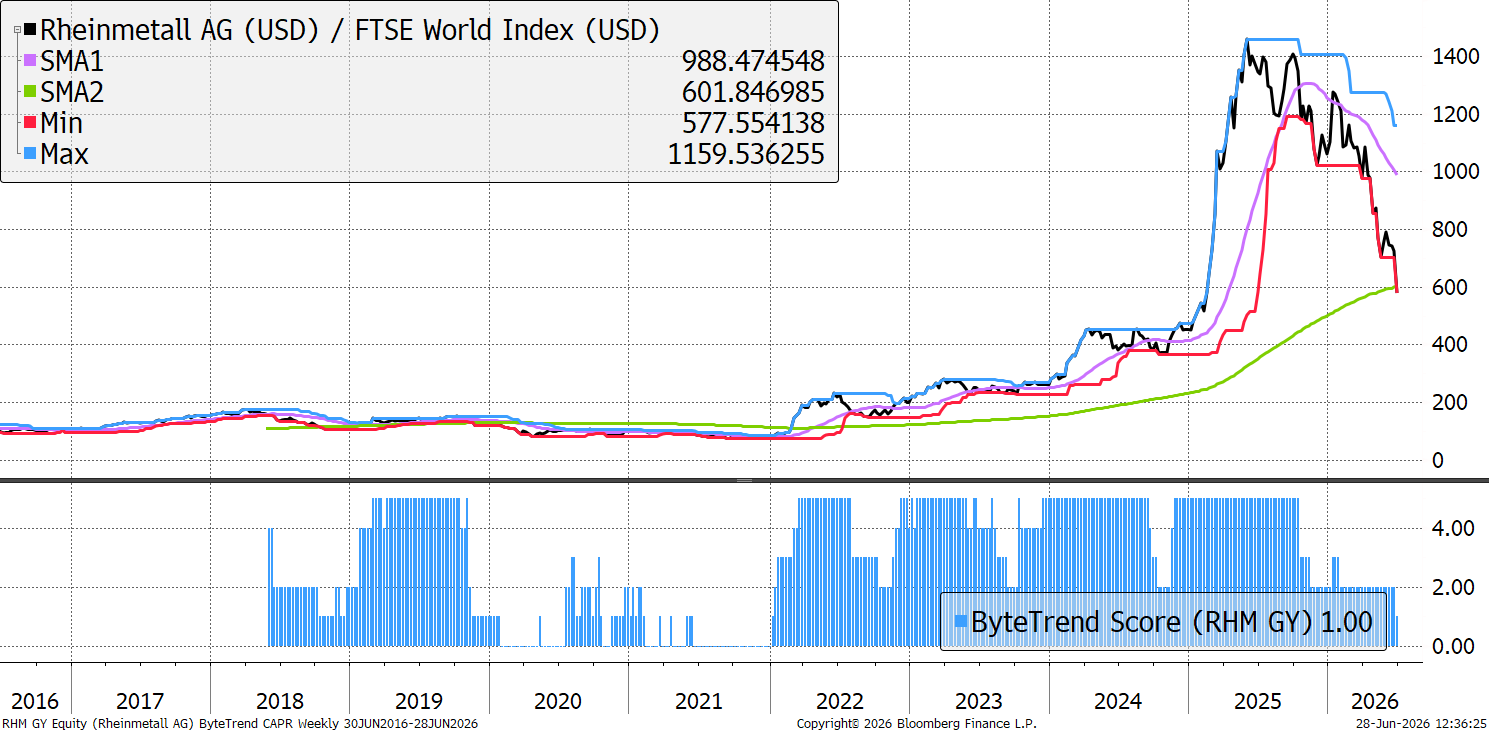
| Rheinmetall AG | 57 | 50 | Advanced Industrial |
Netflix
Netflix has generated no alpha since 2018, despite realising its potential and becoming the world’s most dominant streaming platform in that time. However, many new entrants have arrived in that period, from Disney+ ot HBO Max, increasing the competitive pressure. In mid-2025, it reached the same valuation peak as in 2018, and so despite strong free cash flow growth, the stock is falling back to historically normal levels.
Palantir
The wrangle over the NHS is big news for the UK, but not for Palantir. They are a software and consulting company trading like a defence stock, because they have so many clients in that sector. They have the added boost of AI, but that trend is starting to weaken, too. Despite an enormous fall from its peak, it remains above a rising 200-week moving average, so extended was it from its trend.
Rheinmetall
Remember when this was the hottest stock in Europe? We barely hear about it anymore. It appears that Ukraine is gaining momentum, while a fragile peace has been agreed in the Middle East. More importantly, it soared way ahead of its trend and its fundamentals, predicated on durable demand growth, and as the recent battleship contract failure showed, that’s easier said than done.
Bear Trends
These stocks are trading at the 30-week CAPR lows with a ByteTrend Score of 0. They are in a downtrend. All charts shown are CAPR rebased to 100.
| Name | Annual Vol 30w | Mkt Cap $Bn | Industry |
| Microsoft | 33 | 2771 | Software & Services |
| Tencent Holdings | 26 | 474 | Software & Services |
| Alibaba Group Holding | 43 | 219 | General Retail |
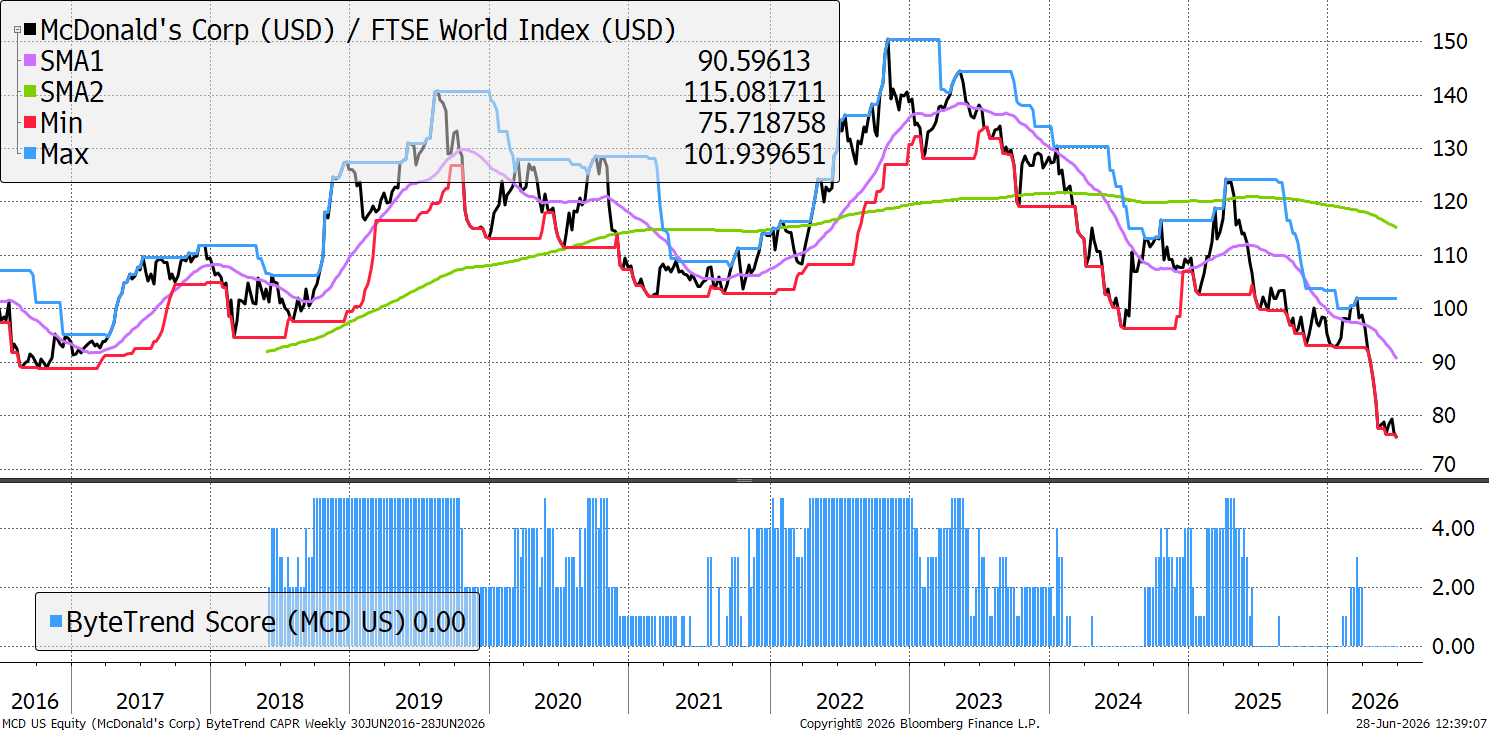
| McDonald's | 17 | 192 | Food & Beverage Producers |
| The Walt Disney Company | 25 | 172 | Media & Entertainment |
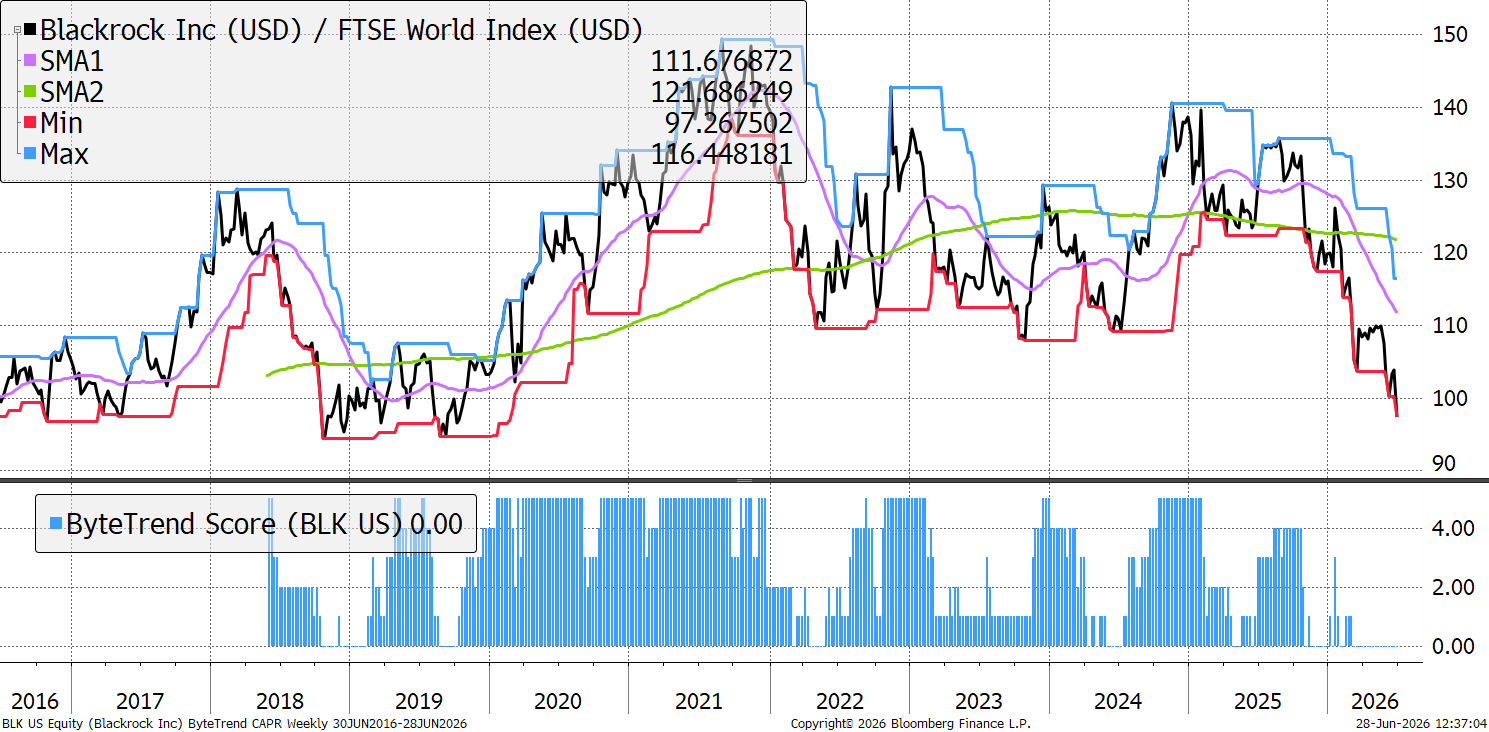
| BlackRock, Inc. | 27 | 150 | Investment & Advisory |
| China Merchants Bank | 20 | 144 | Banking & Lending |
| Pfizer Inc. | 17 | 138 | Healthcare & Life Sciences |
| Ping An Insurance | 28 | 117 | Insurance & Reinsurance |
| PDD Holdings Inc. | 31 | 109 | General Retail |
| Prosus N.V. | 34 | 93 | Software & Services |
| AIA Group | 30 | 93 | Insurance & Reinsurance |
| EssilorLuxottica S.A. | 31 | 88 | Healthcare & Life Sciences |
| China Petroleum | 22 | 87 | Energy Producers & Services |
| BYD Company | 31 | 84 | Automotive & Parts |
| Tata Consultancy Services | 22 | 80 | Software & Services |
| CME Group Inc. | 30 | 80 | Investment & Advisory |
| Postal Savings Bank of China | 17 | 73 | Banking & Lending |
| Brookfield Asset Management | 25 | 71 | Investment & Advisory |
| Northrop Grumman | 30 | 71 | Advanced Industrial |
| Boston Scientific | 43 | 66 | Healthcare & Life Sciences |
| NIKE, Inc. | 40 | 60 | General Retail |
| Hong Kong Exchanges | 16 | 58 | Investment & Advisory |
| TE Connectivity plc | 37 | 58 | Technology Hardware |
| HOYA | 22 | 53 | Healthcare & Life Sciences |
| Meituan | 37 | 51 | General Retail |
| LG Energy Solution, Ltd. | 56 | 51 | Construction & Engineering |
| Wal-Mart de México | 20 | 50 | Food & Beverage |
Blackrock
Is this a sign that passive investing’s dominance is not guaranteed? Certainly, private equity and private credit, in which Blackrock is also a big player, are under huge pressure as large funds (e.g. from Partners Group) are blocking withdrawals in the face of large outflows. While Blackrock fades, retail investor-focused peers like Interactive Brokers have stormed higher. The balance of power has shifted for now.
McDonald’s
The ultimate consumer stock, McDonald's, has faced a weak consumer alongside the dietary threat of weight-loss drugs (GLP-1s), sold by Leading Trend Eli Lilly. It has spent the last few years trading at 10x sales, the kind of multiple usually reserved for high-growth tech stocks, while its 30-year average is more like 4x. This is despite minimal free cash flow growth in the last few years.
GTI 200 Spreadsheet
We are pleased to share the GTI 200 spreadsheet.
Download the spreadsheet below to view the CAPR and local currency scores, and more, for the world’s largest 200 stocks. Have a look at the different groups and the main list “All stocks”.
The Insights tab is interesting, and don’t forget to expand the columns by clicking on the “+” at the top of the page if you want to see more trend data.
Outlook
The rotation is underway with fewer new highs in tech hardware. Insurance, REITs and healthcare in particular, are showing renewed signs of strength. Might this be the top? It is possible, as so many large cap stocks show falling CAPR scores, but I would only be concerned when the rear stocks so signs of weakness in local currency terms.
Thanks for reading GTI.


