
Peace Without Ships


Issue 66;
- Market breadth in leadership drops to another new low as computer hardware dominates
- Energy setback on peace deal
- Market is strong in local currency terms but not in CAPR
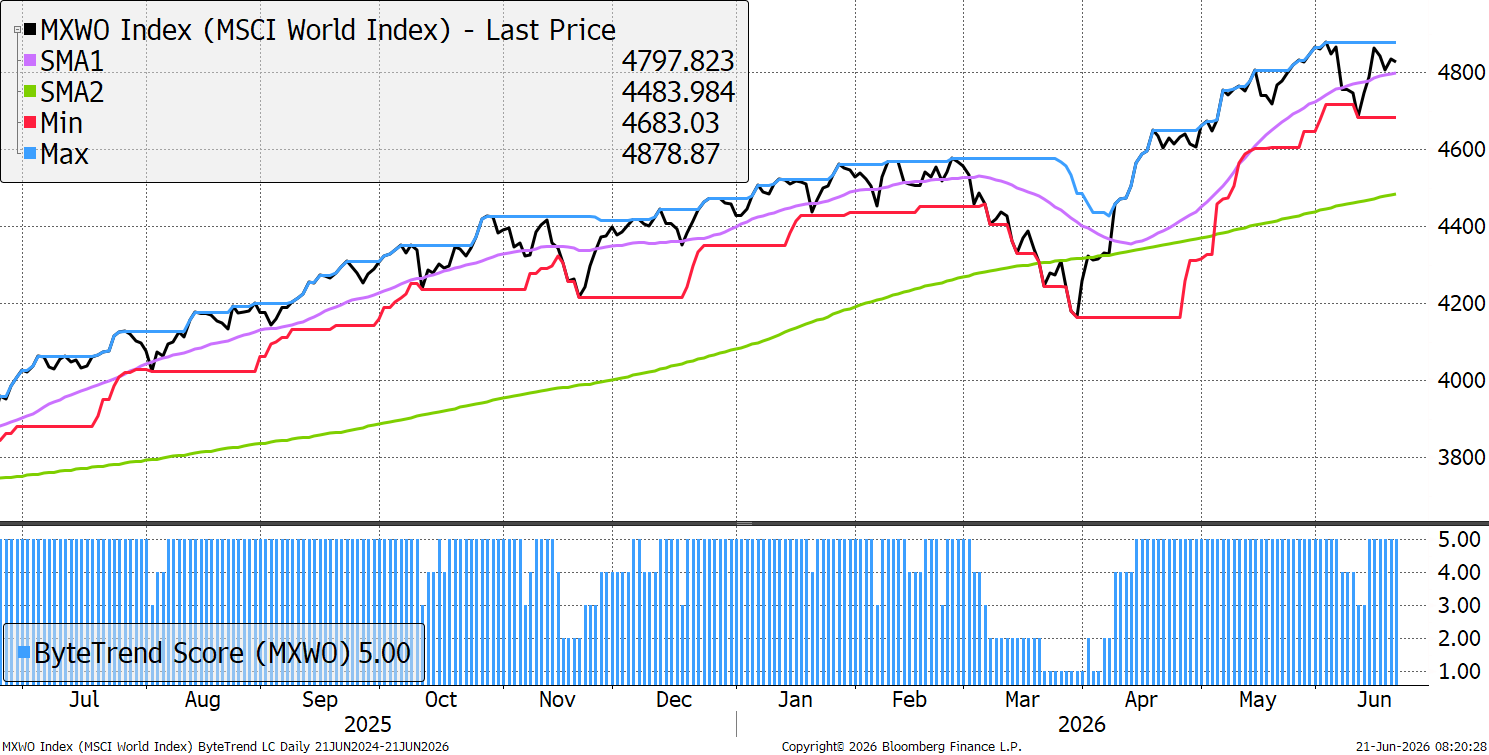
The World Index maintains a bullish ByteTrend Score of 5 in USD. There has been no new high for three weeks.
World Index – Developed Markets – Daily
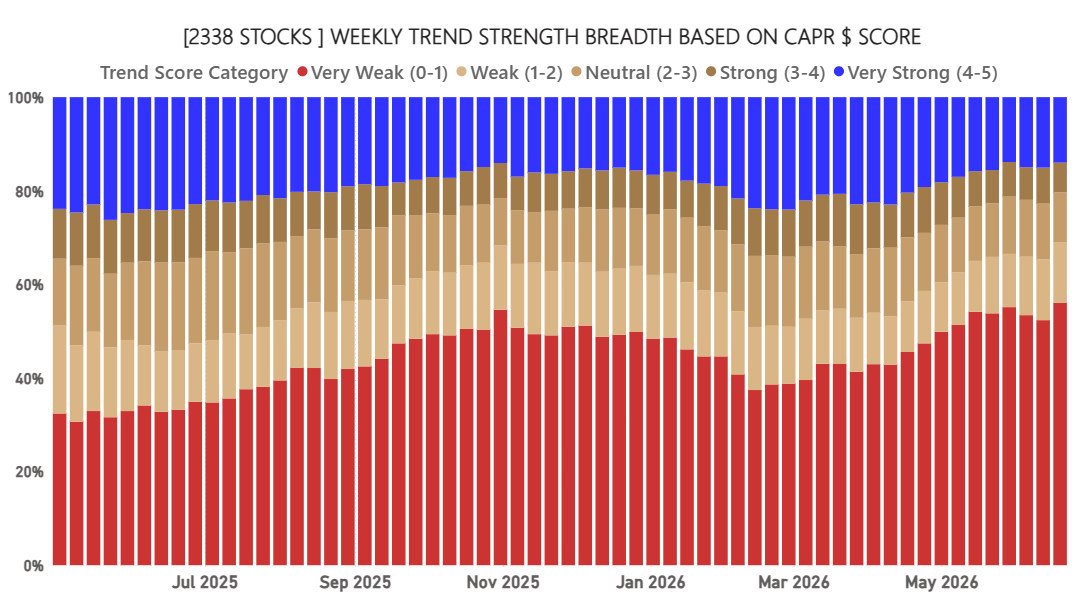
Global Equity Breadth – CAPR
The breadth in CAPR, the number of stocks beating the market, continues to narrow to historically ultra-low levels.
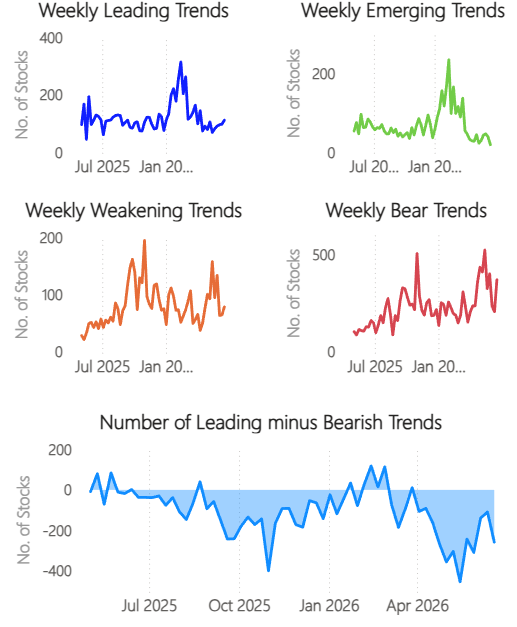
Global Trend Classification in CAPR
There is some modest growth in the leading trends, but a drop in emerging trends to low levels. This highlights the dominance of market leadership, and a severe lull in market rotation.
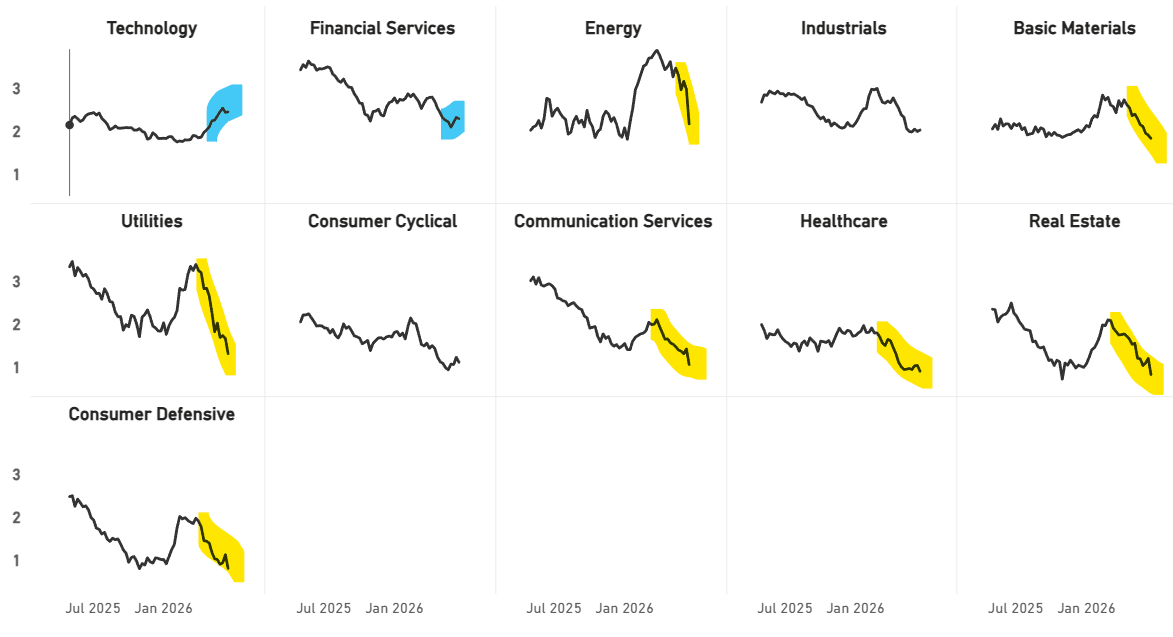
Sector Average Trend Score in CAPR
Technology and finance are doing well, with lows in most other sectors. The peace deal in the Straits of Hormuz has seen energy stocks fall along with basic materials, real estate and consumer defensives. Will the energy flow from here?
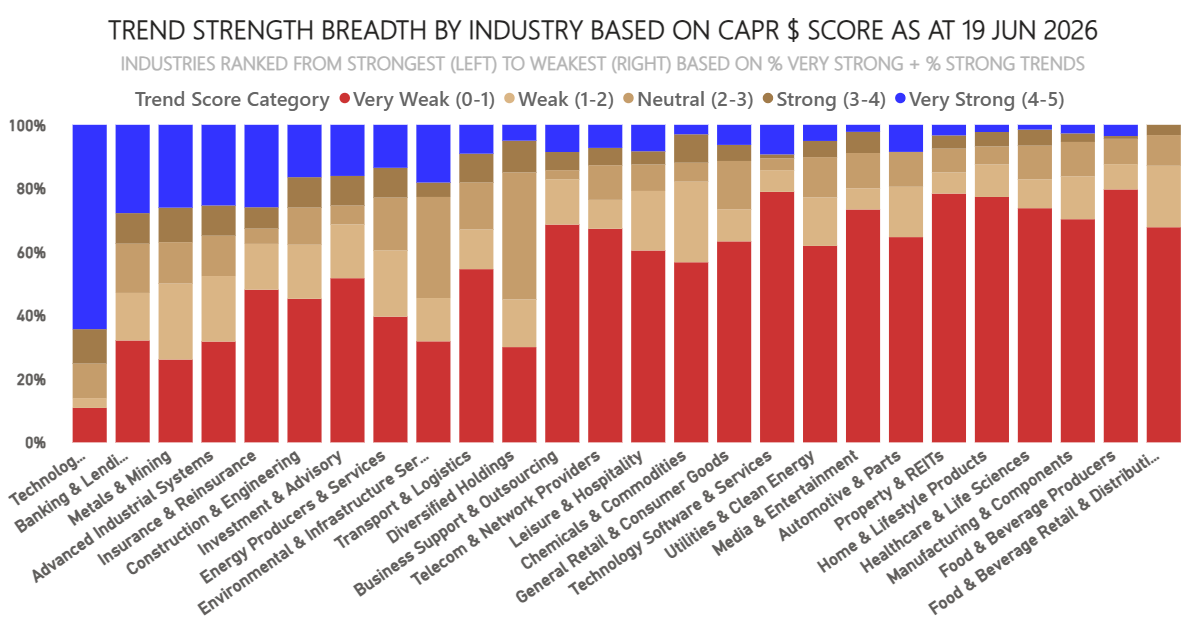
Industry Average Trend Score in CAPR
By the more granular industry group measure, the market leadership is thinly spread.
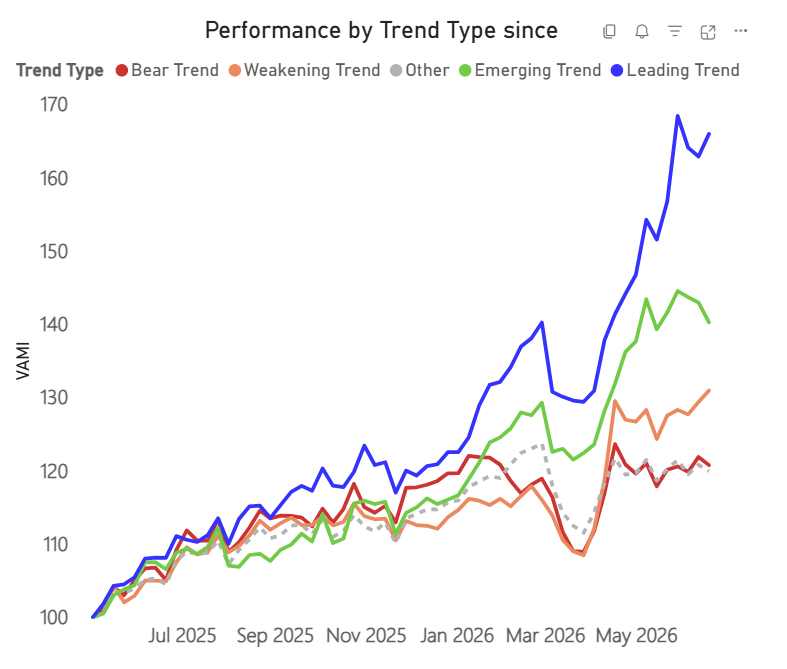
Trend Type Performance
The divergence continues to widen. Emerging trends are weaker, showing low rotation in the market, while weakening trends are bouncing, which are oversold. The leading trends are super strong and most pronounced in Asia and the Americas, and less so in Europe.
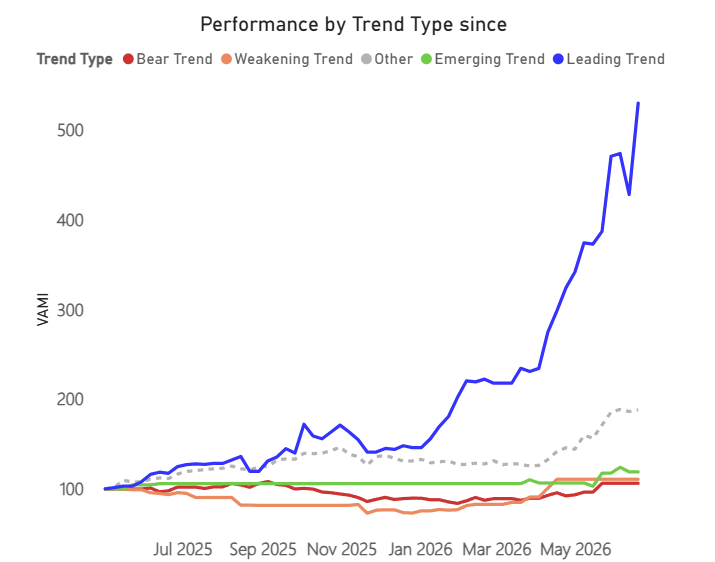
Trend Type Performance – Computer Hardware
The 25 stocks in computer hardware in ByteTrend stand out as the strongest momentum groups. Truly remarkable as the Y-axis has moved from 100 to 500 in just over a year.
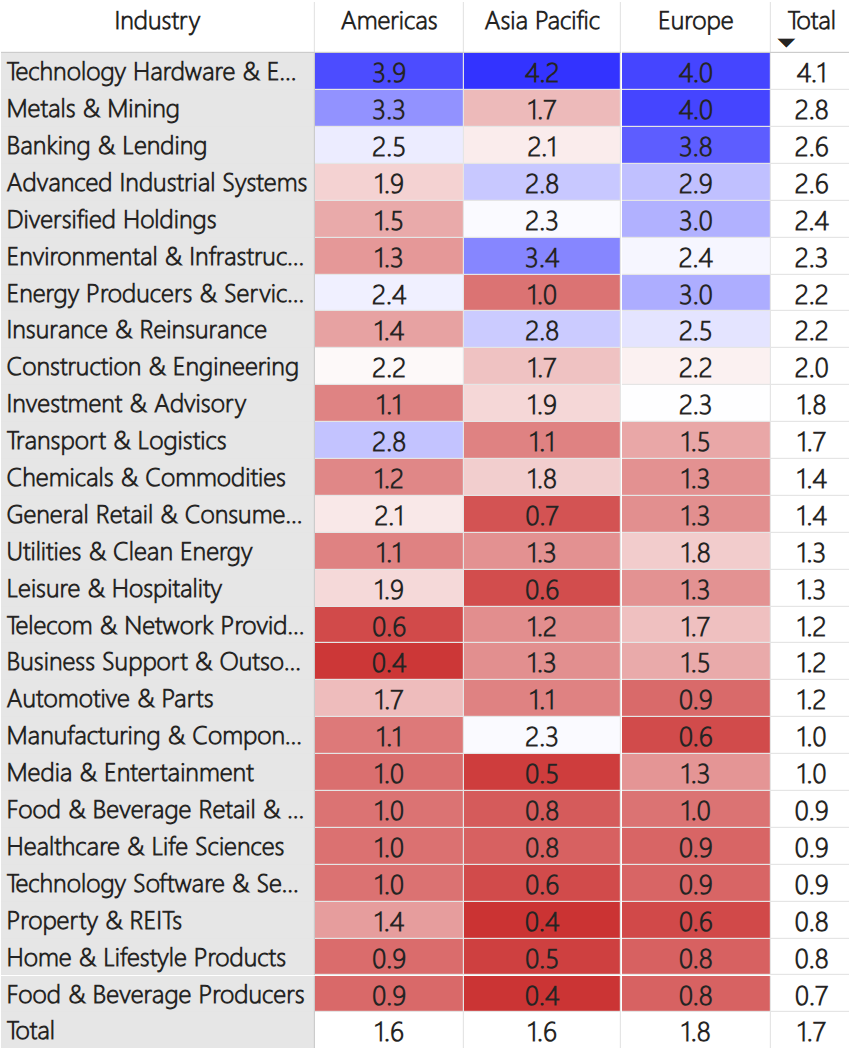
Regions and Industries Average Relative Score
This table (below) shows the average CAPR score for each global industry, by region and in total.
At the top of the table, Hardware is the strongest industry by far, with an average CAPR score of 4.1, vs 2.8 for the next best, Metals and Mining. Metals are also declining sharply, while hardware remains solid, and is strong in all regions. Mining is very weak in Asia. Banking and Lending stocks have bounced, especially in Europe, while Diversified Holdings keep fading lower.
In the middle of the table, Energy Producers are collapsing, especially in Asia, giving back all of their Iran War strength. Utilities are also weak, their link to the AI boom seems to be weakening. Telecoms are the final story here, weakening sharply over the last two weeks. Transport stocks are weak, but standout in America where they remain solid. European and Chinese auto OEMs are in a brutal competitive environment.
At the bottom of the table, Software, REITs, Food & Bev, and Healthcare stocks all weakened, perhaps broadly impacted by the suggestion of higher rates and a stronger dollar after the Fed meeting last Wednesday. REITs show some resilience in the Americas, but nowhere else.
User Guide
Refer to our GTI: User Guide for an overview of the key concepts and terminology used in this report. These concepts may take a little bit of getting used to, but they are very powerful once you do.


