


The Invisible Rotation


Issue 76;
- Dollar drop lifts world index
- AI trade weakens tech, while software and defensives rise
- The rotation drives Bear stocks to outperform Leaders
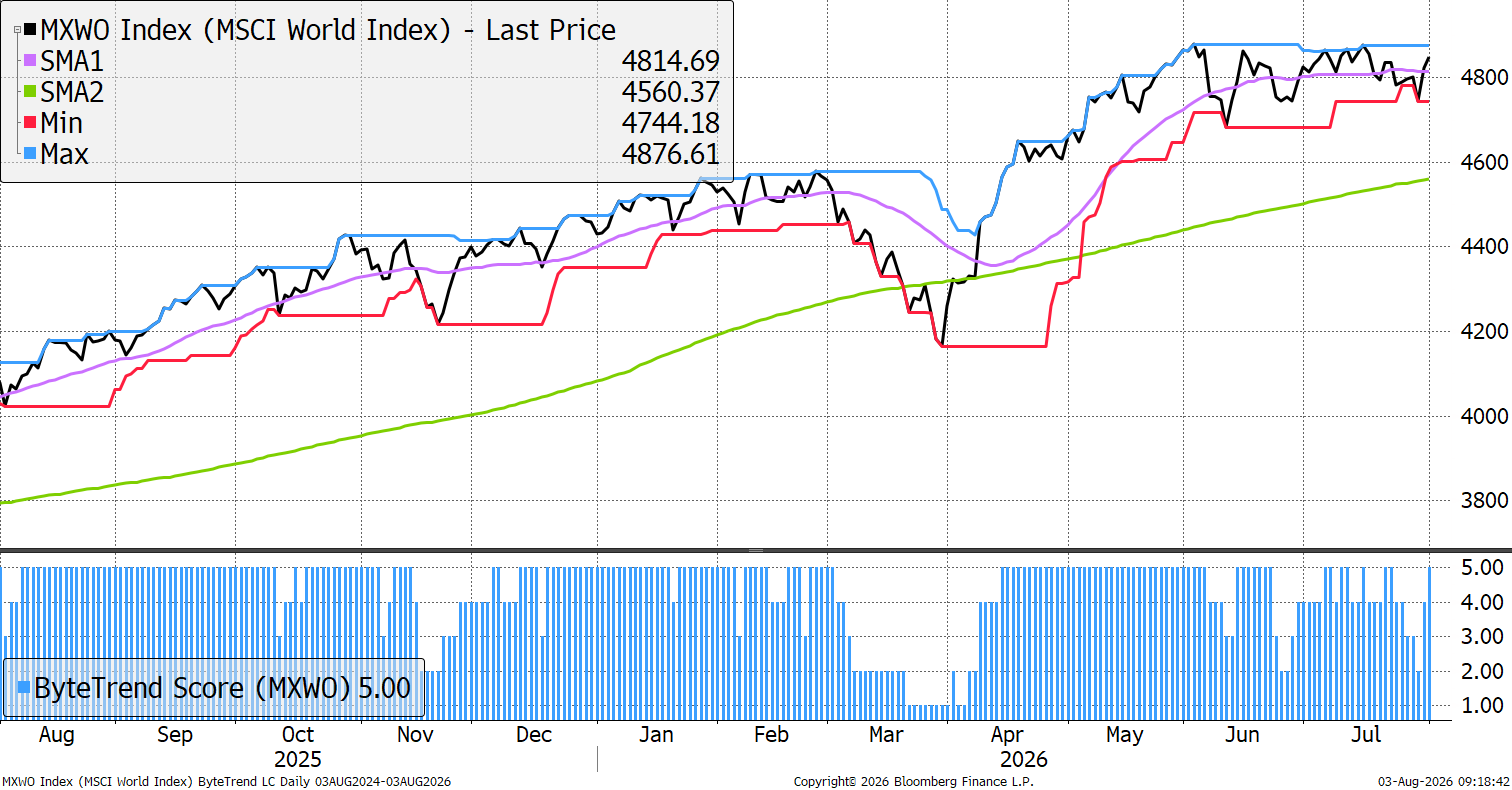
The World Index was weakening, but a rally late in the week returned it to a ByteTrend Score of 5 in USD. It is remarkable how this enormous rotation in equity markets remains invisible from the World Index.
World Index – Developed Markets – Daily
Dollar Weakens
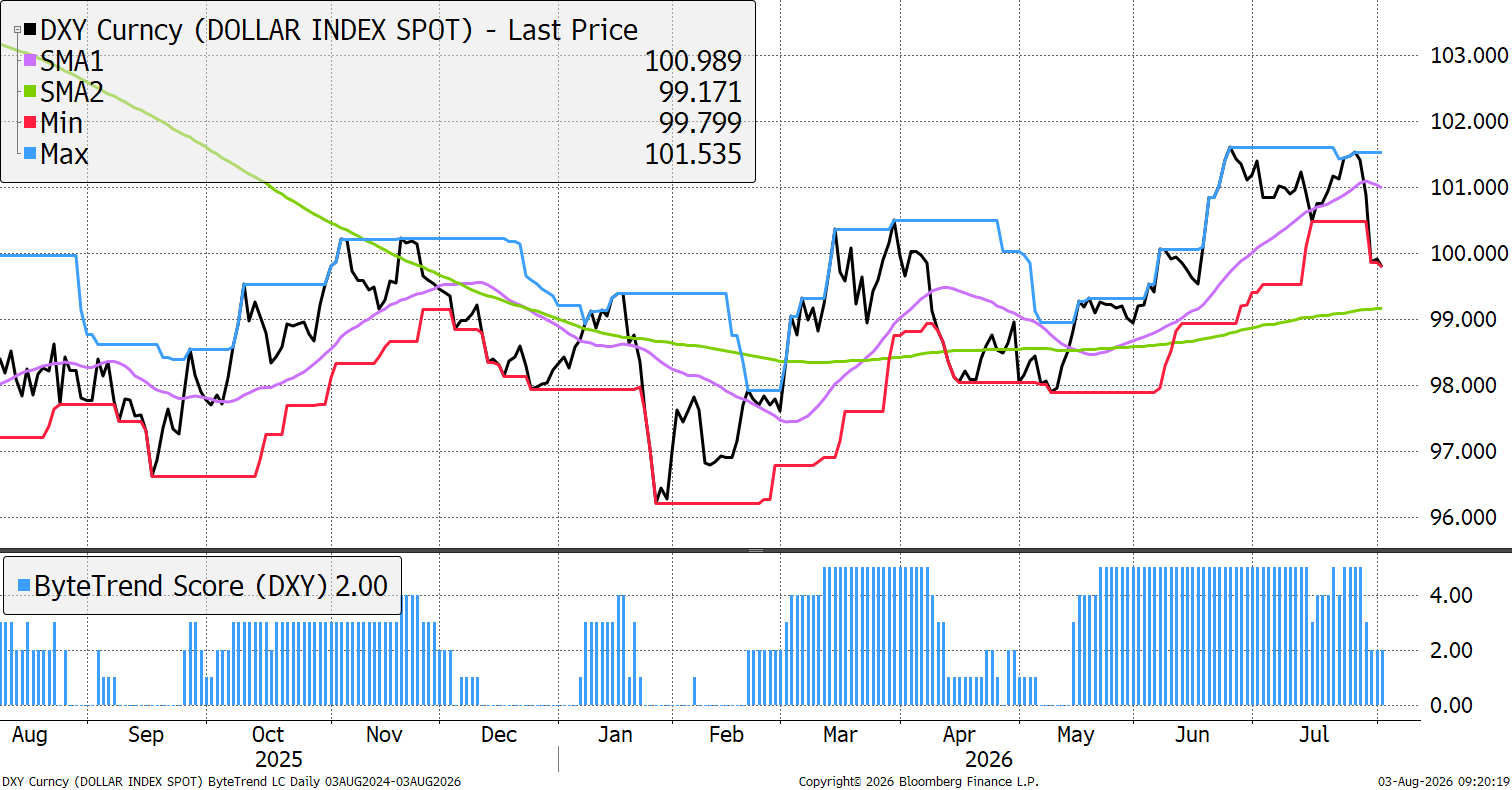
The US Dollar weakened sharply at the same time. The world index is dominated by US stocks (70% of the total), but the remaining 30% are international, so a falling dollar mechanically translates those higher in USD terms, lifting the index without the underlying stocks actually repricing. The weak dollar explains the return to a score of 5.
FX Cross Rates – stripping out the dollar
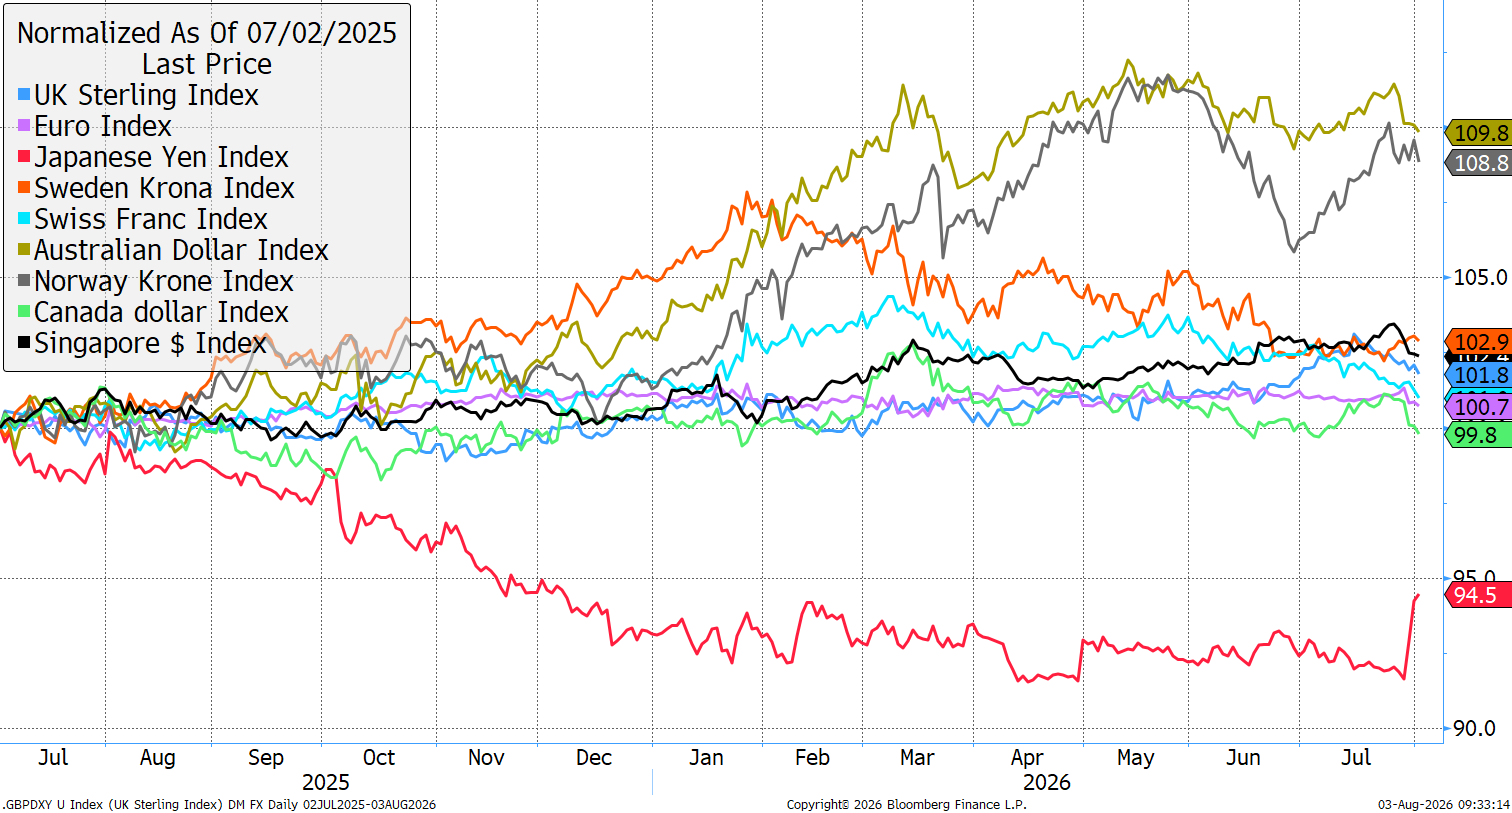
The dollar weakness came through via a stronger yen, following intervention by both the Bank of Japan and the US Treasury. The yen is too cheap, but Japanese rates are too low, making the carry trade attractive.
Regional Performance
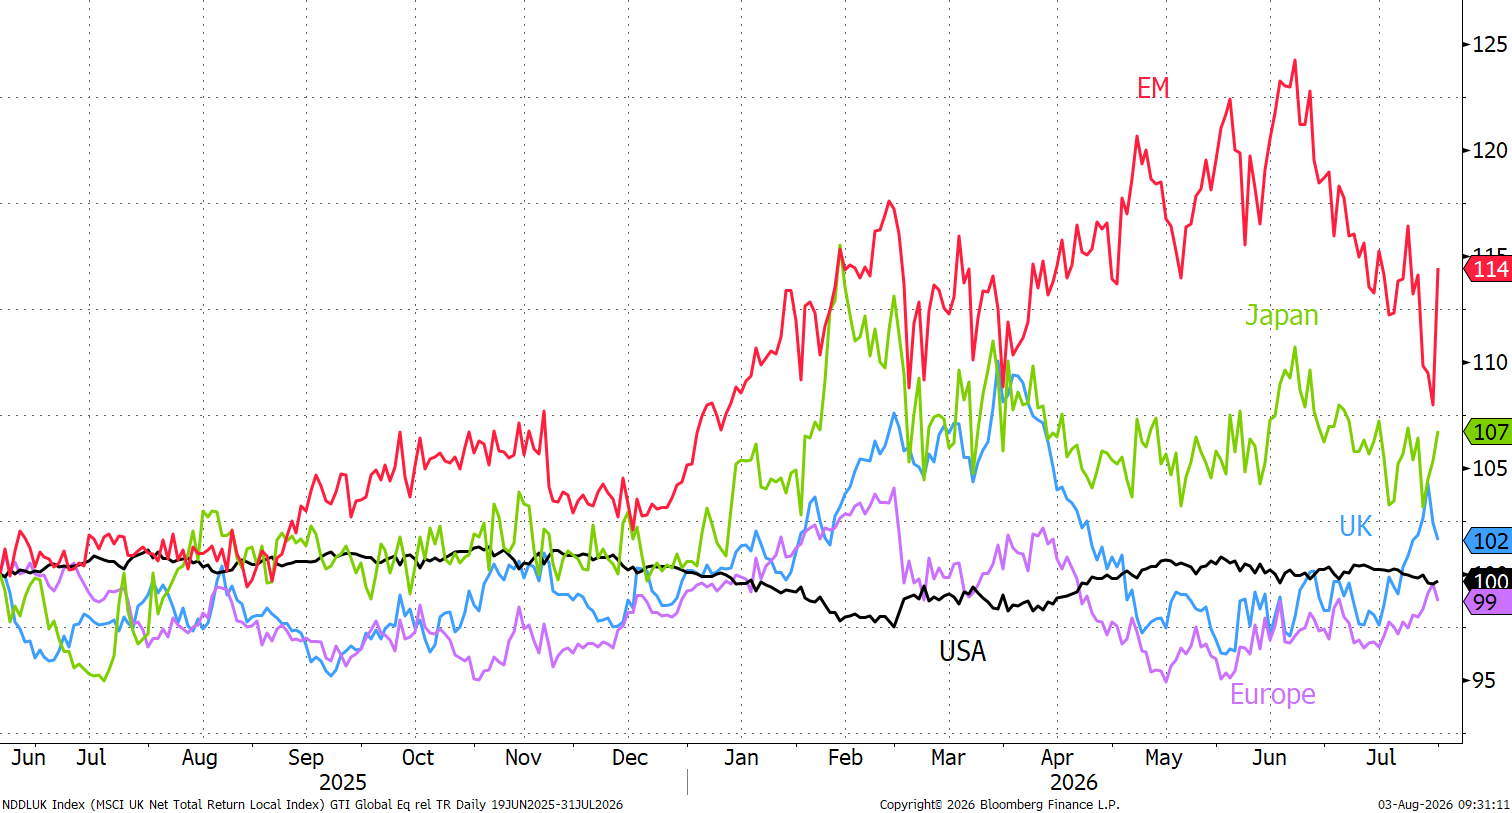
Chips rallied on Friday after a sharp selloff in July, driving EM higher. The UK has been strong while the US market has lagged.
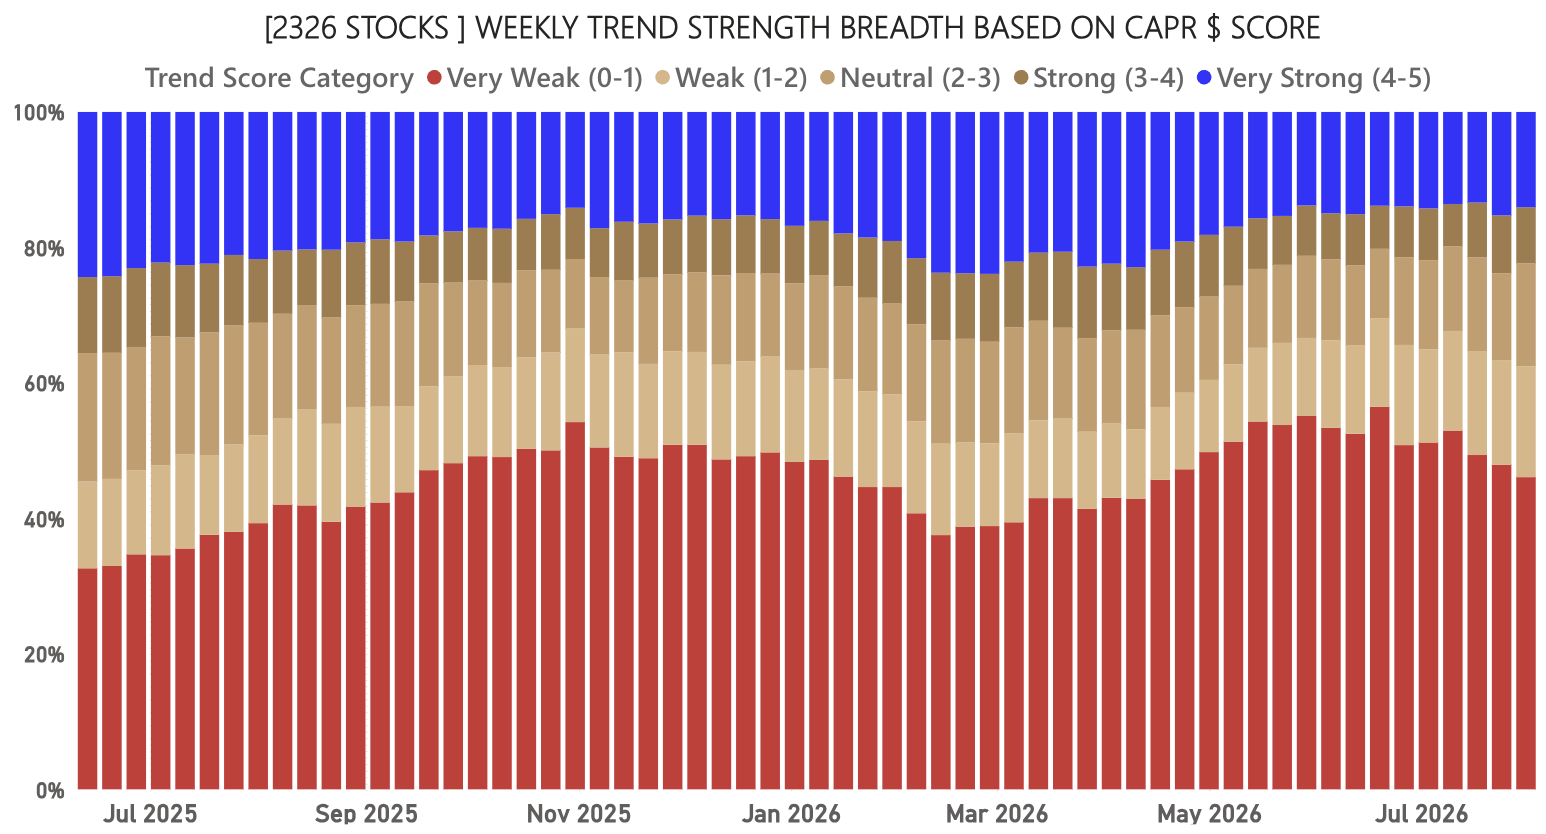
Global Equity Breadth – CAPR
The small increase in strong trends relative to the index last week has reversed. The number of weak trends continues to decline, as formerly weak stocks are improving, becoming neutral trends. A few weeks ago, 70% of stocks were Bear Trends, now, it’s 62%.
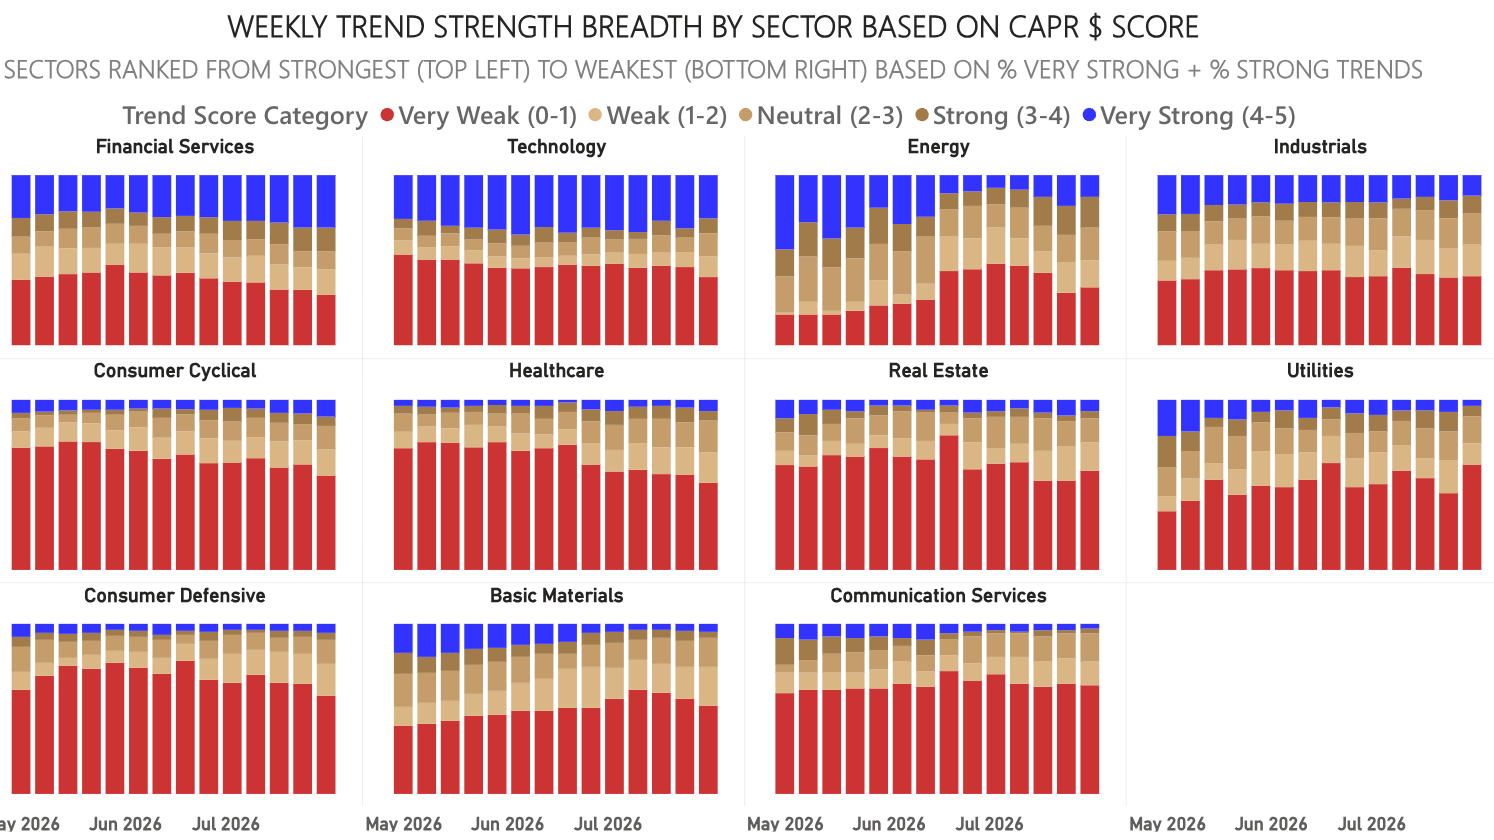
Sector Breadth in CAPR – Financials Lonely at the Top
This shows the breadth by sector. Only Financials have a large and growing proportion of Leading Trends. Technology was stronger in May, but its Leaders are fading. Energy could surge if financial markets lose patience with the President Who Cried Peace Deal. Hormuz remains closed, ships are not moving, and inventories continue to decline, but the tweet remains mightier than the barrel for now. There is little strength elsewhere, although Cyclicals, Healthcare, Real Estate, and Defensives are all seeing their share of Bear Trends decline in this rotation.
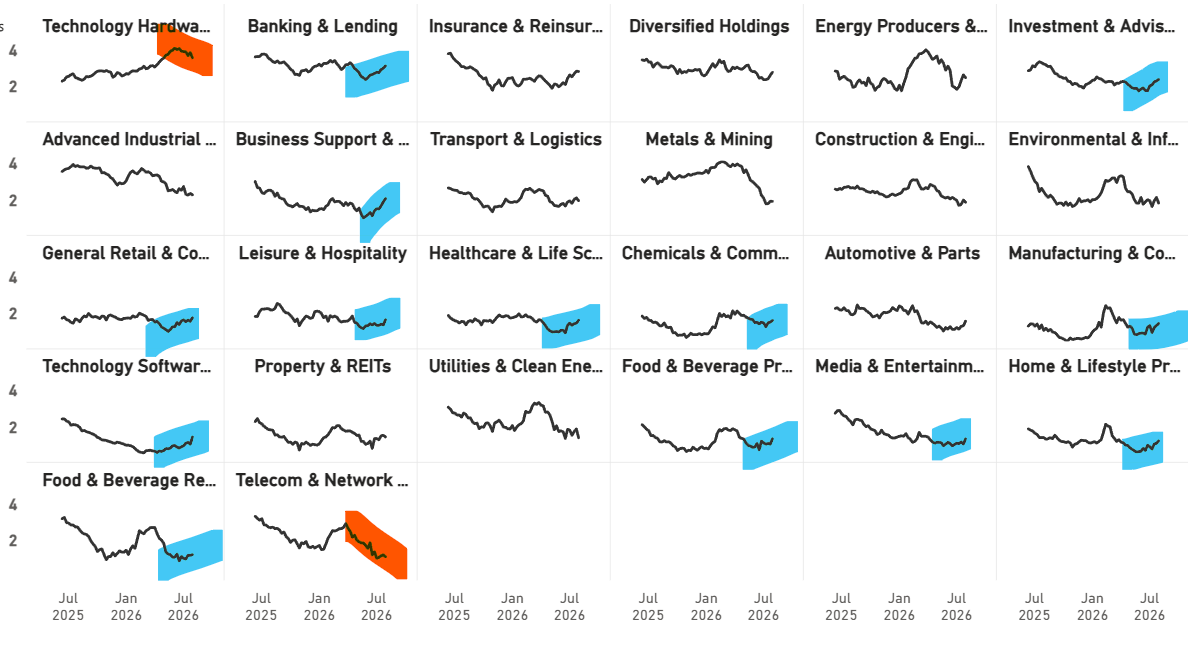
Industry average CAPR Score
The hardware-to-software rotation is clear. Yet many industry groups are perking up. The leadership is broadening.
Net Winners - Stay Long Energy, Materials, Financials
The winners-less-losers metric guides asset allocators. This continues to show how concentrated global alpha is. Only three geographical sectors are delivering outperformance: European Financials and Energy, and Asian Technology. Asian Communications and Consumer Defensives are the weakest.

Trend Classification, CAPR
For the first time since February, there are more Leading Trends than Bears. The deficit has been shrinking since mid-May, as a weaker index and the rotation from Tech into defensive sectors have reduced the number of relative losers.
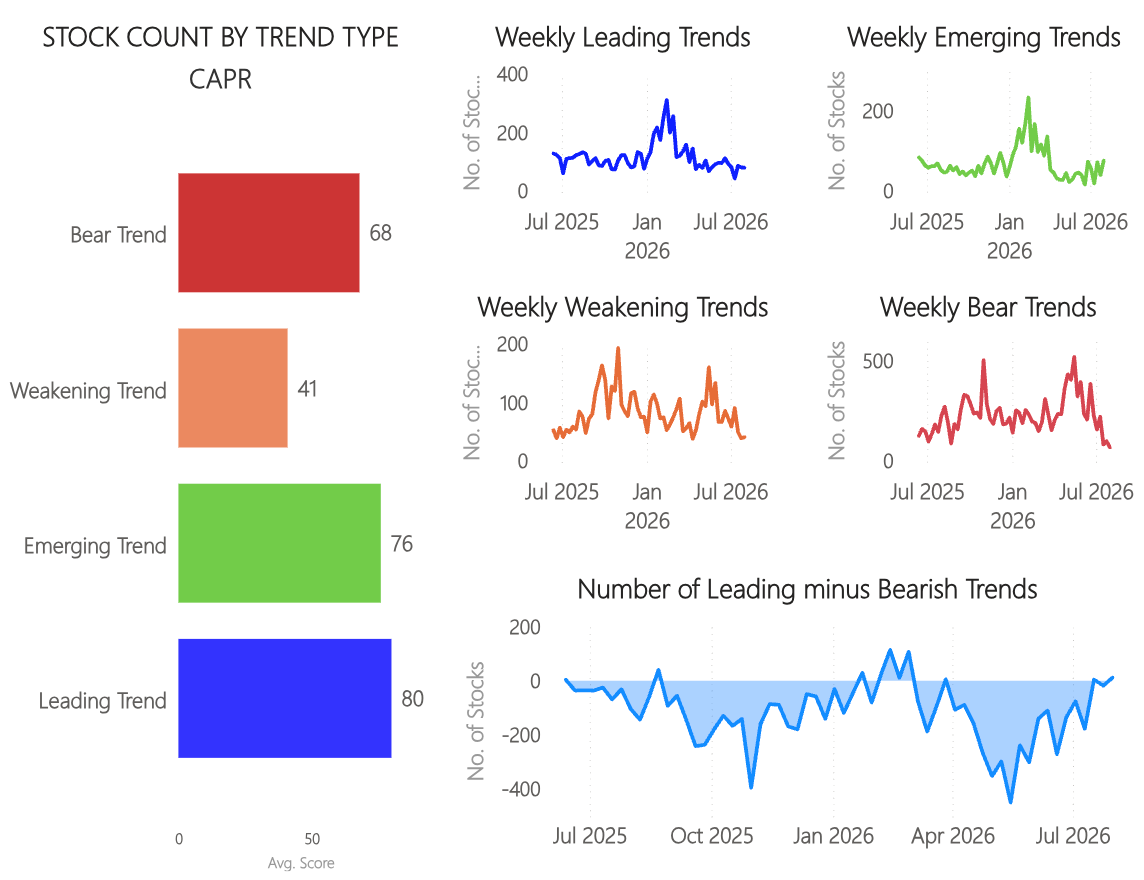
Trend Type Performance
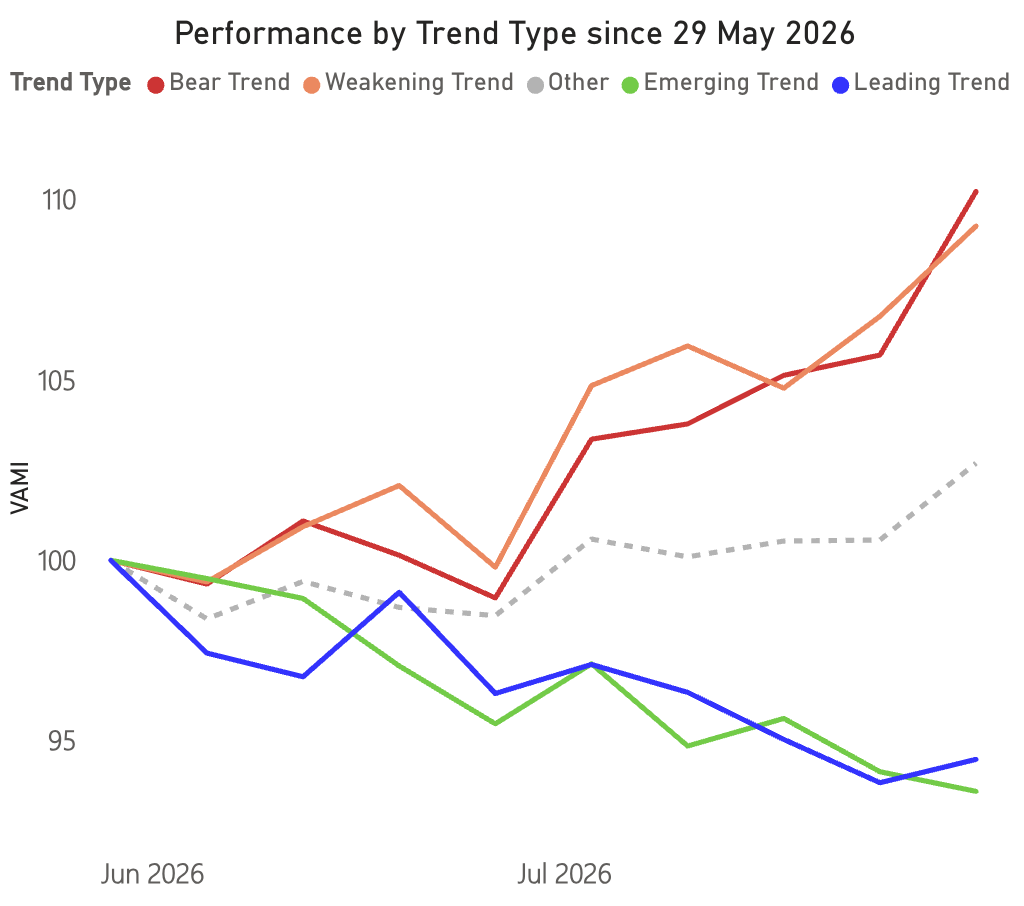
Since the rotation began on 29 May, the Bear and Weakening trends have outperformed the Leading and Emerging categories. This week, Bear trends rose by 4.3%, while the Leaders also rose, by 0.7%. In June and July, Leading has fallen by 6%, while Bear has risen 10%.
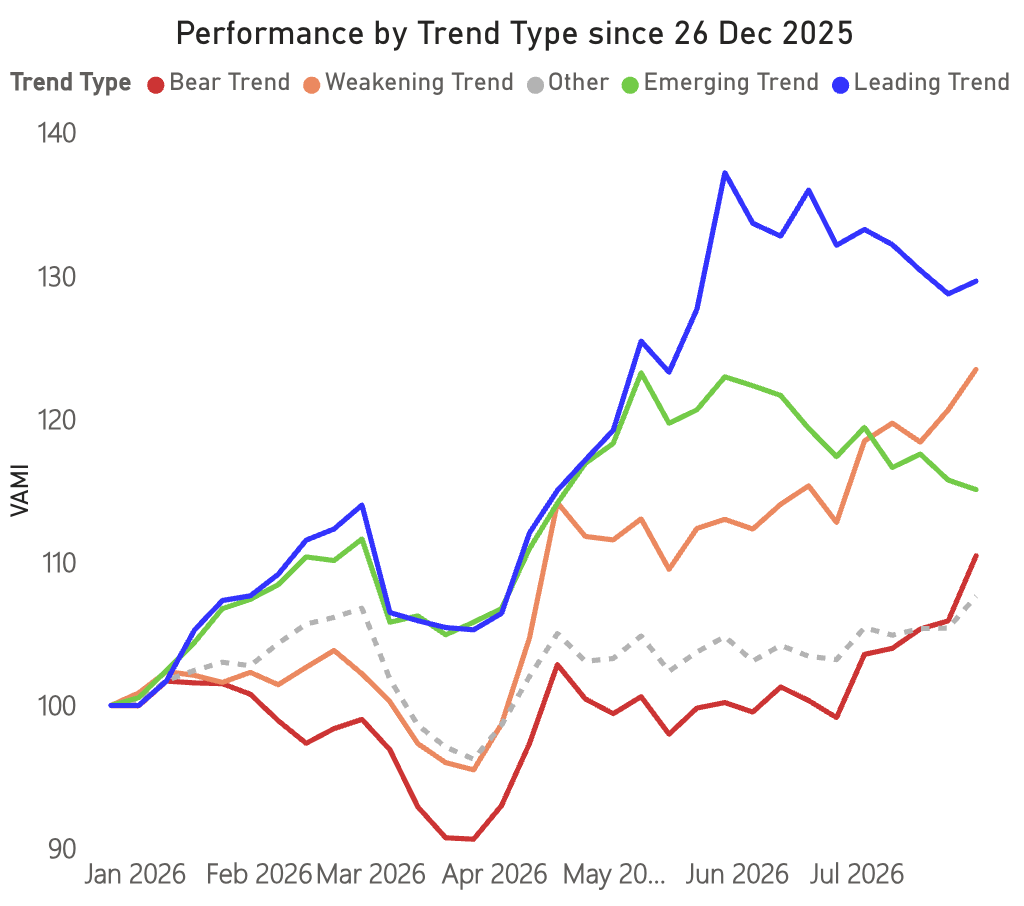
Zooming out, the jaws continue to close, as the Leading Trends’ outperformance fades.
Regions and Industries Average Relative Score
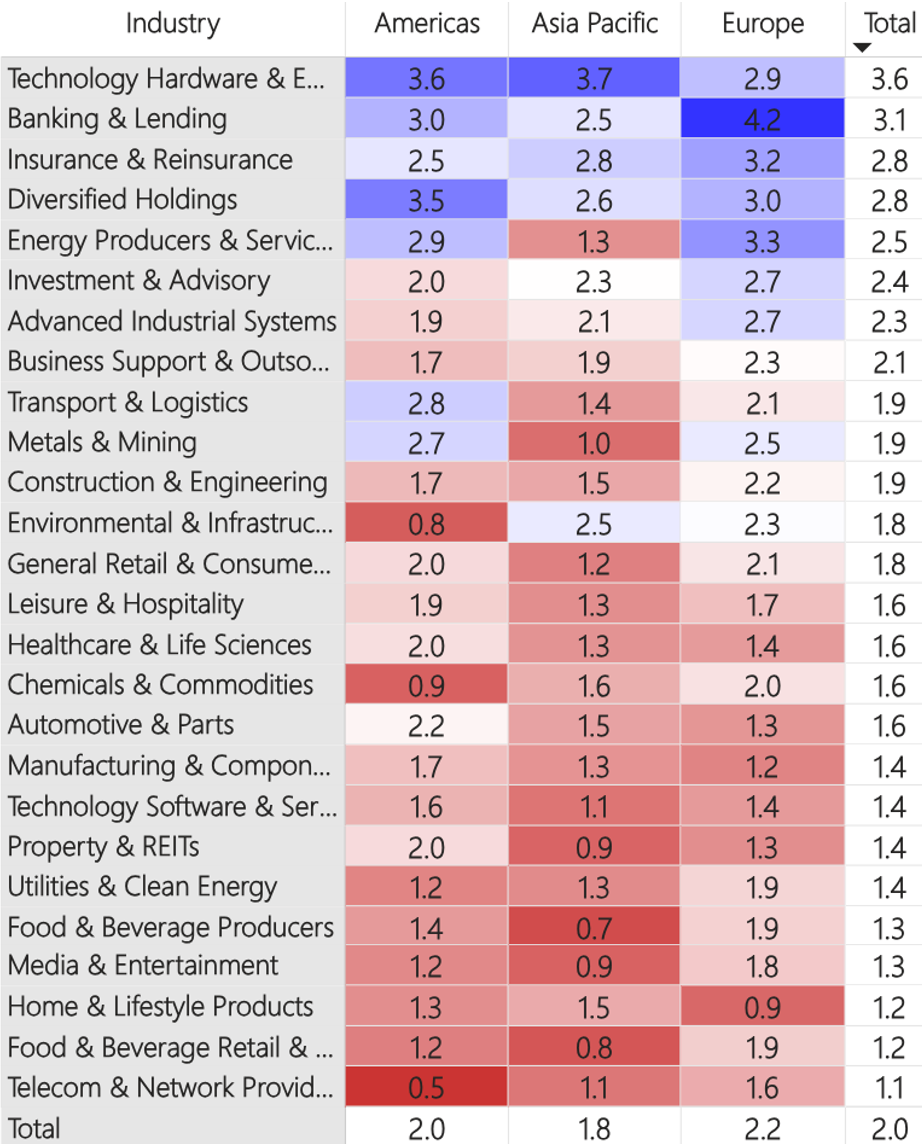
This table (below) shows the average CAPR score for each global industry, by region and in total.
The headline is that Hardware continued to weaken, while software strengthened sharply. Hardware peaked at an average CAPR score of 4.1 in early June, now it’s 3.6 (down from 3.8 a week ago). Software bottomed at an average of 0.6 in February, now it’s 1.4 (a big jump from 1.0 a week ago). These average CAPR score changes reflect the reversing trend strength of each industry.
The broader market rotation stems from this relationship, because Software represents an array of “AI losers”, which are now rallying as the “AI winners” (Hardware) roll over. Healthcare, Automakers, Luxury, Food & Beverage, Media, Leisure, Chemicals, and other value-biased or beaten-down sectors are all picking up. The AI trade had become so large that a trickle of capital out of Tech Hardware leads to a flood back into these unloved areas.
Somewhat separately to this rotation, Financials continue to strengthen, as rates continue their upward march. This includes REITs, albeit from a lower starting point.
User Guide
Refer to our GTI: User Guide for an overview of the key concepts and terminology used in this report. These concepts may take a little bit of getting used to, but they are very powerful once you do.


